

Market Data

October 29, 2018
BEA: Q3 GDP Hits 3.5 Percent, But Trade Disappoints
Written by Peter Wright
Real gross domestic product (GDP) increased 3.5 percent in the third quarter of 2018, according to the “advance” estimate released by the Bureau of Economic Analysis. In the second quarter of 2018, real GDP increased 4.2 percent.
The growth in real GDP reflected increases in consumer spending, inventory investment, government spending and business investment. These increases were partly offset by decreases in exports and housing investment. Imports, which are a subtraction in the calculation of GDP, increased.
GDP is now measured and reported in chained 2012 dollars and on an annualized basis in the second quarter totaled $18.672 trillion. The growth calculation is misleading because it takes the quarter-over-quarter change and multiplies by 4 to get an annualized rate. This makes the high quarters higher and the low quarters lower. Figure 1 clearly shows this effect. The blue line is the trailing 12-months growth and the black line is the headline quarterly result. On a trailing 12-month basis, GDP was up by 3.04 percent in Q3, which was the best result since Q2 2015. To put that result into perspective, the average in 35 quarters since Q1 2010 has been 2.22 percent. The blue line in Figure 1 shows the slow but steady progress of the trailing 12-month result since Q2 2016.
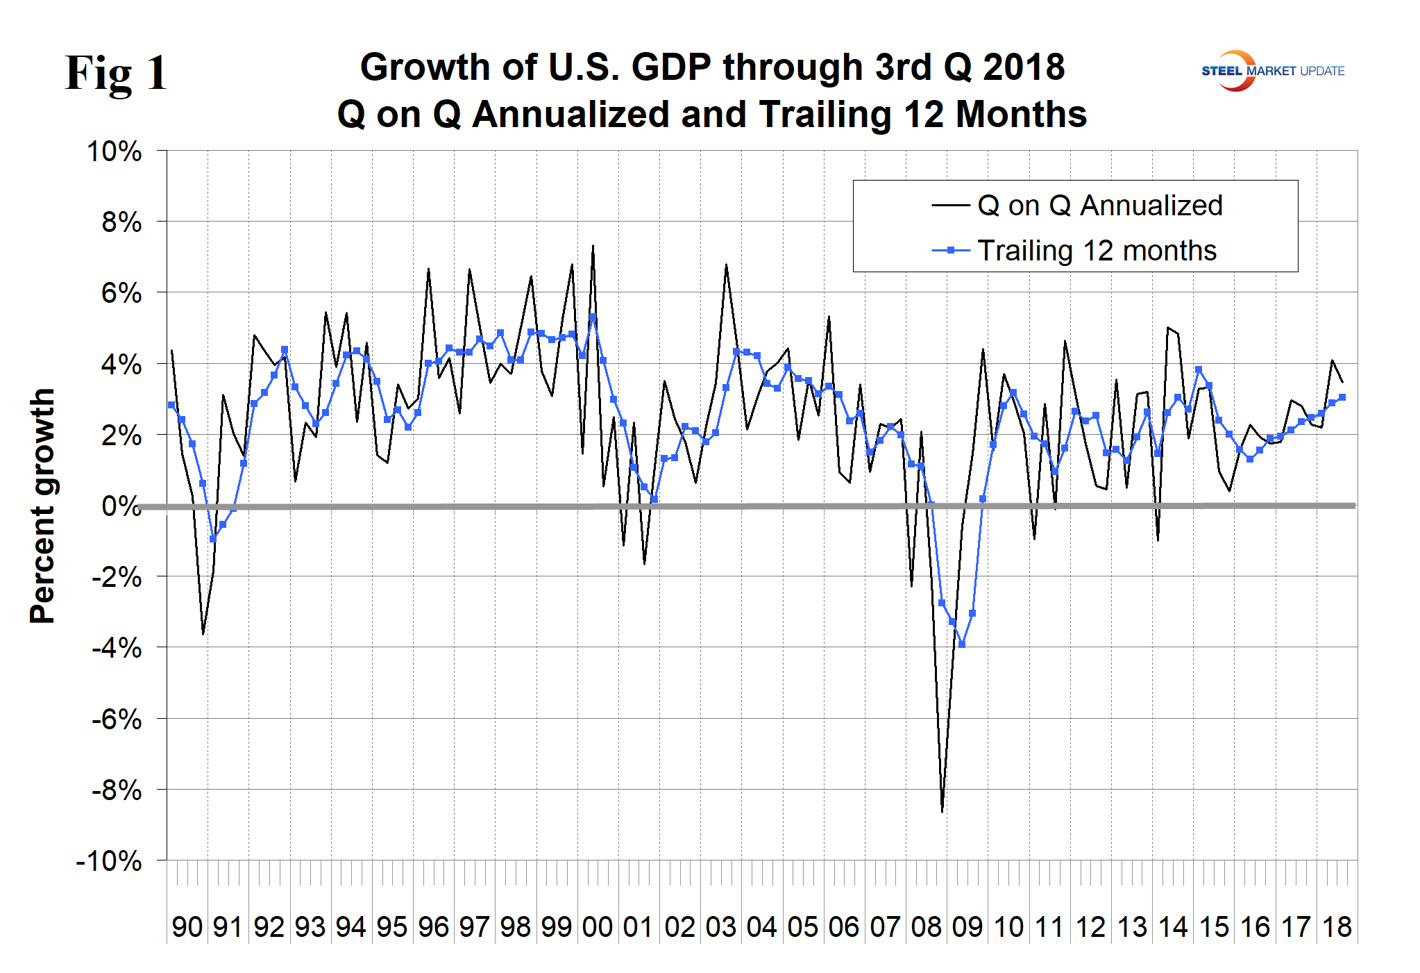
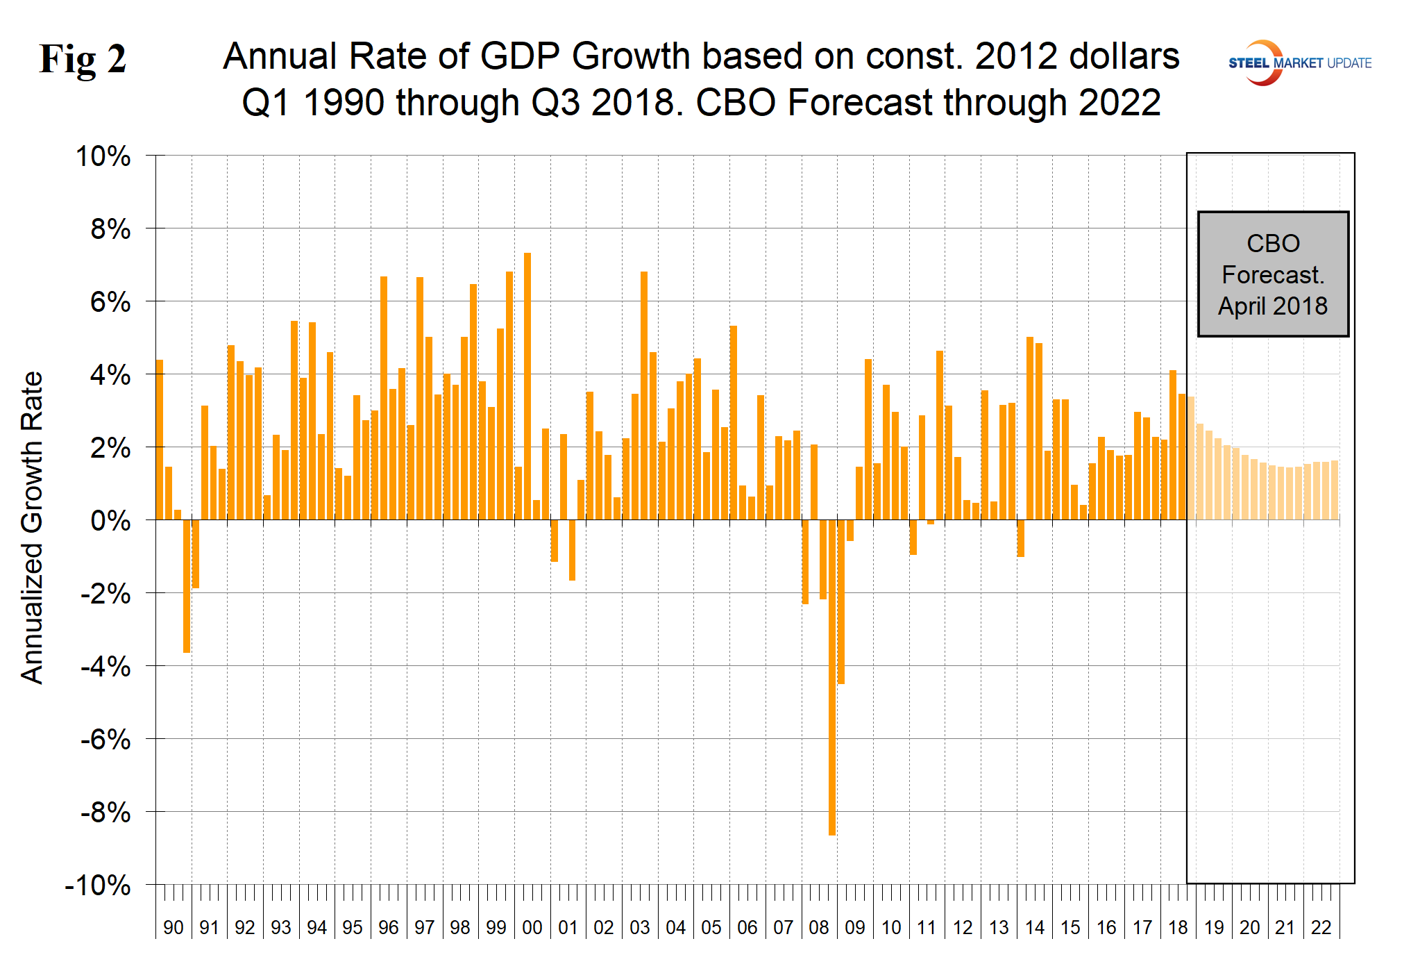
Figure 2 shows the headline quarterly results since 1990 and the April 2018 Congressional Budget Office forecast through 2022. The CBO accurately forecasted the growth rate in Q3 2018 and expects 2018 as a whole to get a boost from the tax break before falling back in 2019. In its October review of the U.S. economy, the IMF wrote: “Growth in the United States, buoyed by a pro-cyclical fiscal package, continues at a robust pace and is driving U.S. interest rates higher. But U.S. growth will decline once parts of its fiscal stimulus go into reverse. Notwithstanding the present demand momentum, we have downgraded our 2019 U.S. growth forecast owing to the recently enacted tariffs on a wide range of imports from China and China’s retaliation.”
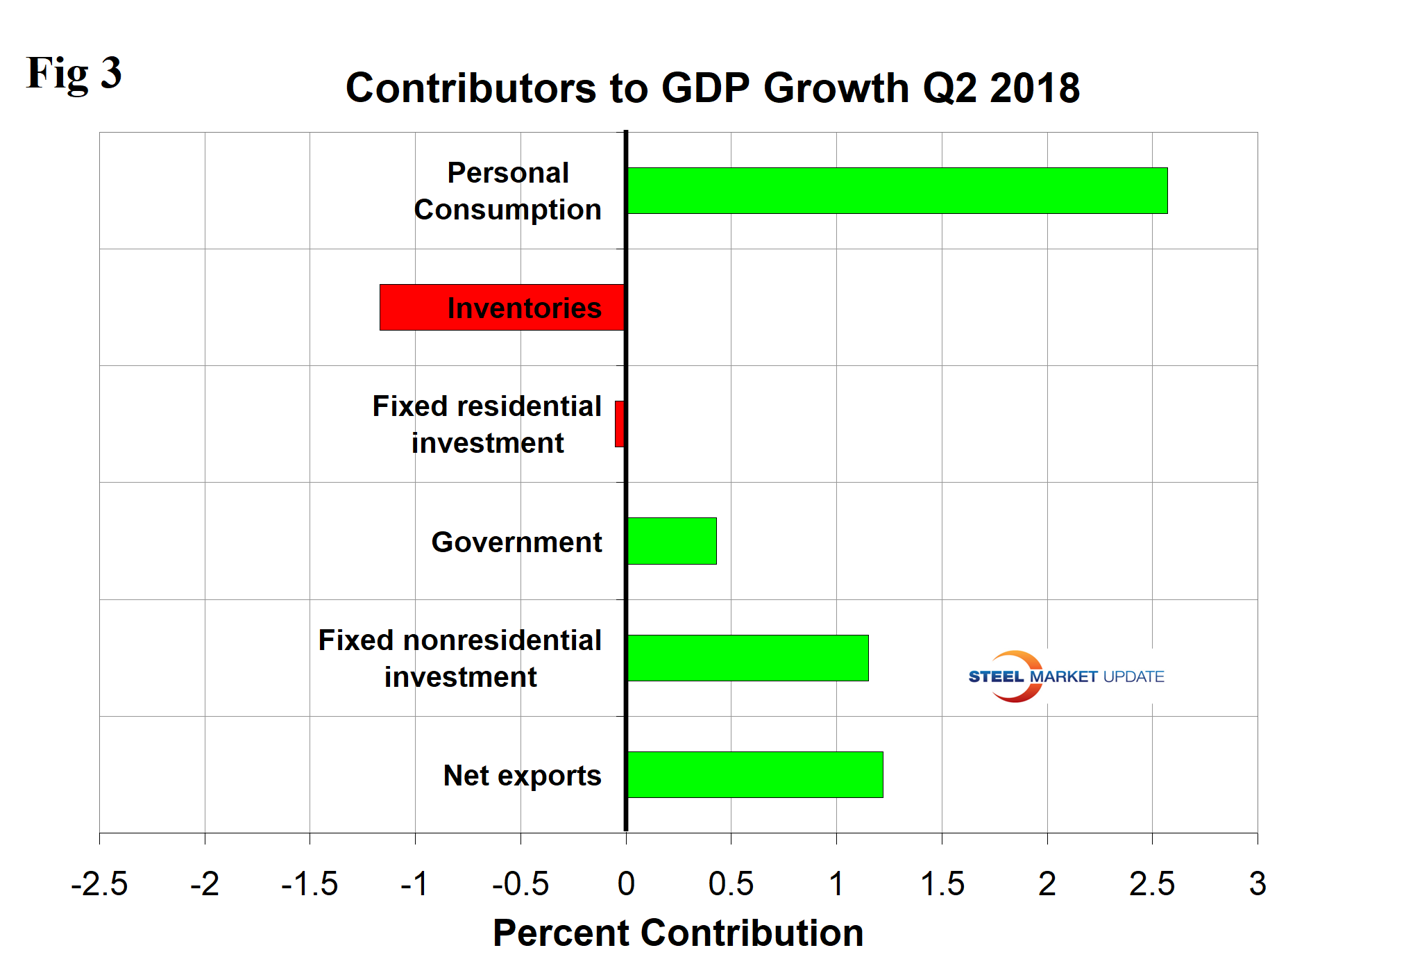
The press has been positive about this latest GDP data, but beneath the surface the mix of contributory components changed drastically from Q2 and not in a good way. Figure 3a shows the magnitude of the contribution of the six major subcomponents of GDP in Q3 2018. Normally, personal consumption is the dominant growth driver and this was the case in Q3. Personal consumption includes goods and services, the goods portion of which includes both durable and non-durables. The bad news is that trade was a serious drag in Q3. Net exports had the largest negative contribution since we began the detailed analysis in Q1 2007. It’s too early to conclude that this deterioration was a result of the Trump trade policies. What made the headline number respectable was the effect of an increase in inventories, which was the greatest since Q4 2011. The contribution of inventories increased from negative 1.17 percent in Q2 2018 to positive 2.07 percent in Q3 2018, a swing of 3.24 percent, which was almost the same as the whole headline result. Rising inventories are entered as a positive in the GDP calculation. Note that in the definitions at the end of this piece, inventories are not mentioned. Over the long run, inventory changes are a wash and simply move growth from one period to another. In Q3, the contributions of inventories and net exports did almost an equal and opposite reversal, and we have included Figure 3 from our last update for the Q2 report to make this point.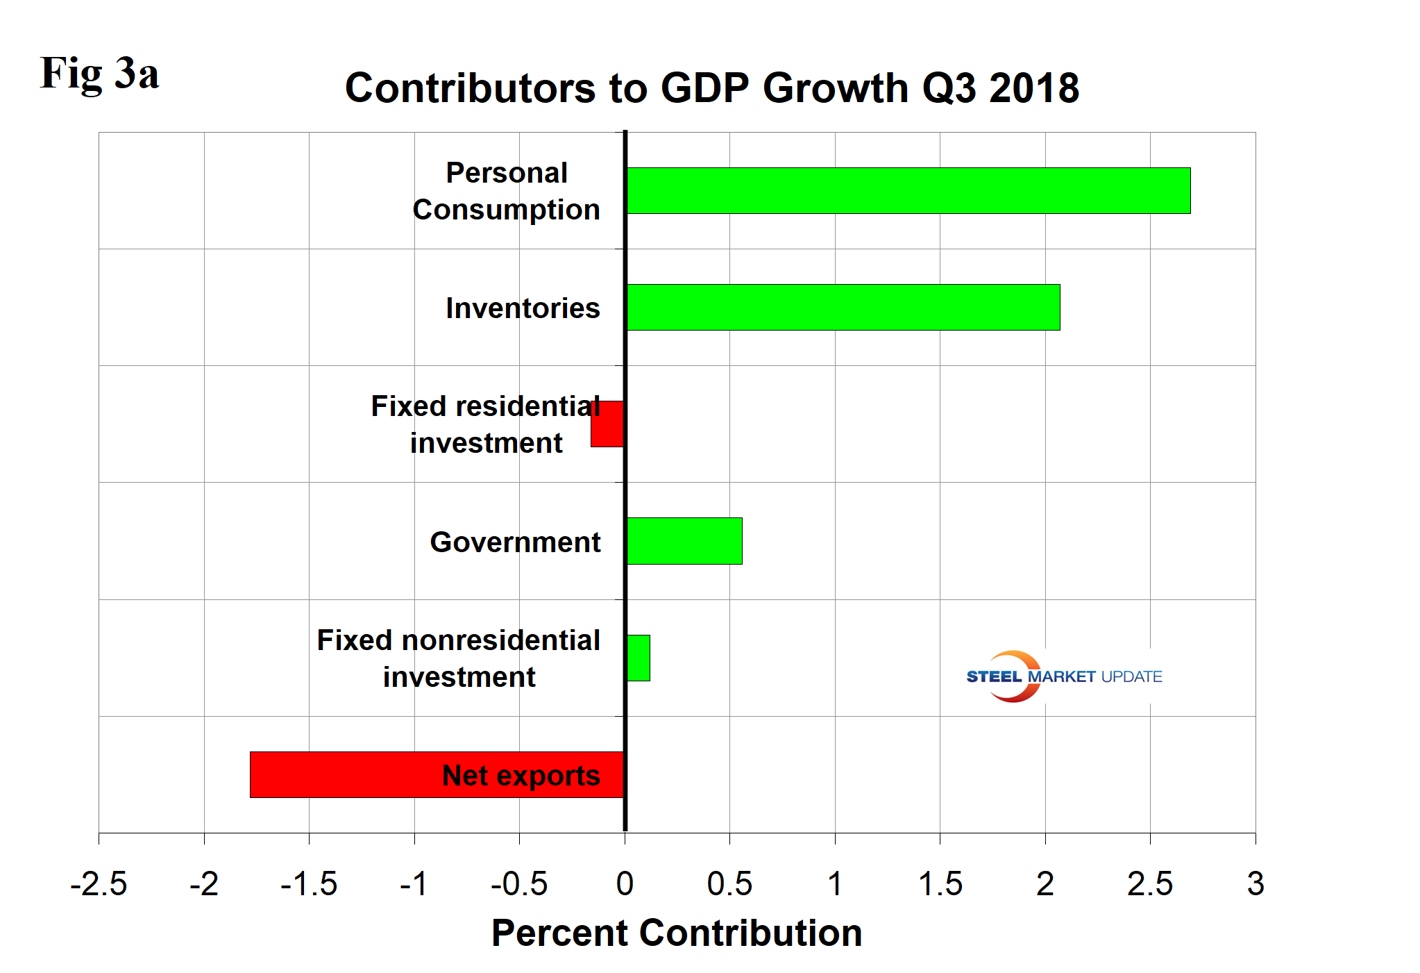
This month, for the first time, we have developed Figure 4, which shows the contributions of residential and non-residential investment. After the recession, non-residential investment bounced back, but residential did not and has trundled along with less than a 1 percent variation since Q3 2010. Non-residential has declined from a 1.47 percent contribution in Q1 2018 to 0.12 percent in Q3. The contribution of government expenditures was positive 0.56 percent in Q3.
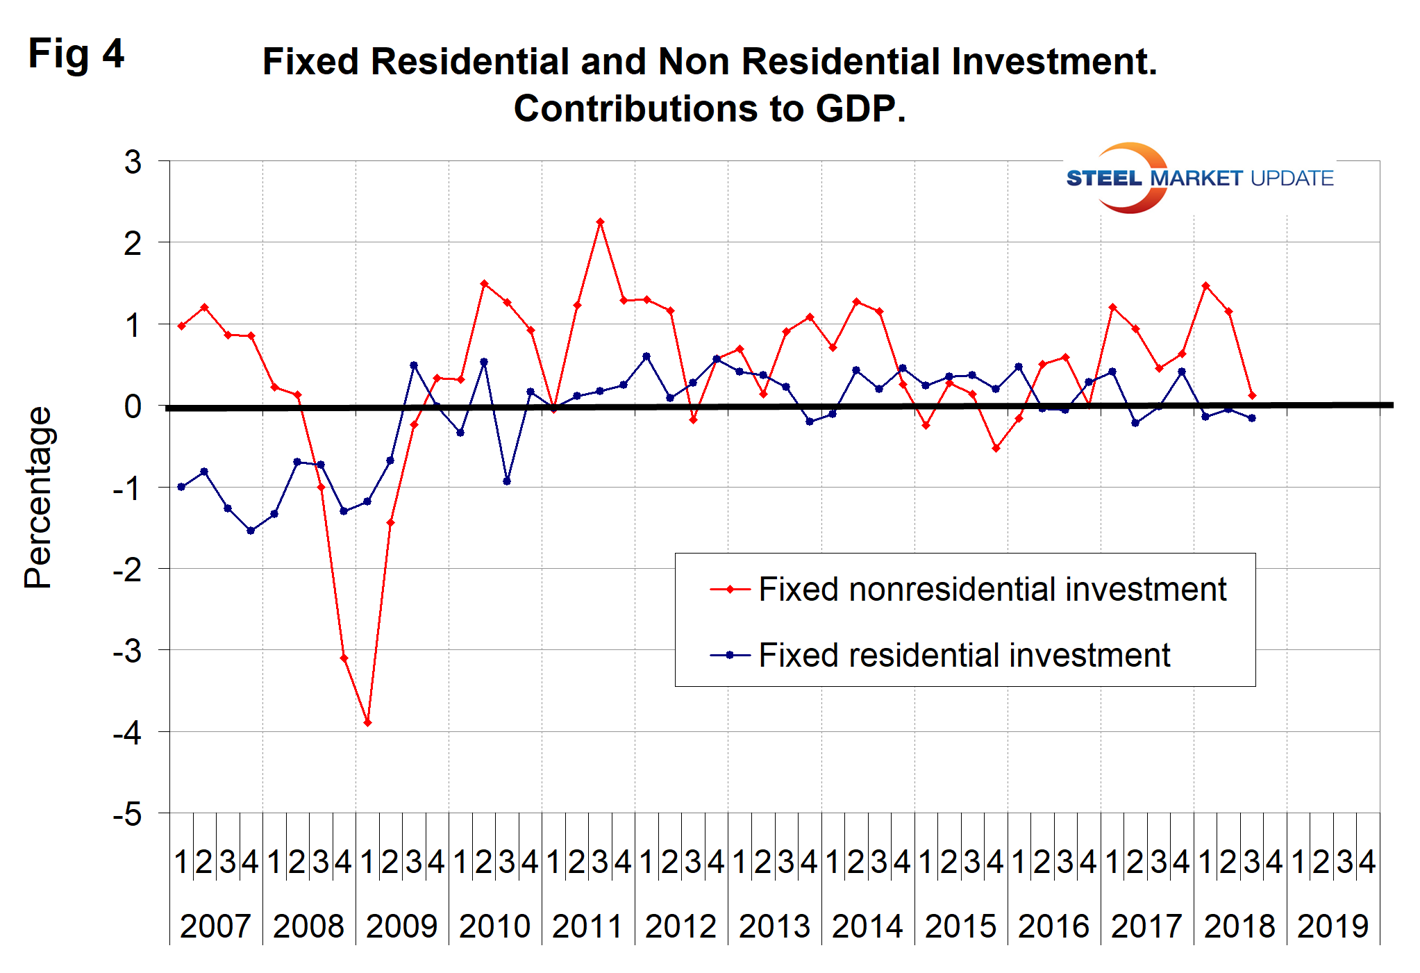
Figure 5 shows the quarterly contributors of the six major subcomponents of GDP since Q1 2007. This chart clearly shows the whipsaw effect of inventory changes.
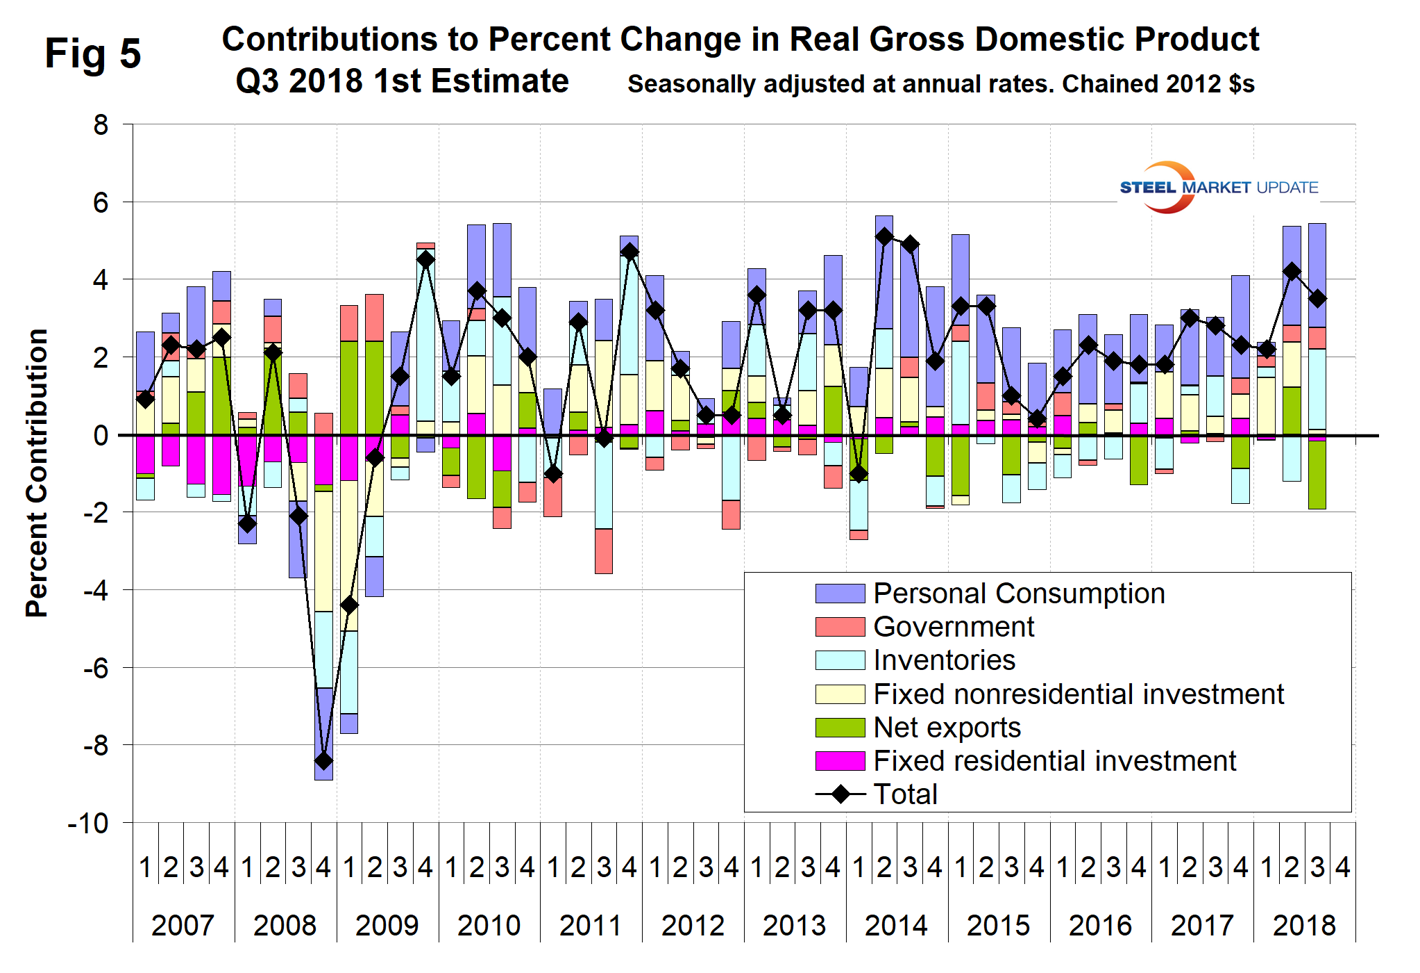
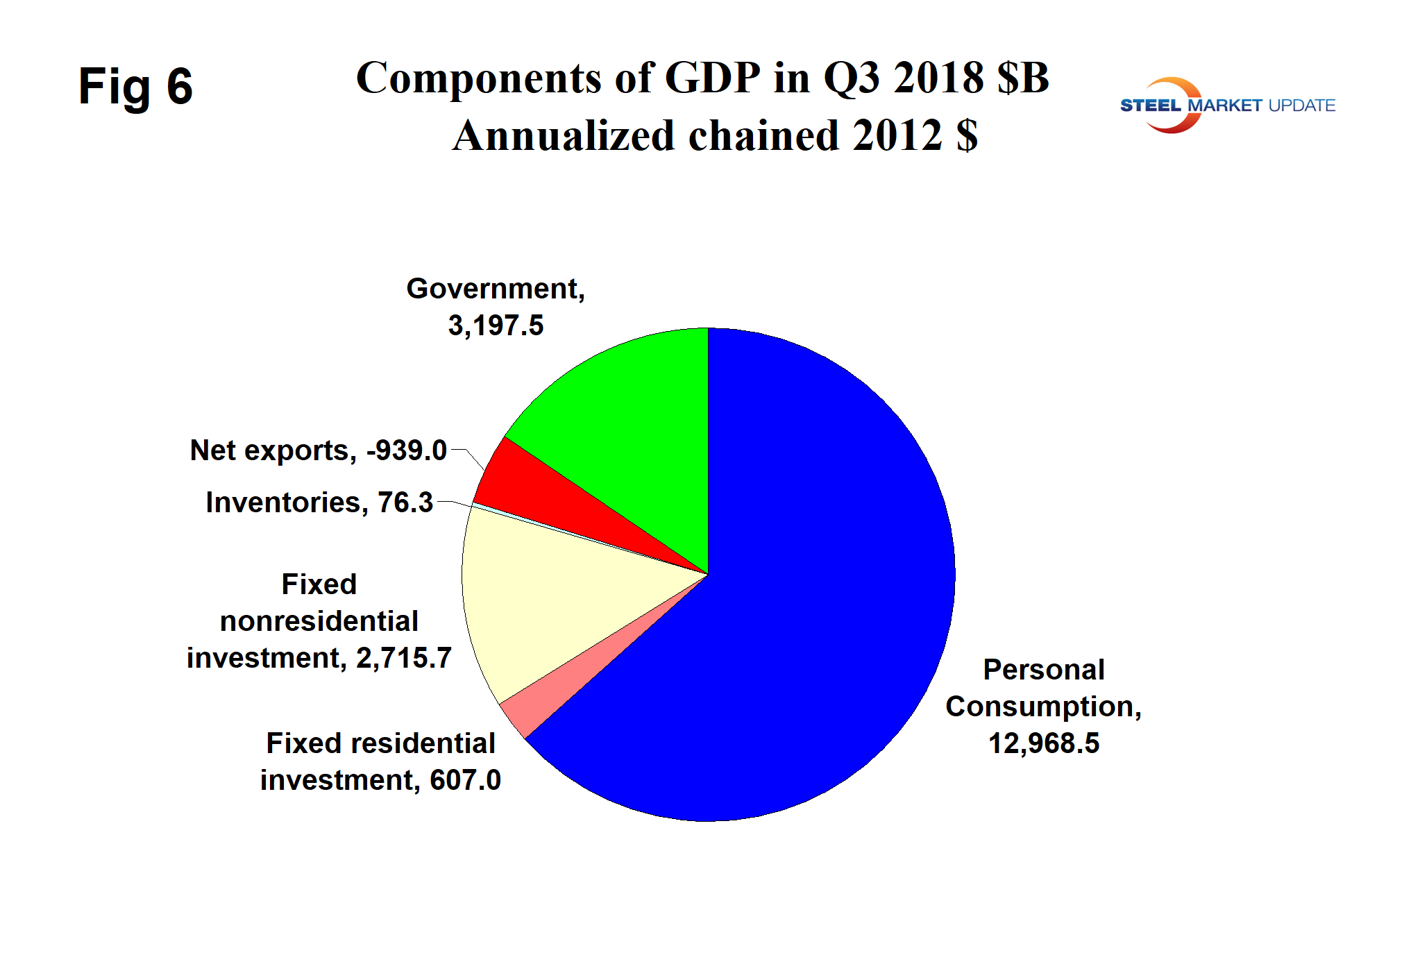
Figure 6 shows the breakdown of the $18.7 trillion economy.
SMU Comment: The results for Q3 met the CBO forecast of a 3.5 percent increase. We are concerned about the composition of growth in Q3 and should expect a decline in growth every quarter from now until Q3 2021 if the CBO forecast is correct. The trailing 12-month growth rate has improved for each of the last nine quarters and in Q3 reached 3.02 percent. This was the first quarter to exceed 3.0 percent since Q2 2015 and is high enough to stimulate a growth in steel consumption, which requires about a 2.2 percent growth to break even.
Definition of GDP: Gross domestic product (GDP) is the value of the goods and services produced by the nation’s economy less the value of the goods and services used up in production.
GDP is defined as Consumption (C) plus Investment (I) plus Government Spending (G) plus [Exports (E) minus Imports (I)] or: GDP = C + I + G + (E-I)
National savings is GDP minus (consumption plus government spending). That means that investment equals savings plus net exports. If there are no net exports, then money must come back into the U.S. from outside the country to finance investments, along with savings.
Thus, if there is a government deficit, there must be savings by both consumers and businesses, plus capital flows from outside the country, to offset that deficit in order for there to be any money left over for investments.
Another definition of GDP states that it equals the growth in working population multiplied by their productivity.


