Prices

October 25, 2018
Ferrous Futures: HRC Curve Flattens; Ore & Turkish Scrap Rally in October
Written by David Feldstein
The following article on the hot rolled coil (HRC) futures market was written by David Feldstein. As the Flack Global Metals Chief Market Risk Officer, Dave is an active participant in the hot rolled futures market, and we believe he provides insightful commentary and trading ideas to our readers. Besides writing futures articles for Steel Market Update, Dave produces articles that our readers may find interesting under the heading “The Feldstein” on the Flack Global Metals website, www.FlackGlobalMetals.com. Note that Steel Market Update does not take any positions on HRC or scrap trading, and any recommendations made by David Feldstein are his opinions and not those of SMU. We recommend that anyone interested in trading steel futures enlist the help of a licensed broker or bank.
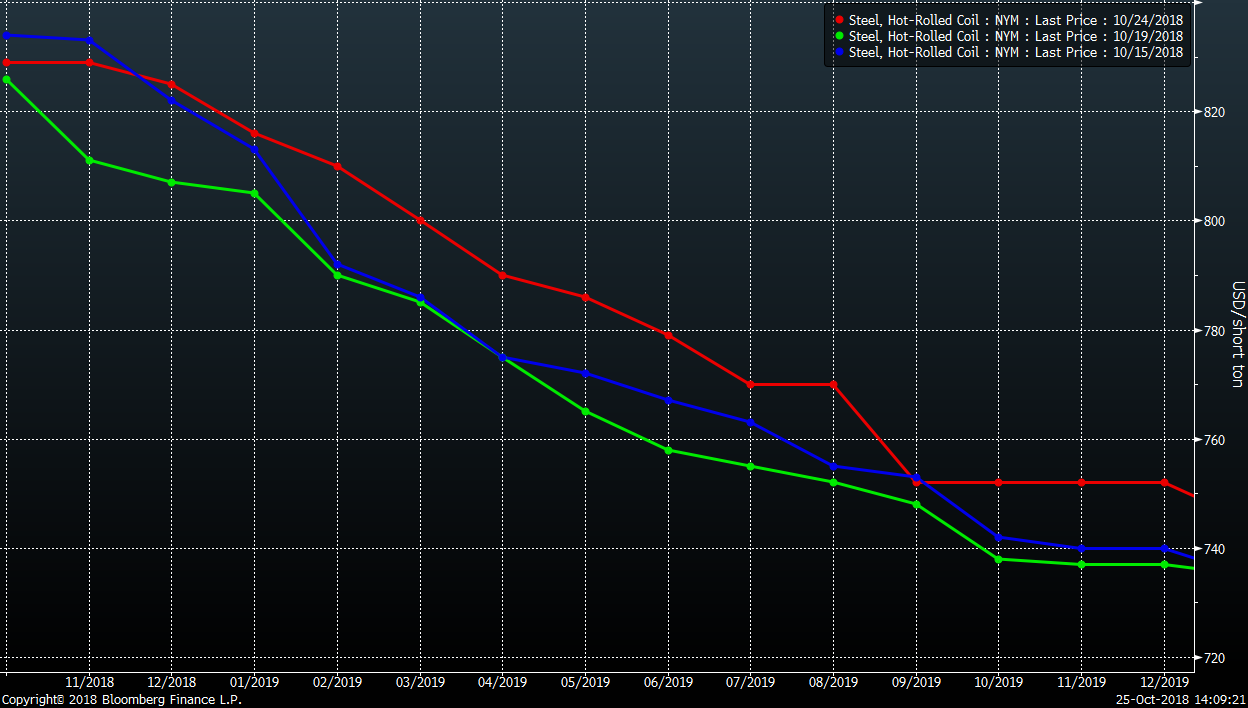
The chart below shows the CME Midwest HRC futures curve last Monday (10/15) in blue, last Friday in green and last night’s settlements in red. The front of the curve sold off following last week’s larger-than-expected drop in the CRU HRC Index, but has rallied back this week. The first eight months of 2019 had little reaction to last week’s print, but has rallied roughly $20 since then.
CME Midwest HRC Futures Curve
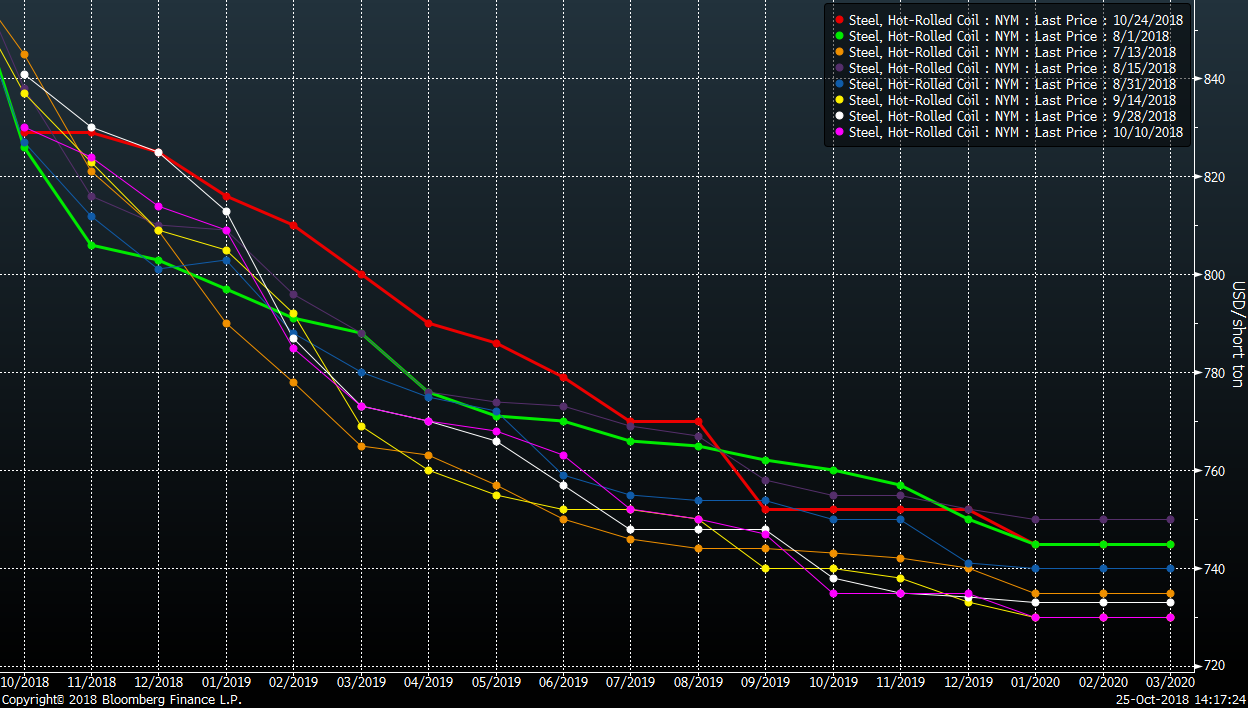
This busy chart shows the HRC curve every two weeks starting in mid-July showing that the curve has maintained its shape while trading in a tight $30 to $40 price range.
CME Midwest HRC Futures Curve
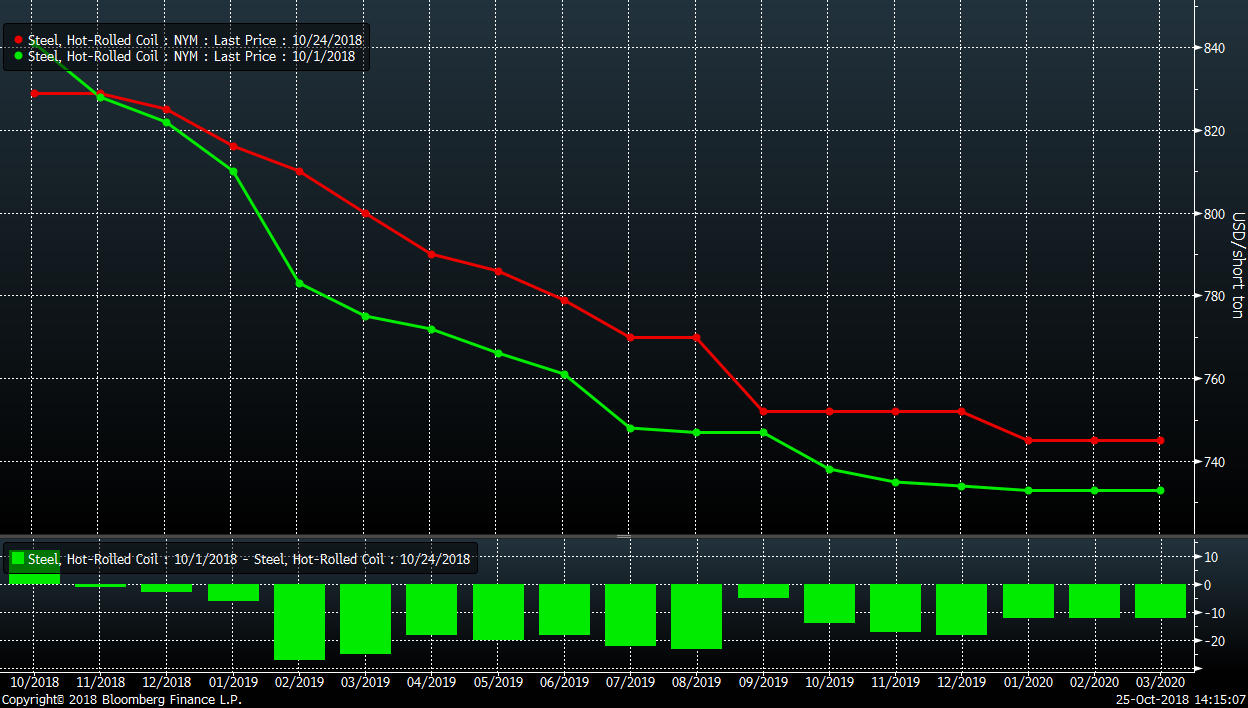
This chart shows the HRC curve on Oct. 1 vs. Oct. 24, and the histogram at the bottom shows how the backwardation in the curve has compressed. In other words, the difference between the front end of the curve, November 2018 – February 2019, has decreased from $45 to $19.
CME Midwest HRC Futures Curve
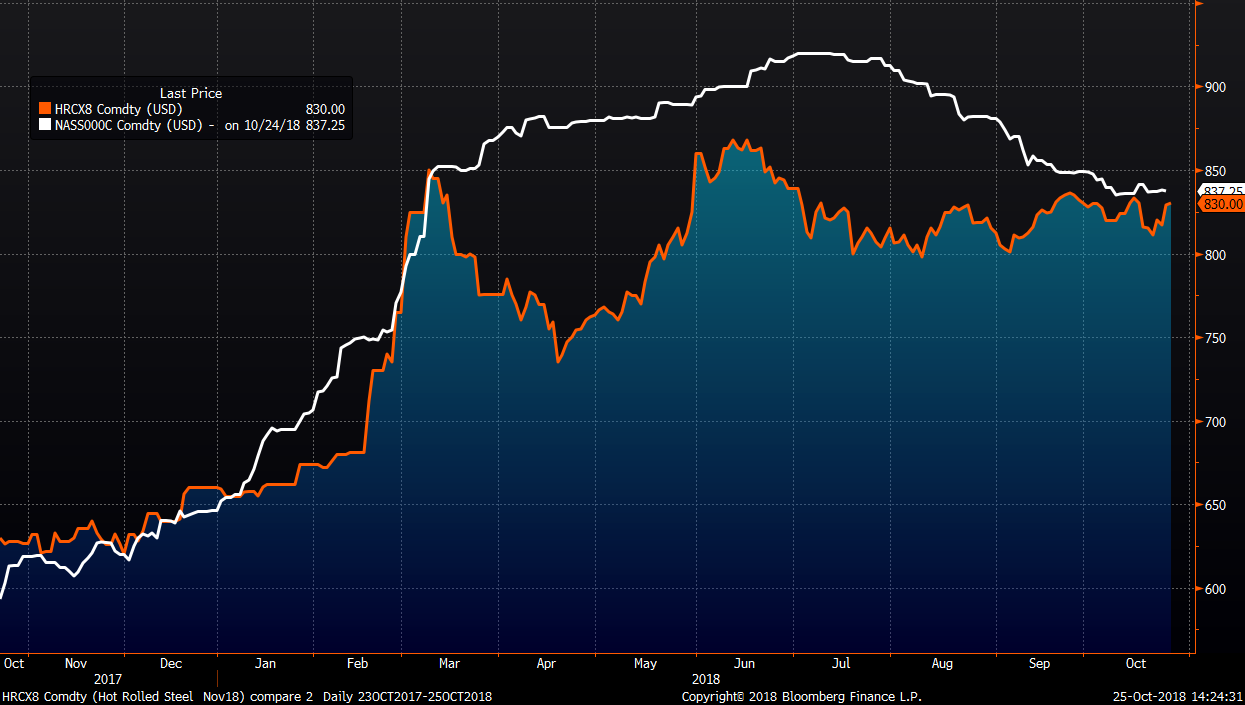
The November CME HRC future has traded higher approaching the Platts TSI HRC Index i.e. spot. November has remained above $800 since June as the market has remained strong much longer than expected, as evidenced by the backwardated curve.
November CME Midwest HRC Future (orange) & Platts TSI Midwest HRC Index (white)
So, what are the trade opportunities in HRC futures for importers, mills, OEMs and service centers? The best trade continues to be in the favor of OEMs to buy the backwardation, although clearly this opportunity has dissipated.
The metal spread, i.e. buying scrap or iron ore and selling HRC, has decreased, but continues to be a very profitable trade for domestic mills at $420/st in November and December and $400/st in Q1 2019.
As far as service centers and importers go, hedging downside inventory or carry trade (import) price risk continues to be an uphill battle and not attractive due to the curve’s backwardation. However, this trade has improved with the move higher in Q1 and Q2 over the past week.
Scrap futures continue to move higher with the November Turkish scrap future closing at $334.50/t today, up 7.6 percent so far in October.
November Busheling (orange) & Turkish Scrap Futures

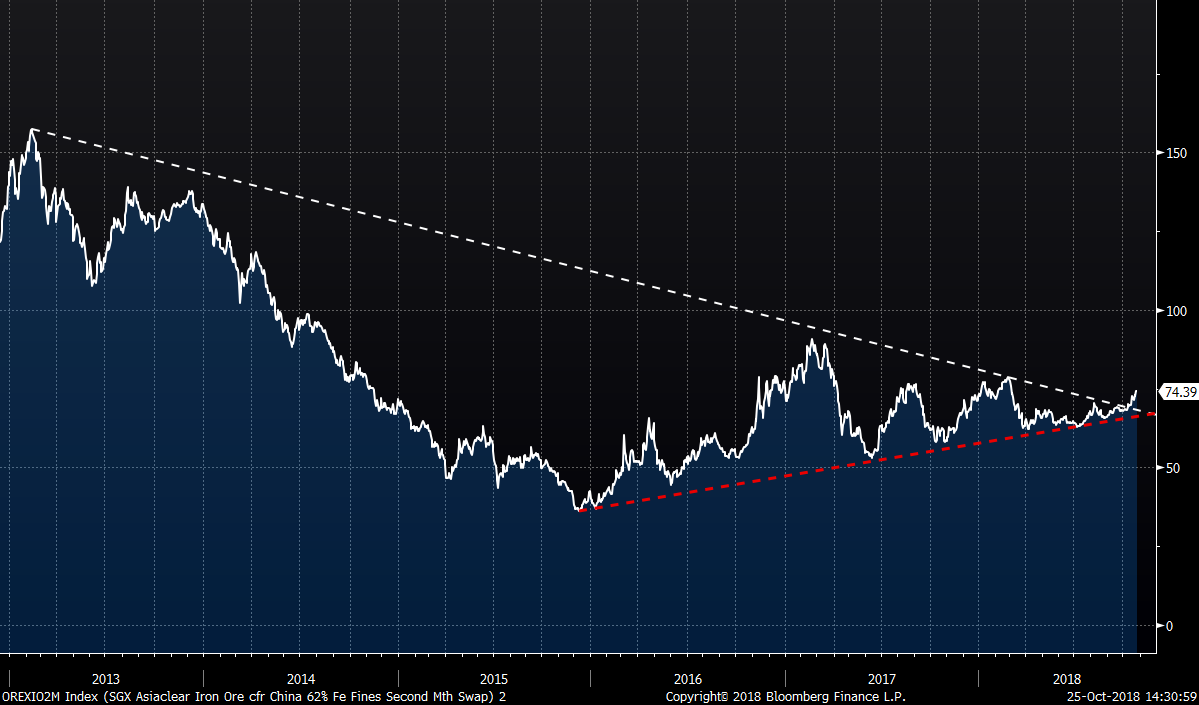
The 2nd month ore future has broken out of its seven-month range, broken above a five-year down trend line and rallied 18.3 percent since July 6.
2nd Month Iron Ore Future
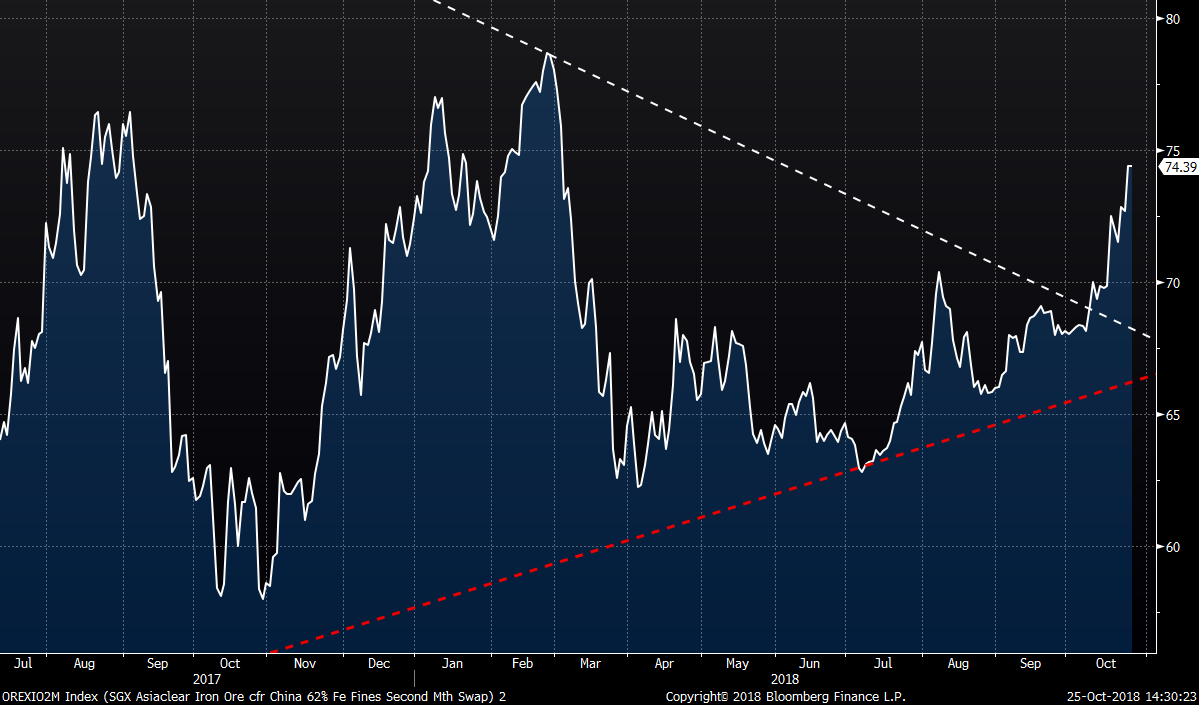
2nd Month Iron Ore Future