Market Data

October 22, 2018
SMU Currency Analysis: Dollar Shows Some Weakness
Written by Peter Wright
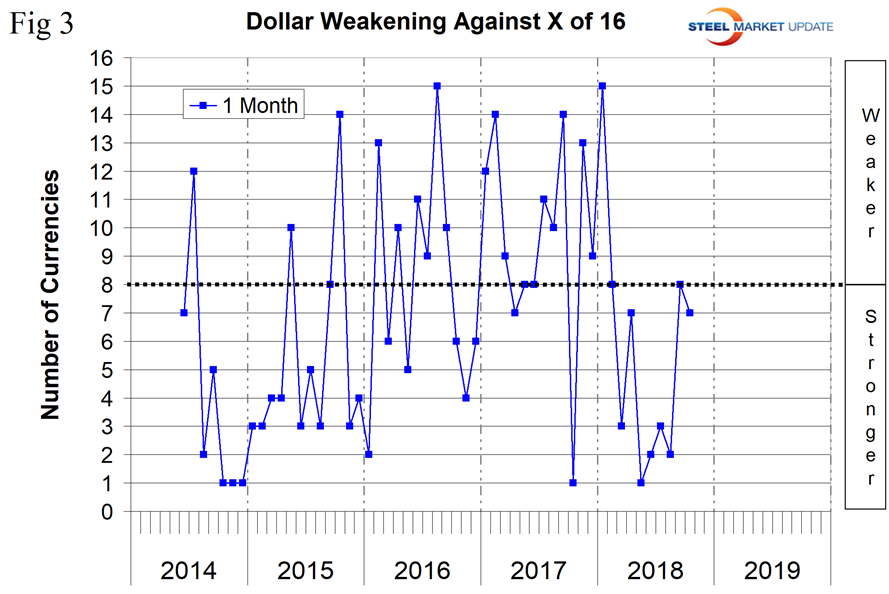
In the last month, the U.S. dollar has weakened against seven of the 16 currencies that Steel Market Update tracks. This was close to the performance we reported last month, but a dramatic change from the period May through August when only a few of the 16 appreciated against the dollar (just one in May, two in June, three in July and two in August.) Please see the end of this report for an explanation of data sources.
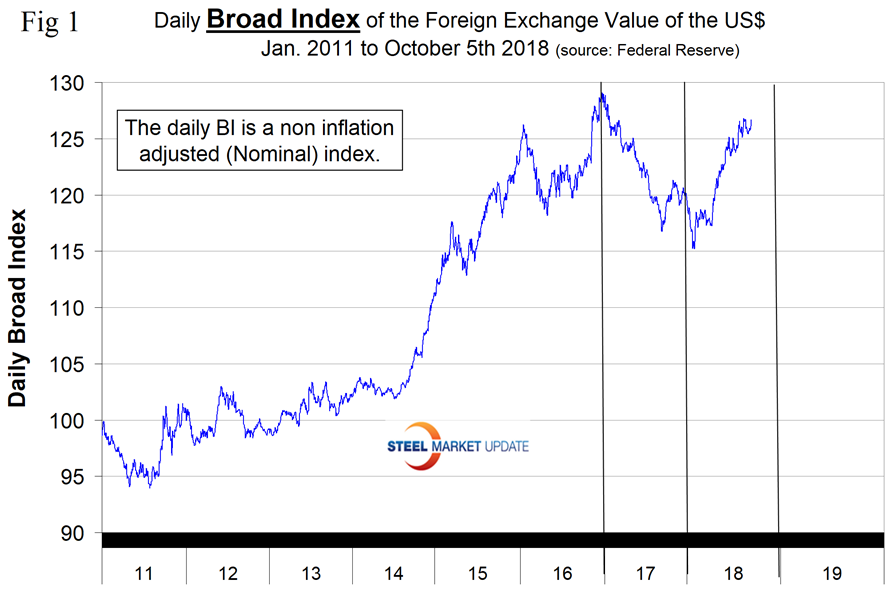
The Broad Index value of the U.S. dollar is reported several days in arrears by the Federal Reserve; the latest value published was for Oct. 5. Figure 1 shows the index value since January 2011. The dollar had a recent peak of 128.96 on Jan. 3, 2017, which was the highest value in almost 15 years; the recent low point was Feb. 1, 2018, at 115.21. On Oct. 7, the dollar had recovered to 126.57.
On Sept. 26, the Fed enacted its eighth rate hike of this cycle, which was universally expected and therefore priced into the dollar value at that time. Ever since the FOMC’s previous meeting in early August, federal-funds futures had implied odds of another hike at 91 percent to 100 percent at the September meeting. Figure 2 describes the 10-year treasury yield through Oct. 12. On Oct. 10, the 10-year rate was 3.22 percent, which was the highest since May 13, 2011.
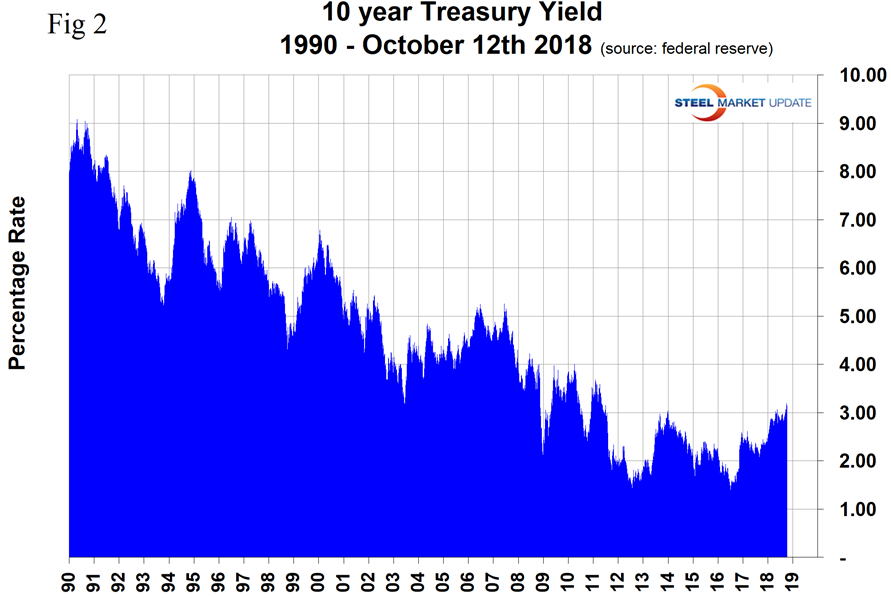
On Sept. 27, analyst John Mason Right wrote: “On schedule, the Federal Reserve raised its policy rate of interest at its September meeting of the Open Market Committee. The policy range now is at 2.00 percent to 2.25 percent. The effective Federal Funds rate has been right around 1.91 percent since the last move of the policy range. Fed officials indicated that, if conditions are right, there will be one more rate hike this year, three more next year, and one more coming in 2020. So far, with all the rate increases the Fed has made and a year spent reducing the size of the Fed’s securities portfolio, liquidity seems to be more than adequate in financial markets, and there is little pressure on commercial banks’ reserve positions.”
Each month, SMU publishes an update of Table 1, which shows the value of the U.S. dollar against the currencies of 16 major global steel and iron ore trading nations. The table shows the change in value in one year, three months, one month and seven days through Oct. 14. Currencies that weakened against the U.S. dollar are color coded in red. Green indicates currencies that strengthened against the U.S. dollar. There is clearly a progression of the dollar weakening moving to shorter time frames. In the last seven days, the dollar weakened against 12 of the 16. This is not apparent from the broad index shown in Figure 1 because this data is only through Oct. 5.
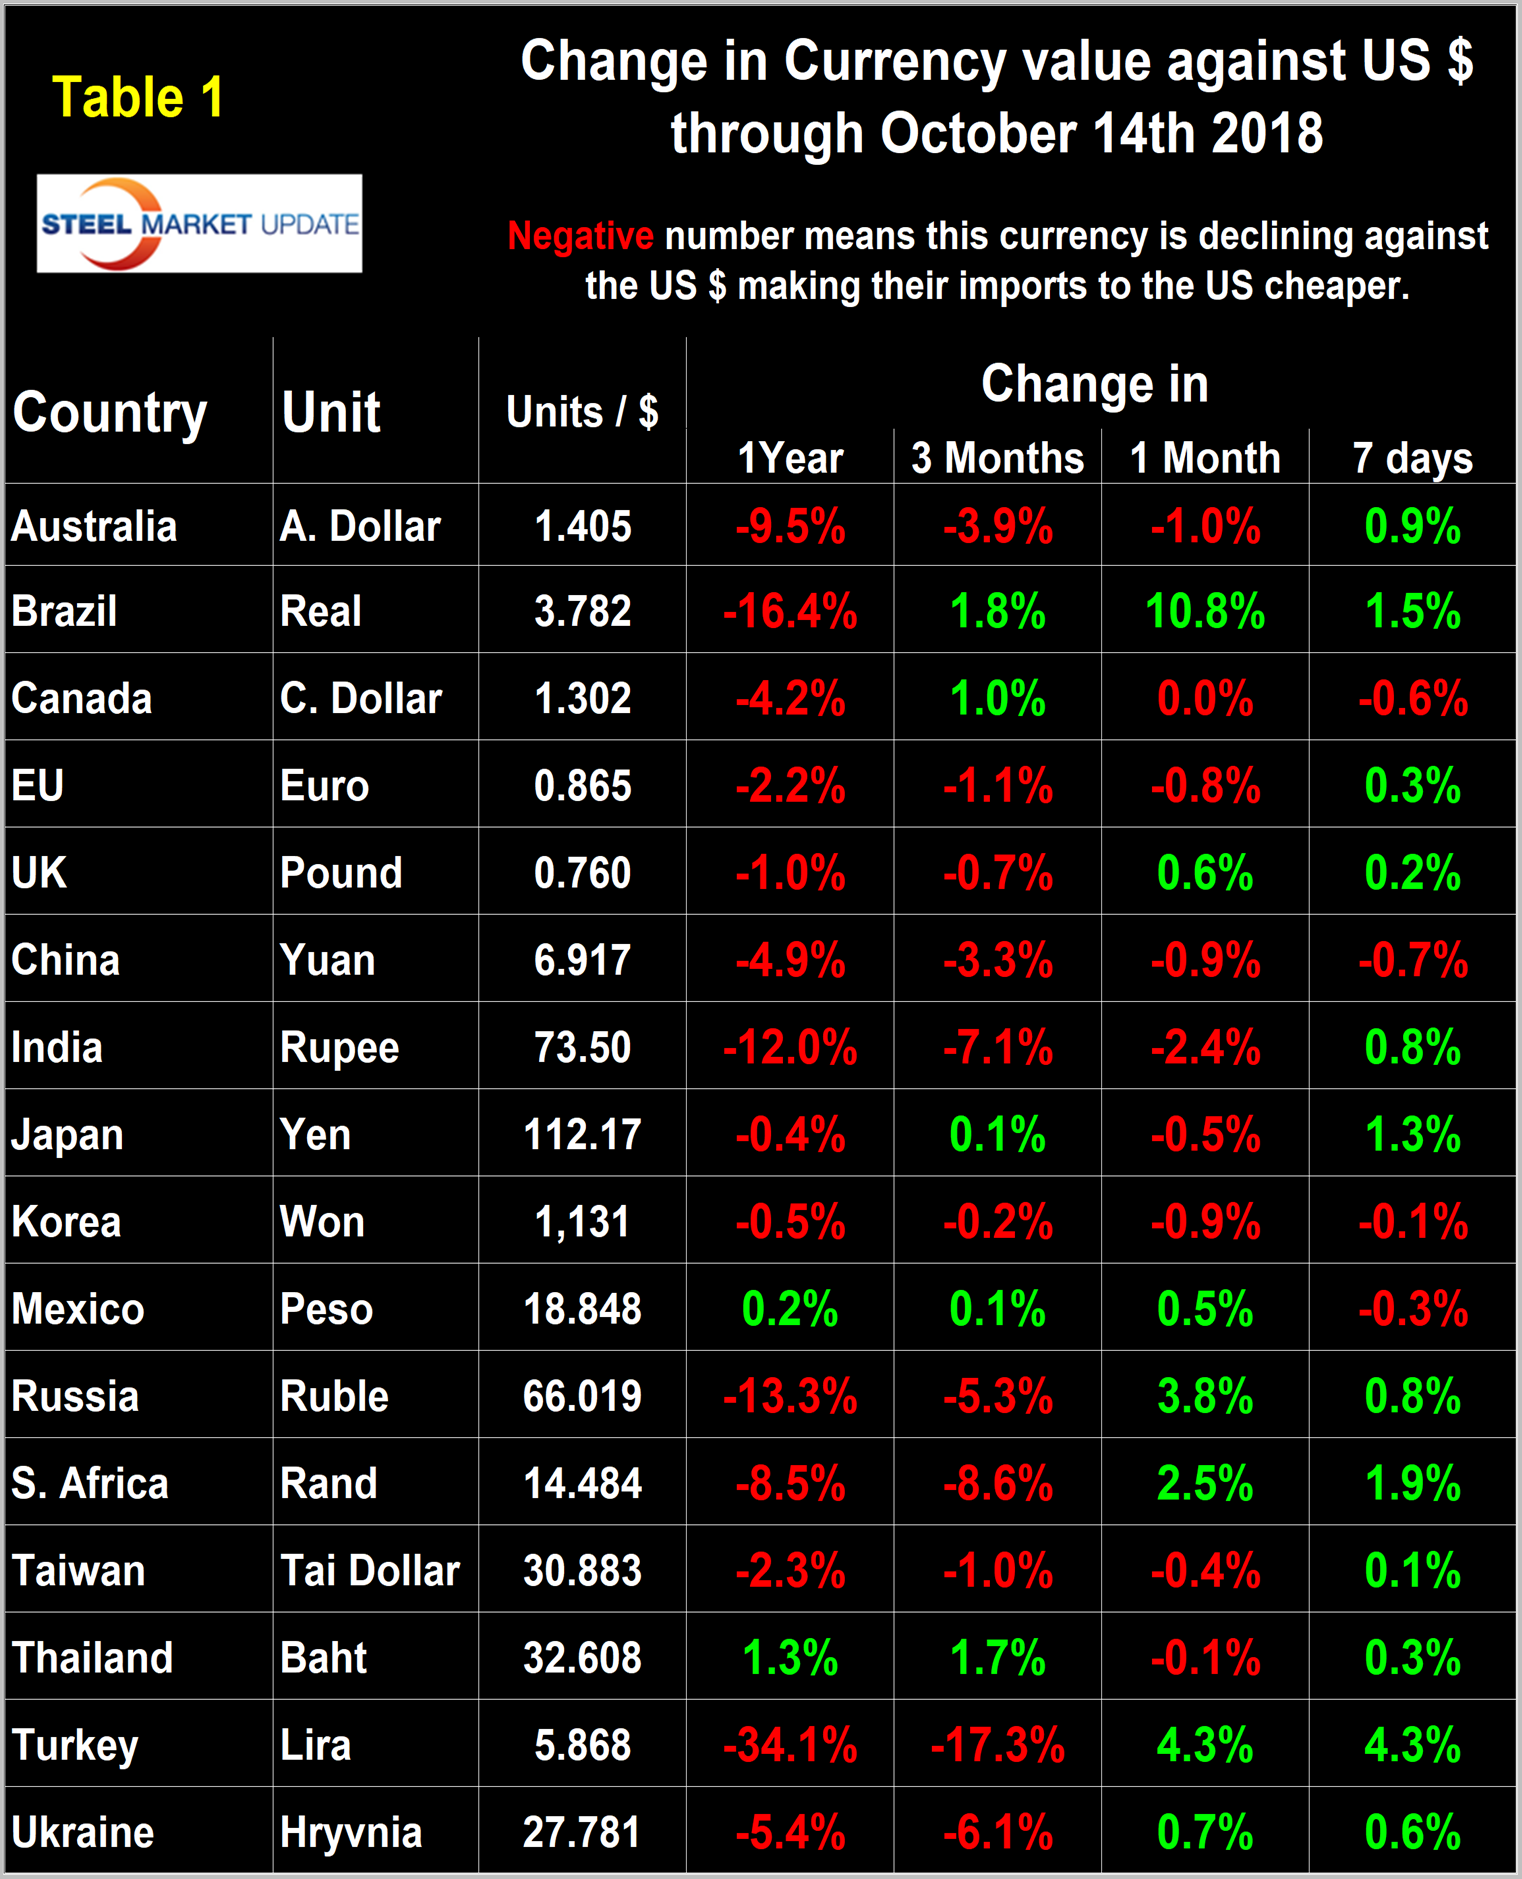
Figure 3 gives a longer-range perspective and shows the extreme gyrations that have occurred in the last three years at the one-month level. Through Oct.14, the dollar weakened against seven of the 16 in the previous month and strengthened against the other nine.
A falling dollar puts upward pressure on commodity prices that are greenback denominated. We regard strengthening of the U.S. dollar as negative and weakening as positive because of the effect on the trade balance of all commodities and on the total national trade deficit.
In each of these reports, we comment on several of the 16 steel and iron ore trading currencies listed in Table 1 and over a period of several months will describe the history of them all. Charts for each of the 16 currencies are available through Oct. 14 for any premium subscriber who requests them.
The Australian Dollar
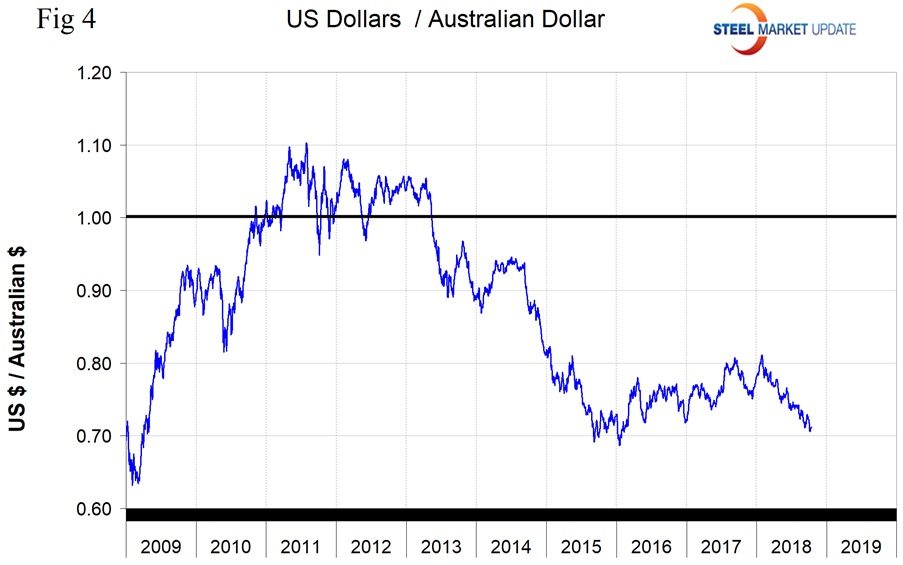
Australia’s dollar has declined by 3.9 percent in the last three months and by 1.0 percent in the last month (Figure 4). It now has a value of 1.405 per U.S. dollar. From Invesco, Oct. 4: “The Reserve Bank of Australia has said it will be very patient with interest rates, but recently stated its next move will likely be higher. It has been neutral for some time, so announcing that its next policy move will likely be for higher rates is somewhat hawkish, in our view. That being said, it is unlikely the bank will move anytime soon. We do not believe the trade war is over, and any new escalation could pressure the Australian dollar down again.”
The Brazilian Real
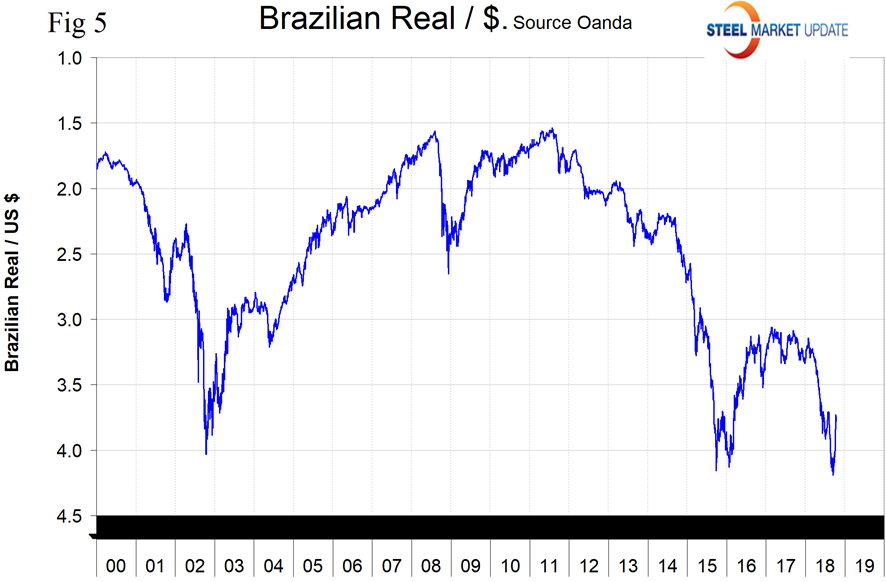
Brazil’s real in the last month has experienced the greatest move against the dollar of all the 16 by strengthening by 10.8 percent (Figure 5). On Oct. 14, the real had a value of 3.78 per U.S. dollar. This is likely a short term political aberration. On Sept. 19, commodities analyst Andrew Hecht wrote: “Aside from internal political and economic pressures, economic weakness in Argentina has caused additional problems for the Brazilian economy as global investors stay away from emerging market debt.”
The EU’s Euro
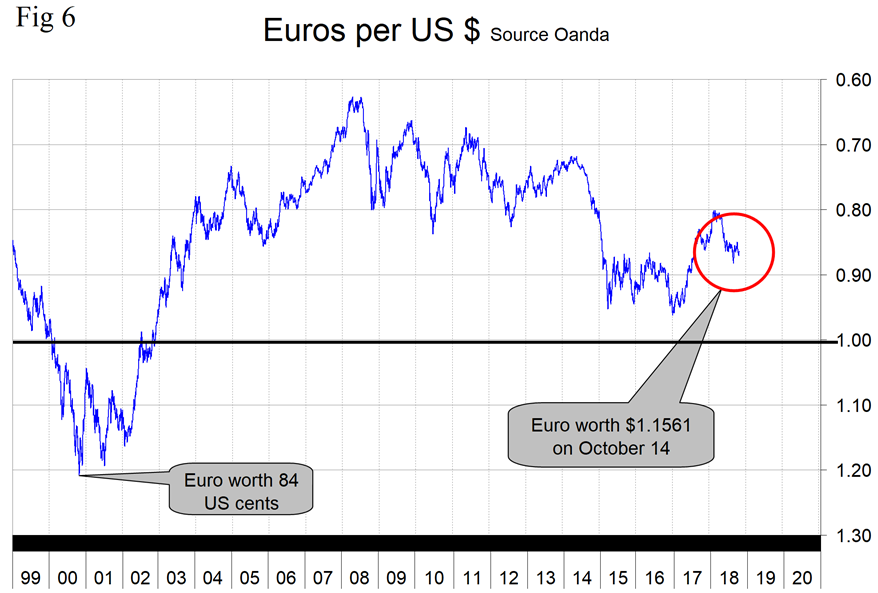
Europe’s euro has declined by 1.1 percent against the dollar in three months and by 0.8 percent in one month (Figure 6). On Oct.14, the Euro was worth 1.1561 U.S. dollars. On Sept. 30, currency analyst Dean Popplewell wrote: “The euro continues to leak lower as Italy’s government has shattered the budget and challenged the EU’s mandate. The less-than-vigorous Eurozone September Core CPI came in lower than expected at 0.9 percent YoY (1.1 percent estimated, 1.0 percent prior), which sprung the 1.1600 trapdoor, triggering a wave of stop losses as that fundamental and psychological level ceded. The ECB will be in no mood to signal a quicker pace of interest normalization anytime soon, as the Fed lays their cards on the table, guiding the markets to a December rate hike. This suggests the dollar will remain in favor as U.S. growth and positive USD differentials stay supportive.”
Analyst John Rubino wrote on Sept. 30: “The only reason Italy’s bonds aren’t already rated junk is because the rating agencies assume the ECB will step in to prevent a default. In that sense, Italian bonds are actually German bonds. But let the ECB abandon Italy to market forces, and the latter’s bond rating will find its natural level in short order. But of course, the ECB can’t do that, because a default by a major Eurozone country would throw the whole common currency project into doubt, with consequences that can only be guessed at because nothing similar has ever happened. But the ECB also can’t not do that, because enabling Italy’s runaway spending and borrowing will just open the door for Spain, Greece and Portugal et al. to demand a similar deal, causing the façade of monetary discipline to evaporate and leading to a slightly different flavor of currency crisis, but a crisis nonetheless.”
The Indian Rupee
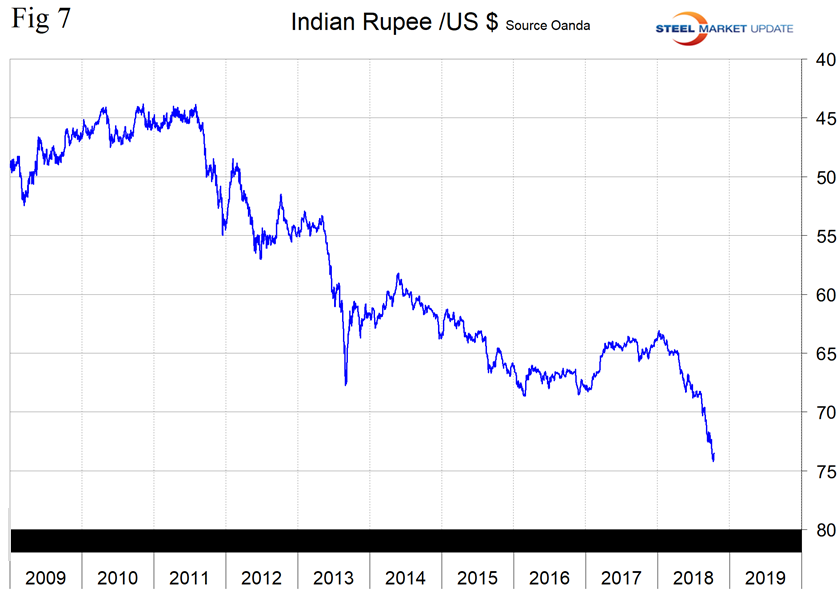
India’s rupee has declined by 7.1 percent in three months and by 2.4 percent in the last month. On Oct. 14, the U.S. dollar was worth 73.5 rupees (Figure 7). From Invesco, Oct. 4: “The rupee has experienced a significant selloff (especially in the last several weeks), depreciating 11.75 percent year to date against the U.S. dollar. We see this as being largely driven by an increase in crude oil prices, foreign portfolio outflows and investor fears of a higher current account deficit. Some policy initiatives have been announced in recent days to stabilize the rupee, and we expect the Reserve Bank of India to initiate more concrete policy intervention measures should there be any further sell-off in the rupee.”
The Korean Won
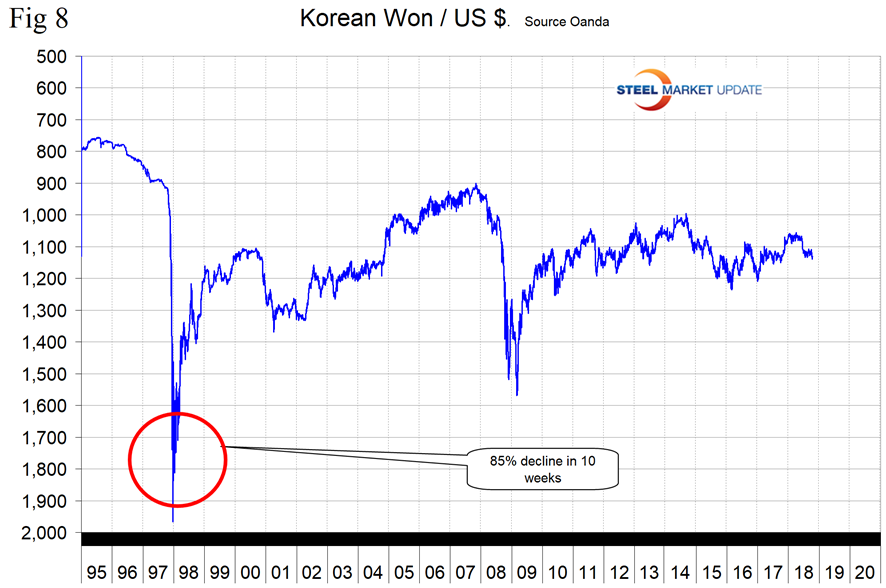
Korea’s won has traded in a plus/minus 10 percent range for the last nine years and doesn’t make much news. Against the dollar, the won has declined by 0.2 percent in the last three months and by 0.9 percent in one month. On Oct. 14, it took 1,131 won to buy one dollar (Figure 8).
Explanation of Data Sources: The broad index is published by the Federal Reserve on both a daily and monthly basis. It is a weighted average of the foreign exchange values of the U.S. dollar against the currencies of a large group of major U.S. trading partners. The index weights, which change over time, are derived from U.S. export shares and from U.S. and foreign import shares. The data are noon buying rates in New York for cable transfers payable in the listed currencies. At SMU, we use the historical exchange rates published in the Oanda Forex trading platform to track the currency value of the U.S. dollar against that of 16 steel and iron ore trading nations. Oanda operates within the guidelines of six major regulatory authorities around the world and provides access to over 70 currency pairs. Approximately $4 trillion U.S. dollars are traded every day on foreign exchange markets.


