Prices

October 12, 2018
SMU Imports Report: Coated Sheet Shipments Down
Written by Peter Wright
Imports of other metallic coated sheet have declined in all regions in 2018.
Each month, Steel Market Update produces an import analysis by region for two of the six flat rolled product groups (HRC, CRC, HDG, OMC, CTL plate and coiled plate). This month, the focus is on coated products. The intent of these regional updates is to bridge the gap between our monthly license data summaries and the detailed monthly reports we produce for premium subscribers reporting import volume by port and source.
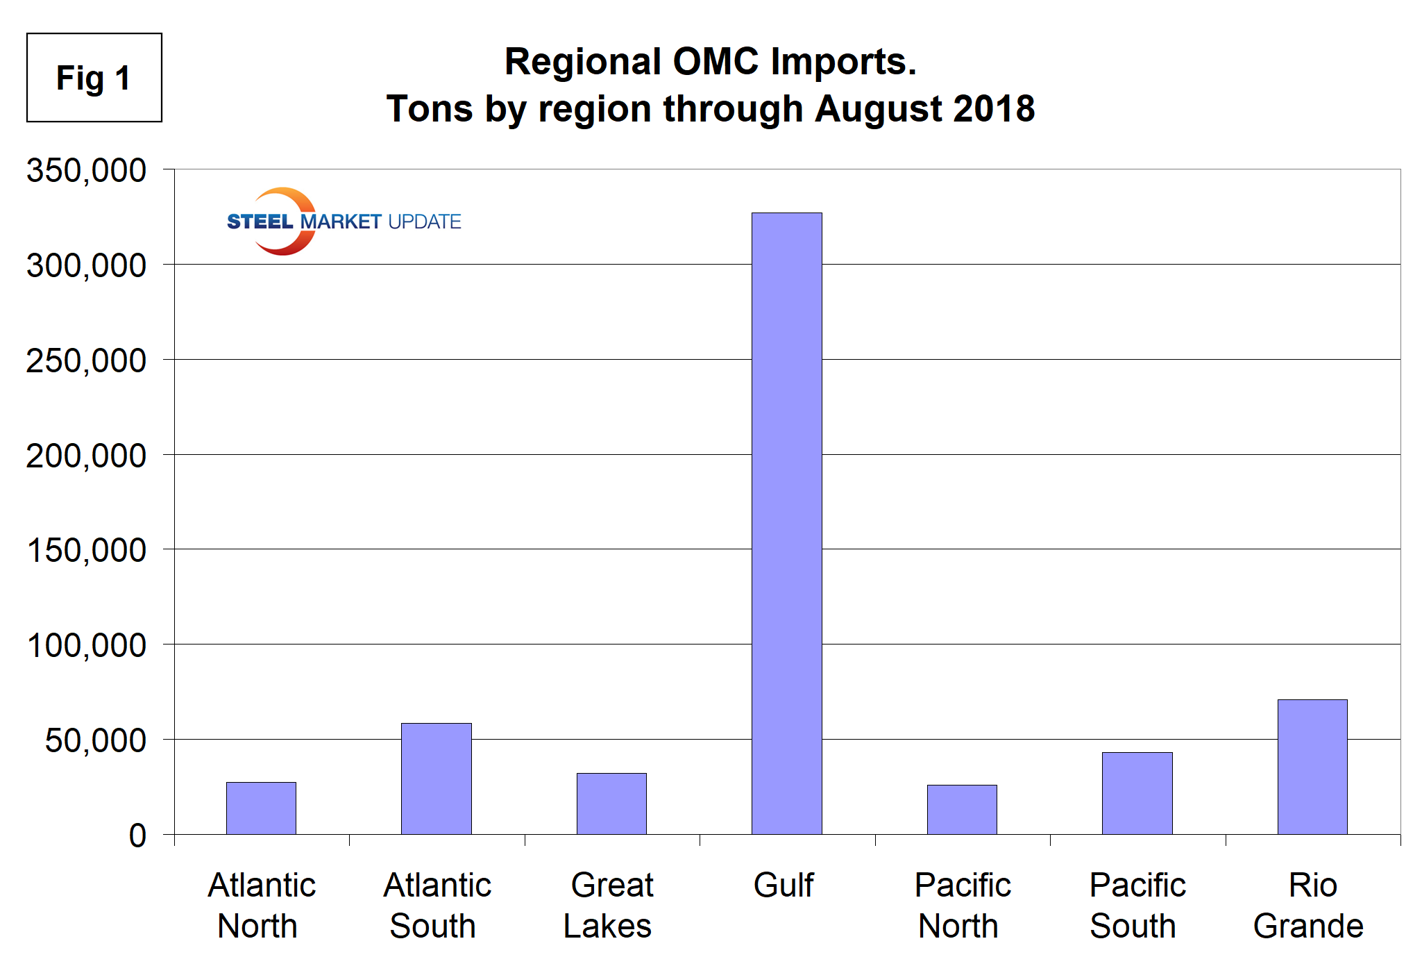
![]() In 2018 through August, the region receiving the most OMC sheet was the Gulf with 56 percent of the total, followed at a distant second by the Rio Grande with 12 percent (Figure 1).
In 2018 through August, the region receiving the most OMC sheet was the Gulf with 56 percent of the total, followed at a distant second by the Rio Grande with 12 percent (Figure 1).
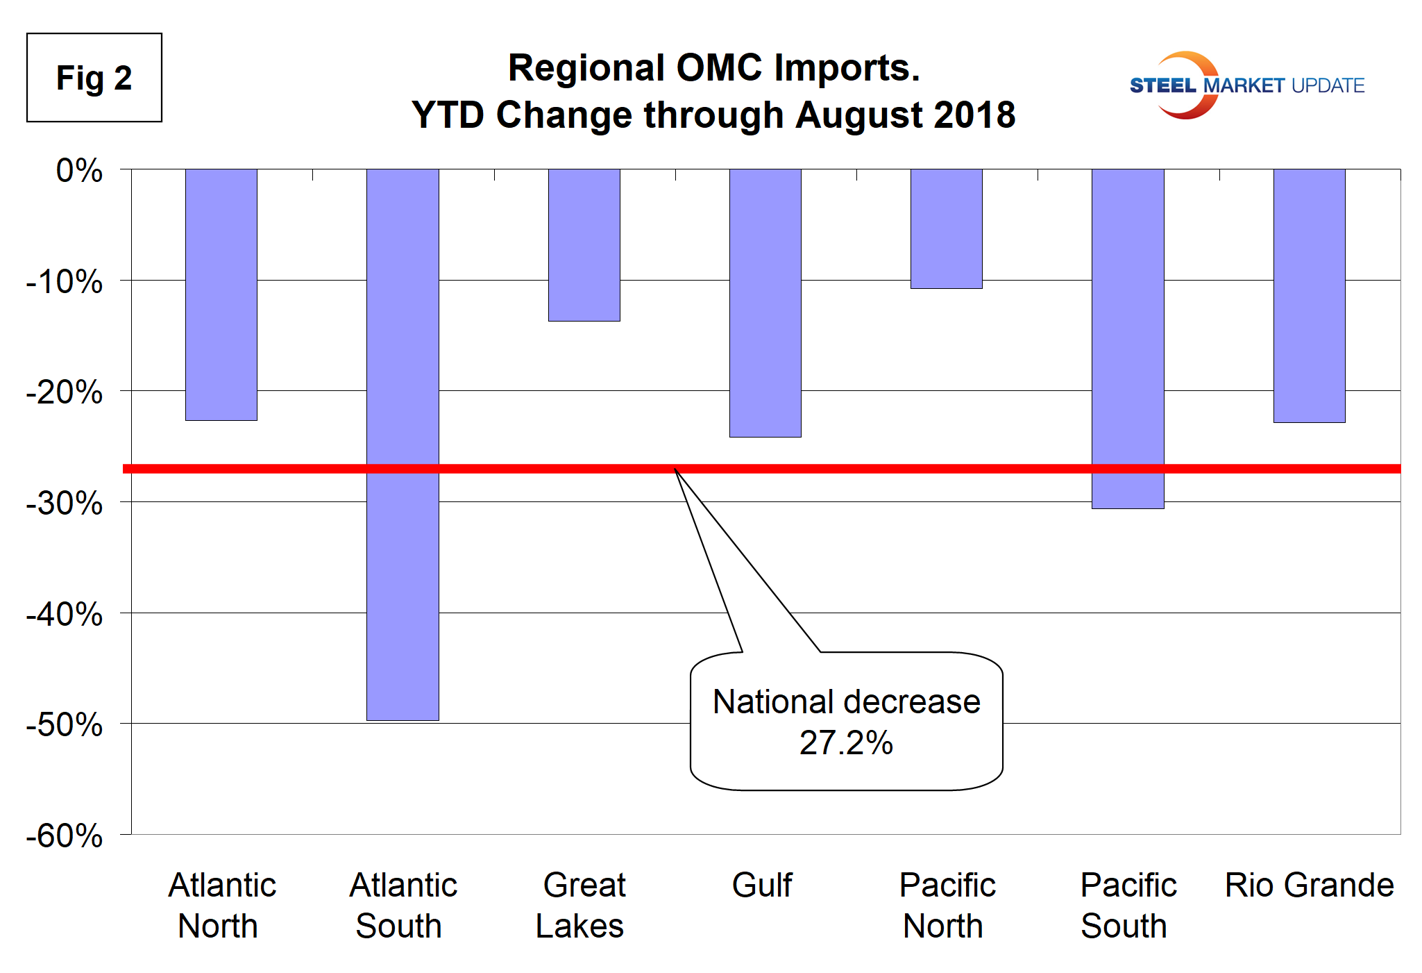
OMC imports into the U.S. as a whole were down by 27 percent year to date compared to 2017. Every region saw a decrease, led by the Atlantic South, down almost 50 percent. Figure 2 shows the percent change by region in 2018 compared to 2017.
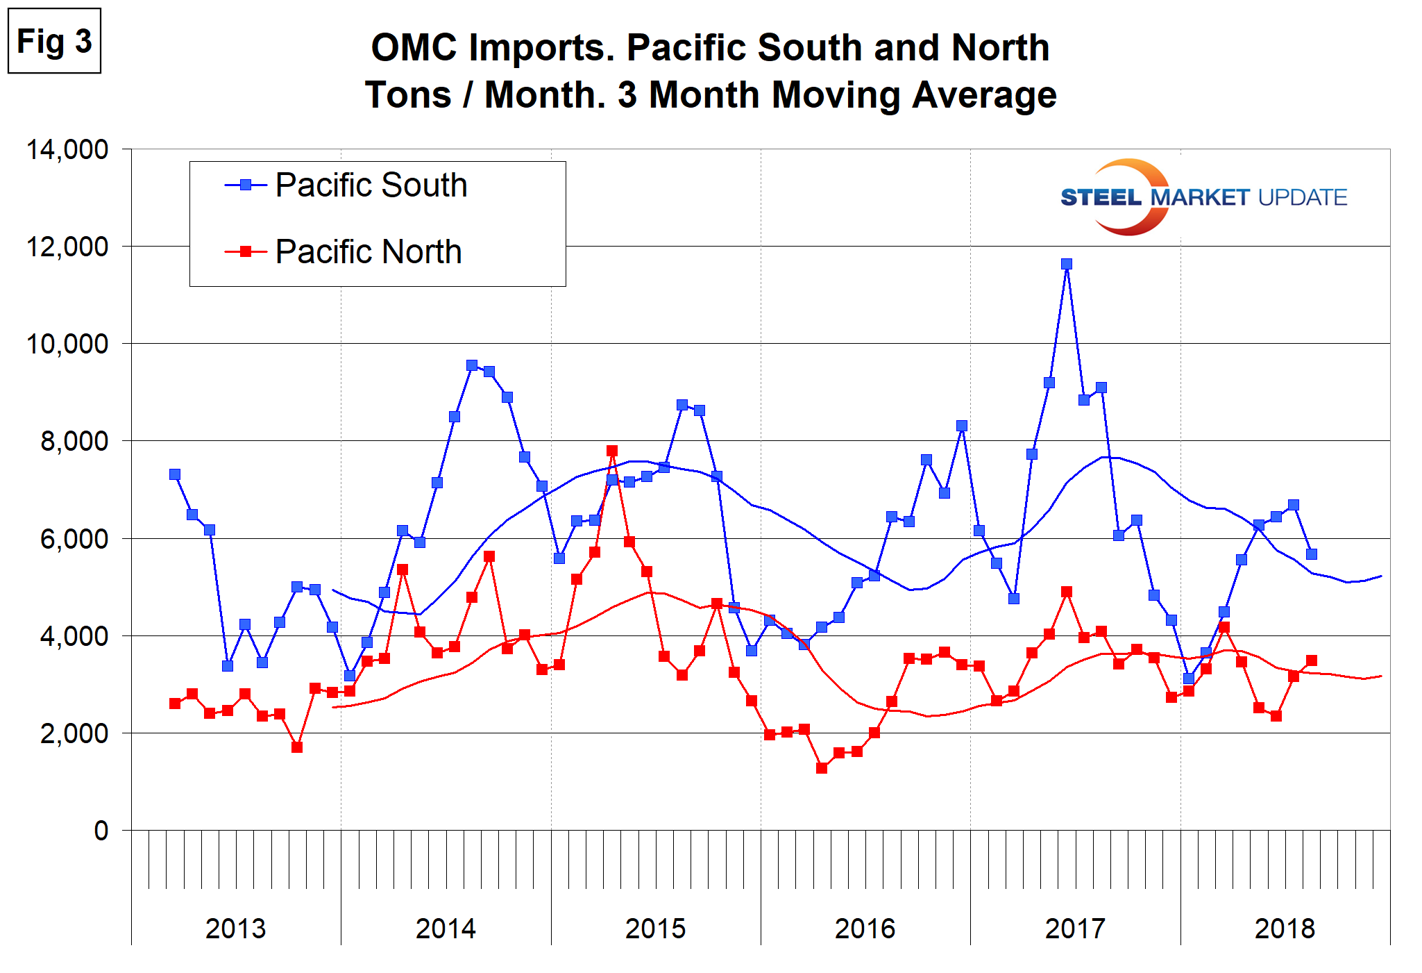
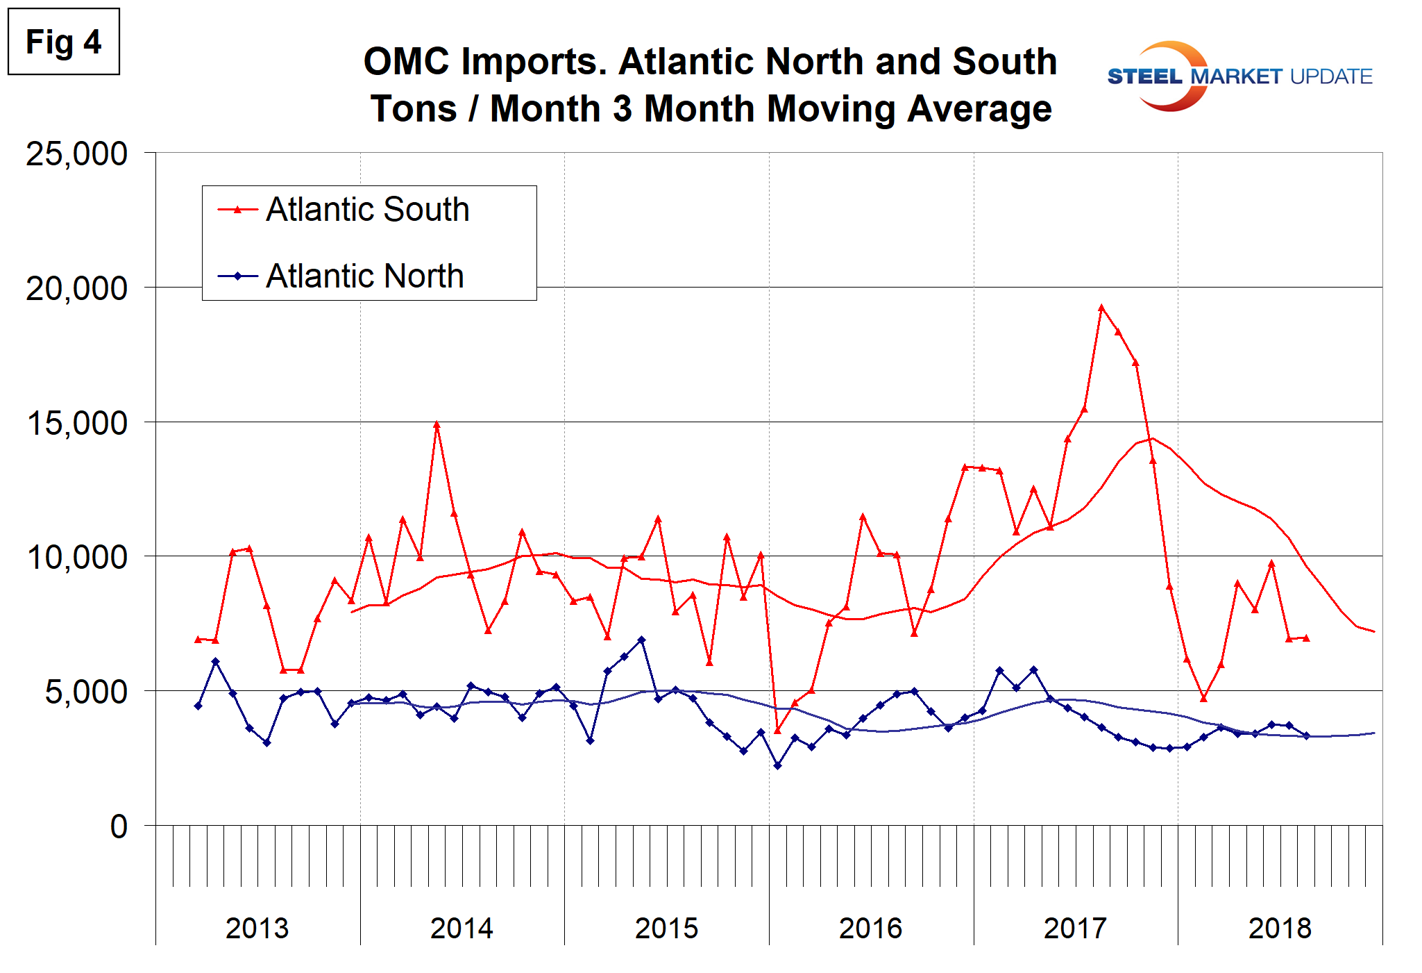
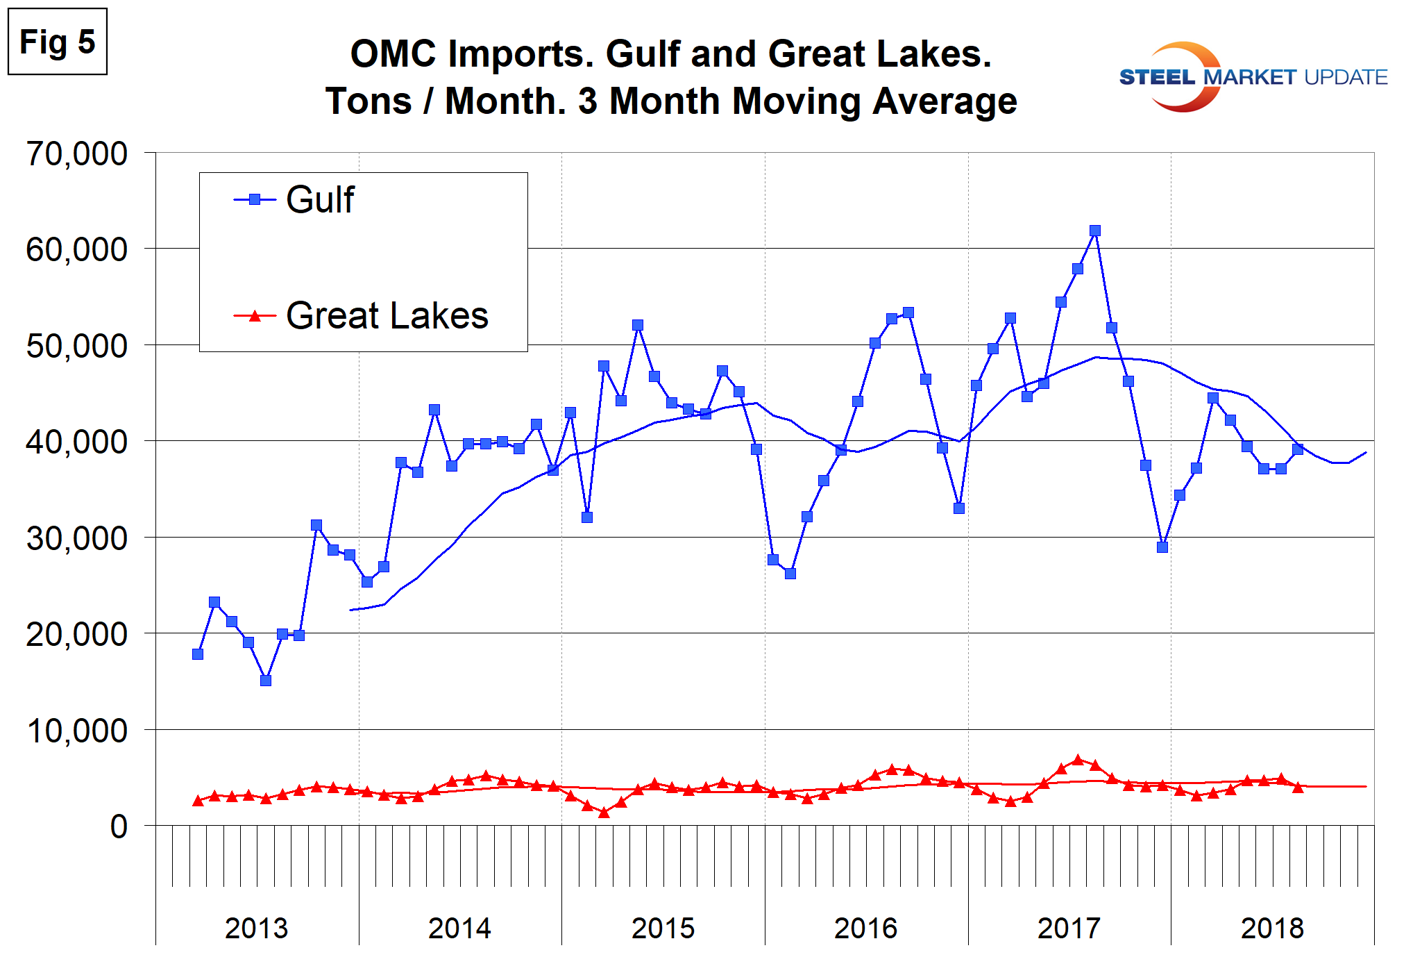
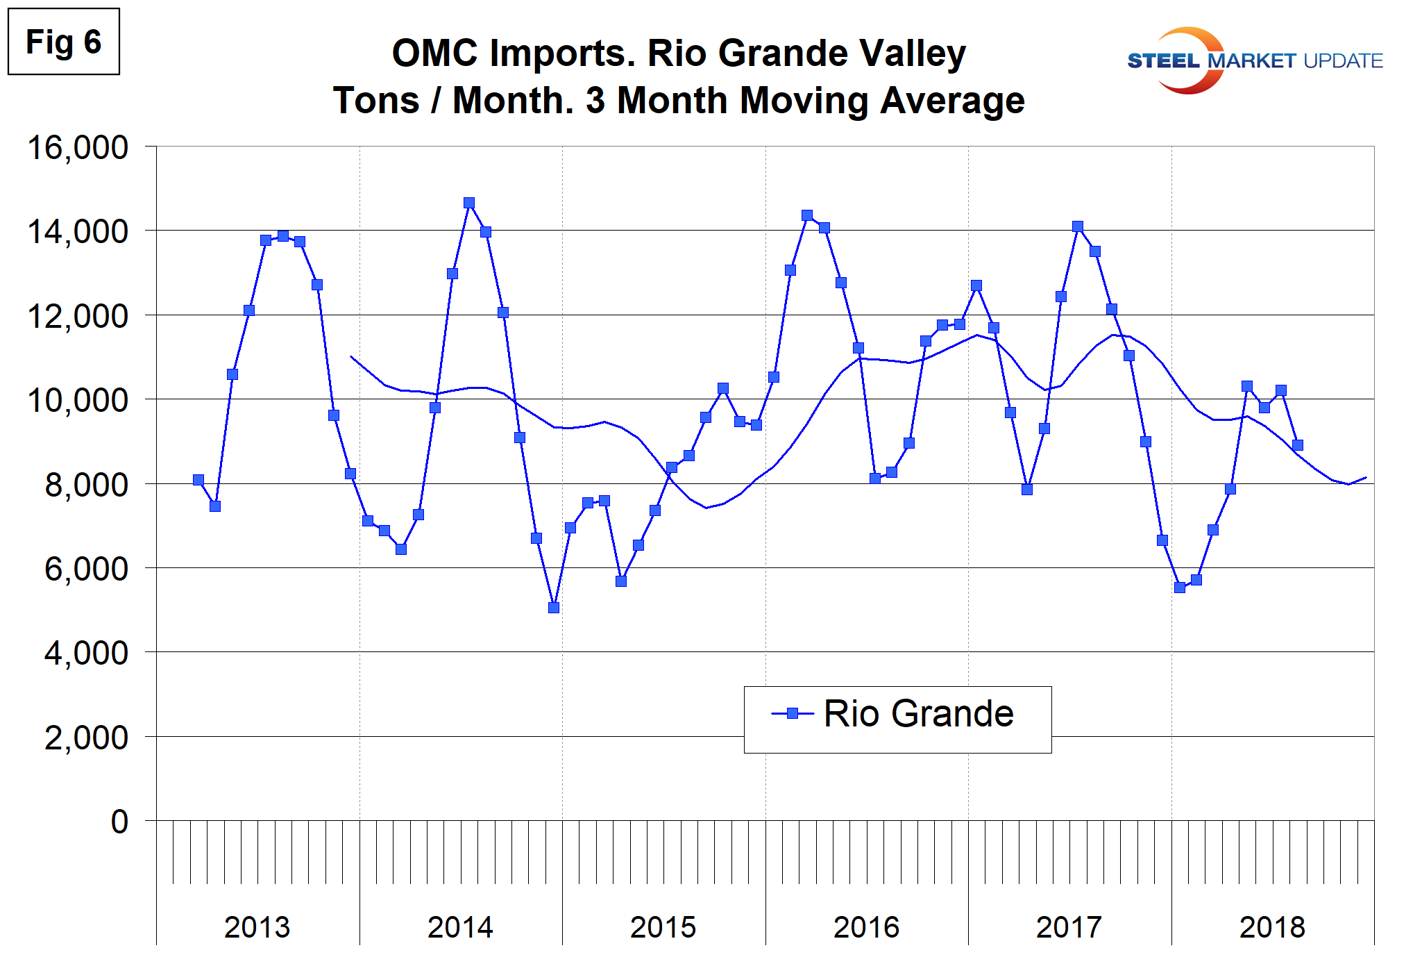
Figures 3, 4, 5 and 6 show the history of OMC imports by region since March 2013 on a three-month moving average basis. Please note the scales of the Y axes in these graphs are very different.
Imports through the Pacific South ports have been very erratic with a peak in June last year and a trough in January this year. Volume increased every month this year until August. Volumes into the Pacific North Ports have been more consistent and lower than in the South.
OMC sheet imports into the North Atlantic ports have declined from the peak that occurred in August last year as the South Atlantic has experienced a lower and more consistent volume throughout the time frame of this study.
Imports into the Gulf have been the highest of all regions every month since this study began in January 2013. In August, Vietnam, Korea and Taiwan were the primary sources into both Houston and New Orleans. Compared with 2017, volume year to date into Houston was down by 33 percent, while New Orleans was down by 37 percent. Imports into the Great Lakes have been much lower and more consistent than into the Gulf.
Tonnage out of Mexico, mostly through Laredo, has been erratic since at least 2013. Volume increased in March, April and May this year before declining in August.
Premium subscribers have access to detailed reports by district and source nation on the SMU website. These reports show, for example, that the port of Savannah has experienced a 51 percent decline in OMC sheet this year and that most of the tonnage into that port is coming from Taiwan and Vietnam.
Sources: Information in this report has been compiled from tariff and trade data from the U.S. Department of Commerce and the U.S. International Trade Commission.


