Market Data

October 12, 2018
IMF Global Economic Outlook & Forecast
Written by Peter Wright
The International Monetary Fund, which updates its World Economic Outlook each April and October, has made a downward revision to its forecast for global GDP growth in 2018 and 2019.
![]() On Oct. 9, the IMF published the following: “The latest World Economic Outlook report projects that global growth will remain steady over 2018–19 at last year’s rate of 3.7 percent. This growth exceeds that achieved in any of the years between 2012 and 2016. It occurs as many economies have reached or are nearing full employment and as earlier deflationary fears have dissipated. Thus, policymakers still have an excellent opportunity to build resilience and implement growth-enhancing reforms. Last April, the world economy’s broad-based momentum led us to project a 3.9 percent growth rate for both this year and next. Considering developments since then, however, that number appears over-optimistic: rather than rising, growth has plateaued at 3.7 percent. And there are clouds on the horizon. Growth has proven to be less balanced than hoped. Not only have some downside risks that the last WEO identified been realized, the likelihood of further negative shocks to our growth forecast has risen. In several key economies, moreover, growth is being supported by policies that seem unsustainable over the long term. These concerns raise the urgency for policymakers to act. Growth in the United States, buoyed by a pro-cyclical fiscal package, continues at a robust pace and is driving U.S. interest rates higher. But U.S. growth will decline once parts of its fiscal stimulus go into reverse. Notwithstanding the present demand momentum, we have downgraded our 2019 U.S. growth forecast owing to the recently enacted tariffs on a wide range of imports from China and China’s retaliation. China’s expected 2019 growth is also marked down. Domestic Chinese policies are likely to prevent an even larger growth decline than the one we project, but at the cost of prolonging internal financial imbalances.” Click here for the full report.
On Oct. 9, the IMF published the following: “The latest World Economic Outlook report projects that global growth will remain steady over 2018–19 at last year’s rate of 3.7 percent. This growth exceeds that achieved in any of the years between 2012 and 2016. It occurs as many economies have reached or are nearing full employment and as earlier deflationary fears have dissipated. Thus, policymakers still have an excellent opportunity to build resilience and implement growth-enhancing reforms. Last April, the world economy’s broad-based momentum led us to project a 3.9 percent growth rate for both this year and next. Considering developments since then, however, that number appears over-optimistic: rather than rising, growth has plateaued at 3.7 percent. And there are clouds on the horizon. Growth has proven to be less balanced than hoped. Not only have some downside risks that the last WEO identified been realized, the likelihood of further negative shocks to our growth forecast has risen. In several key economies, moreover, growth is being supported by policies that seem unsustainable over the long term. These concerns raise the urgency for policymakers to act. Growth in the United States, buoyed by a pro-cyclical fiscal package, continues at a robust pace and is driving U.S. interest rates higher. But U.S. growth will decline once parts of its fiscal stimulus go into reverse. Notwithstanding the present demand momentum, we have downgraded our 2019 U.S. growth forecast owing to the recently enacted tariffs on a wide range of imports from China and China’s retaliation. China’s expected 2019 growth is also marked down. Domestic Chinese policies are likely to prevent an even larger growth decline than the one we project, but at the cost of prolonging internal financial imbalances.” Click here for the full report.
SMU Data Analysis
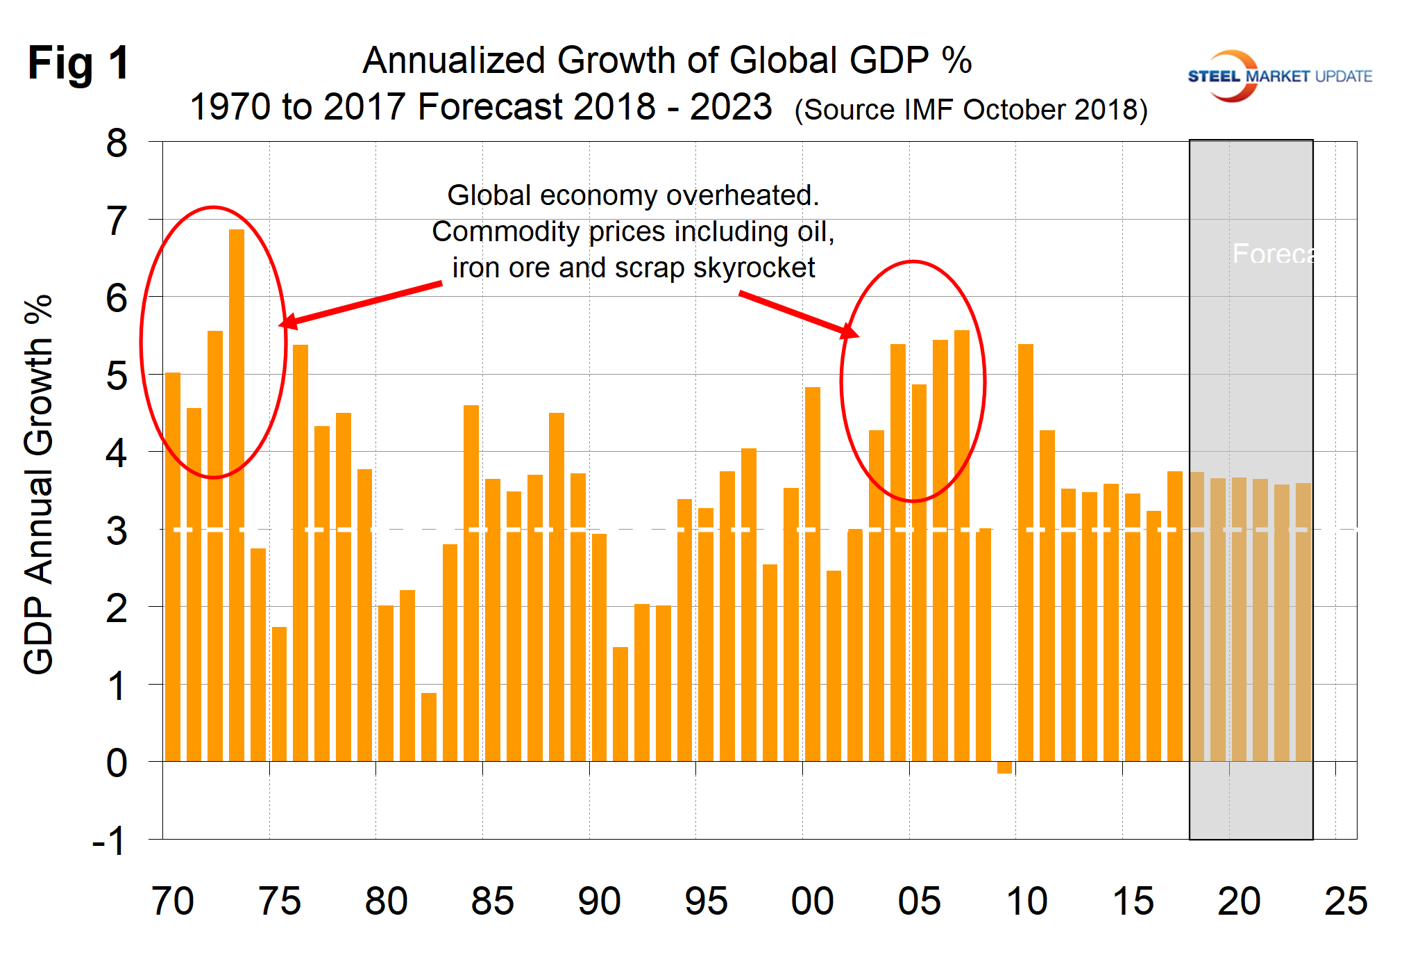
Figure 1 shows the growth of global GDP since 1970 with this month’s IMF forecast through 2023. We have highlighted the periods of the early ’70s and the mid-2000s when the commodity bubbles prevalent at those times were driven by unusually high and sustained global growth. The collapse of the commodity bubble in the last decade coincided with the U.S. banking and housing crisis, setting up the perfect storm. After the rebound in 2010, global growth declined through 2016 and is now forecast to expand at 3.7 percent this year and next, then to decline through 2023.
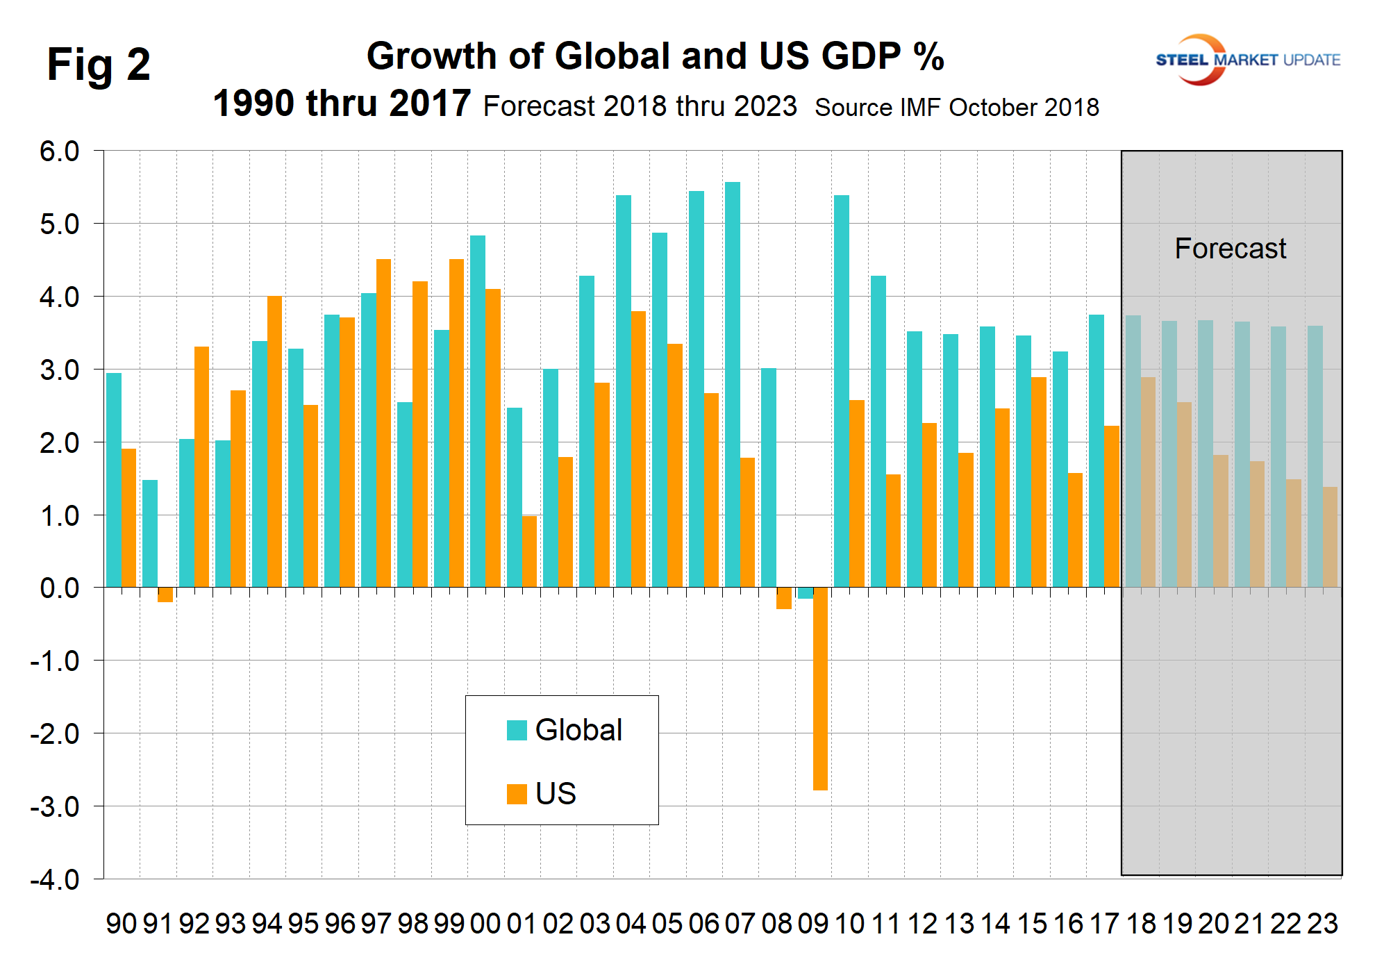
Prior to the 2001 recession, the U.S. held its own in the economic growth stakes, but between 2001 and 2008 growth in the U.S. averaged 1.84 percent less per year than the growth of the global economy as a whole (Figure 2). In the years 2011 through 2015, the gap narrowed to 0.76 percent. The difference is forecast to widen to 2.22 percent in 2023.
The U.S. has outperformed the Eurozone since 2010 and in the forecast 2018 through 2023 will continue that trend, though the gap is narrowing (Figure 3).
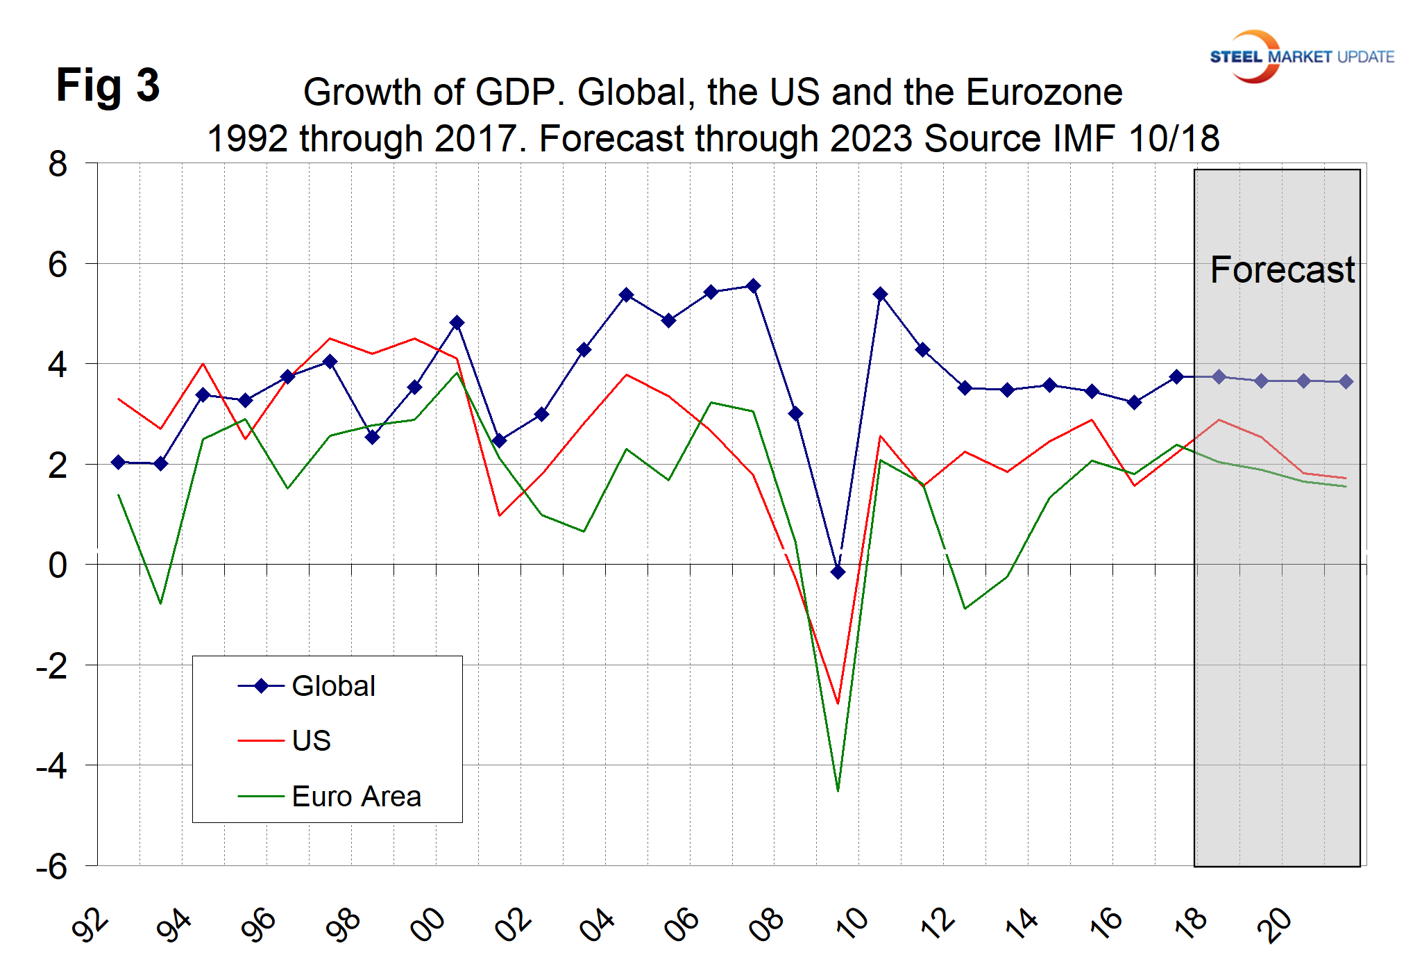
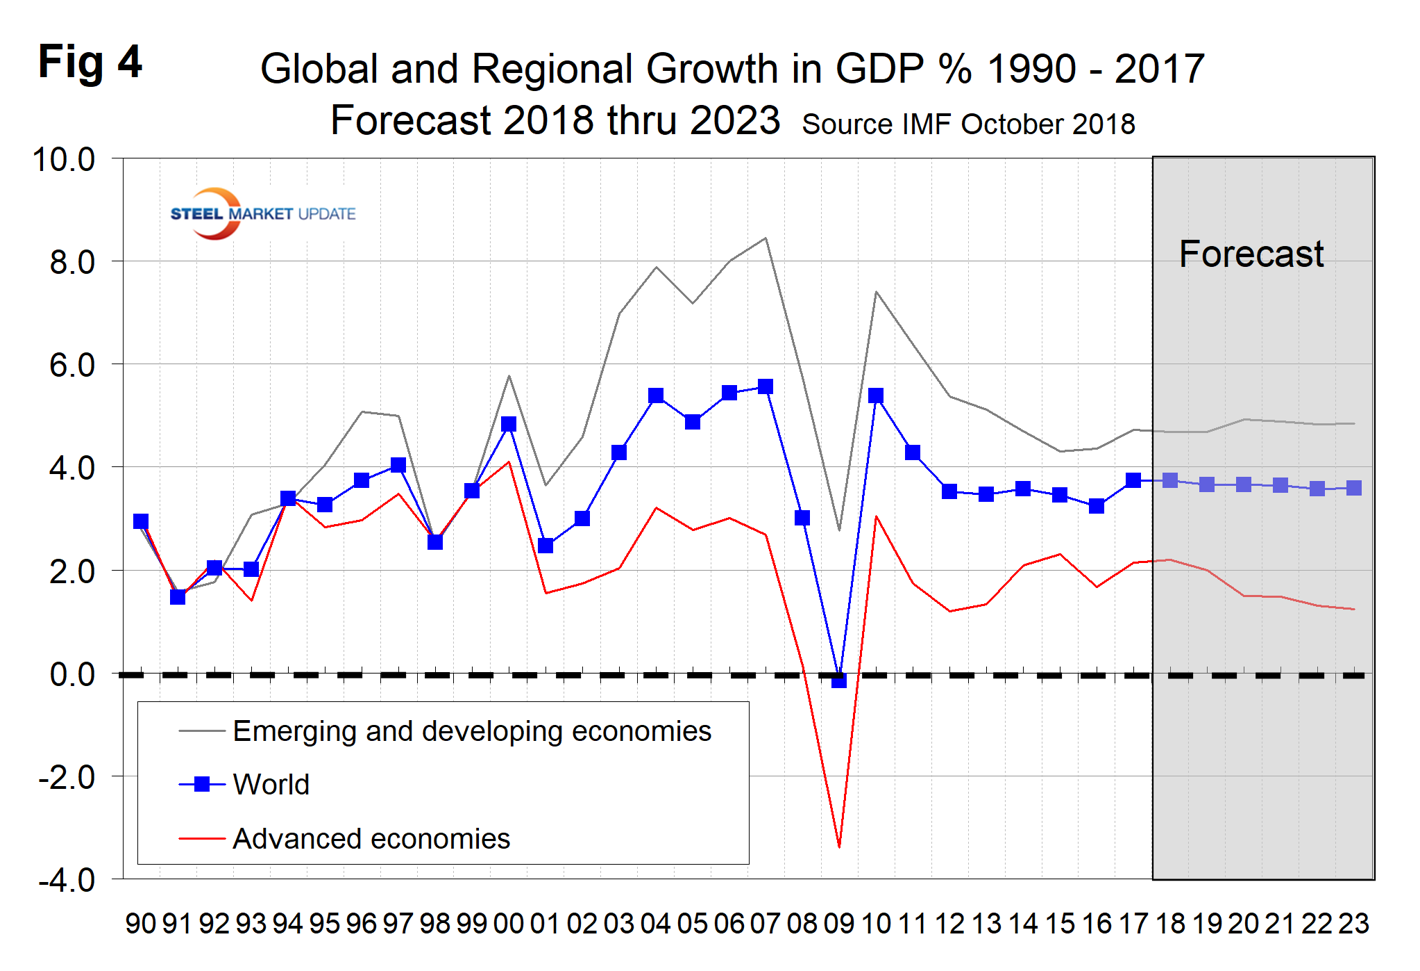
Figure 4 shows the growth comparison between emerging and developing economies and the advanced economies. The gap is projected to widen through 2023.
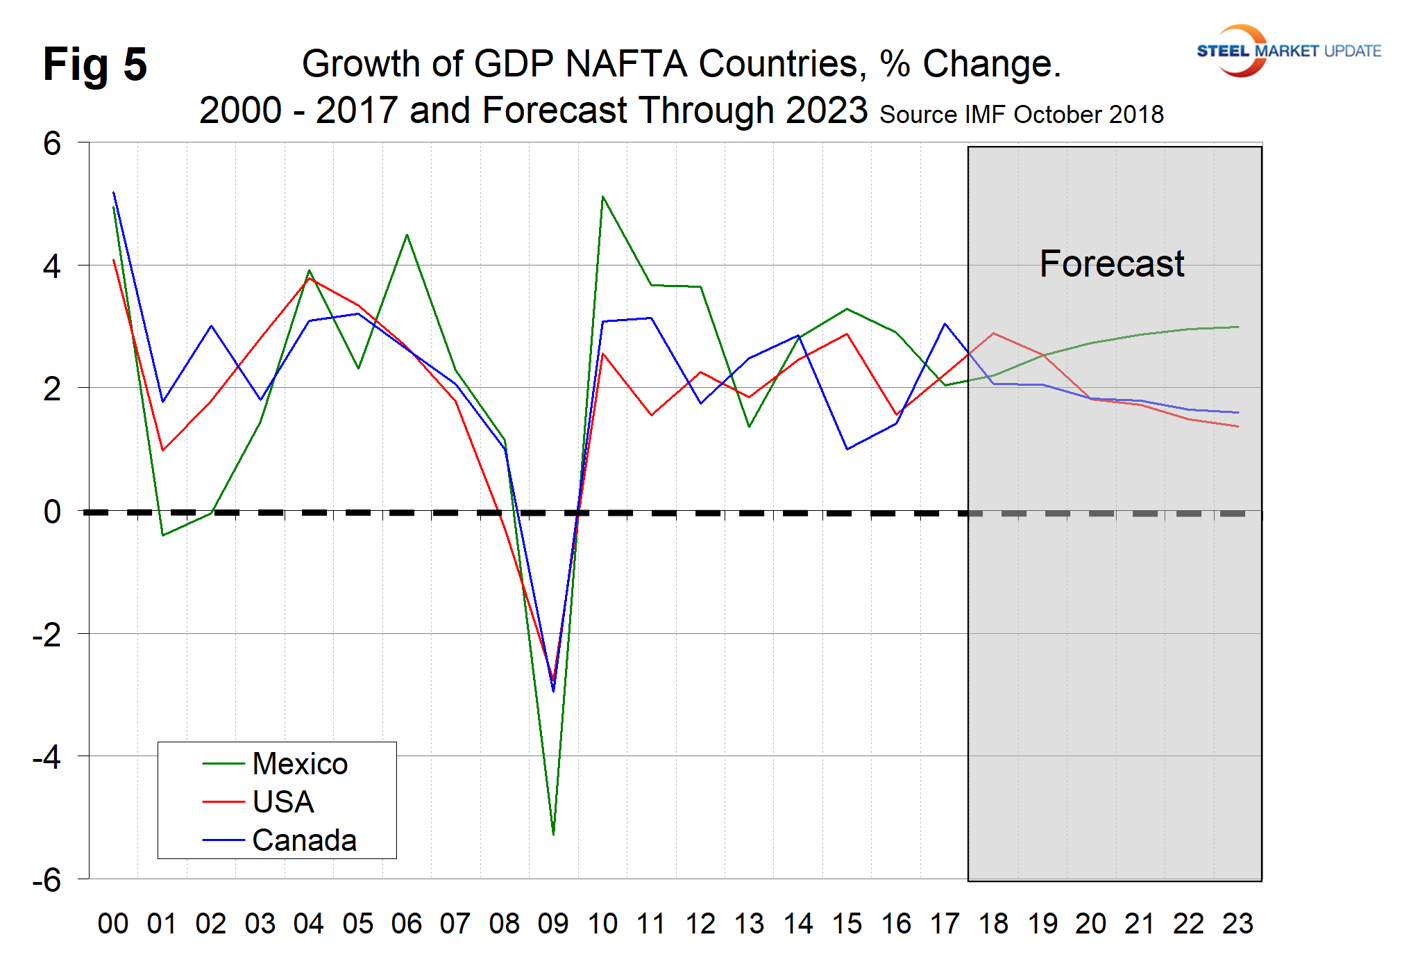
Within NAFTA, Canada had the highest rate of growth in 2017; the U.S. is forecast to lead in 2018, and Mexico to lead in the years 2020 through 2023. The U.S. is forecast to be in last place in the years 2021, 2022 and 2023 (Figure 5).
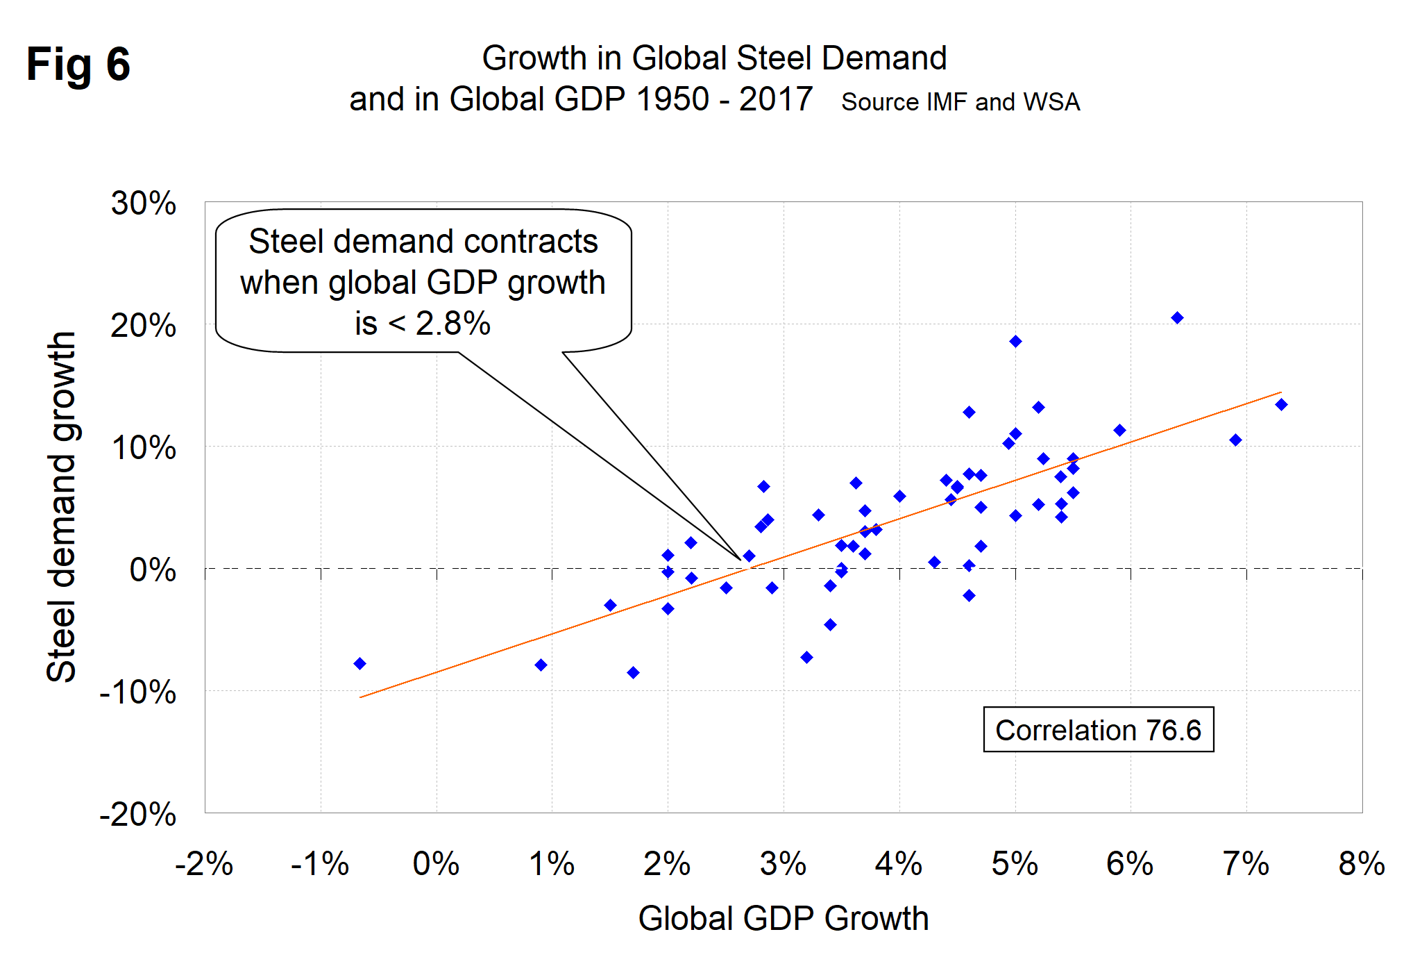
There is a relationship between the growth of GDP and steel demand at both the international and national levels, which also extends to other commodities such as cement. There are two interesting aspects to this relationship. First, the cyclical change in steel demand is vastly more volatile than the change in GDP, which we attribute to the inventory response throughout the supply chain. Second, as discovered by our friends at “Steel Guru,” 1 percent growth in GDP does not result in 1 percent growth in steel demand. At the global level it takes a 2.8 percent increase in GDP to get any increase in steel demand (Figure 6). This is a long-term average over a period of 65 years and, based on the added volatility of steel, can be a predictor of the immediate future. For example, after the disastrous decline in steel demand in 2009 there was no doubt that a huge cyclical rebound would occur as inventory managers throughout the world began to react to the economic recovery. If the IMF forecast proves to be correct, then the growth in global steel demand will average around 3 percent annually through 2023.
In the U.S. steel market, it requires about 2.2 percent growth in GDP to generate growth in steel demand. Therefore, if current forecasts prove to be correct, we can expect steel demand to be relatively strong this year, then to contract in the period 2020 through 2023.


