Market Data

September 21, 2018
SMU Currency Analysis: Values Shift in September
Written by Peter Wright
In the last month, eight of the 16 currencies that Steel Market Update tracks were down against the dollar and eight were up. This was a dramatic change from the May-August period when few of the 16 appreciated against the dollar (just one in May, two in June, three in July and two in August). Please see the end of this report for an explanation of data sources.
The Broad Index value of the U.S. dollar is reported several days in arrears by the Federal Reserve; the latest value published was for Sept. 7. Figure 1 shows the index value since January 2011. The dollar had a recent peak of 128.96 on Jan. 3, 2017, which was the highest value in almost 15 years; the recent low point was Feb. 1, 2018, at 115.21. On Sept. 7, the dollar had recovered to 126.52. 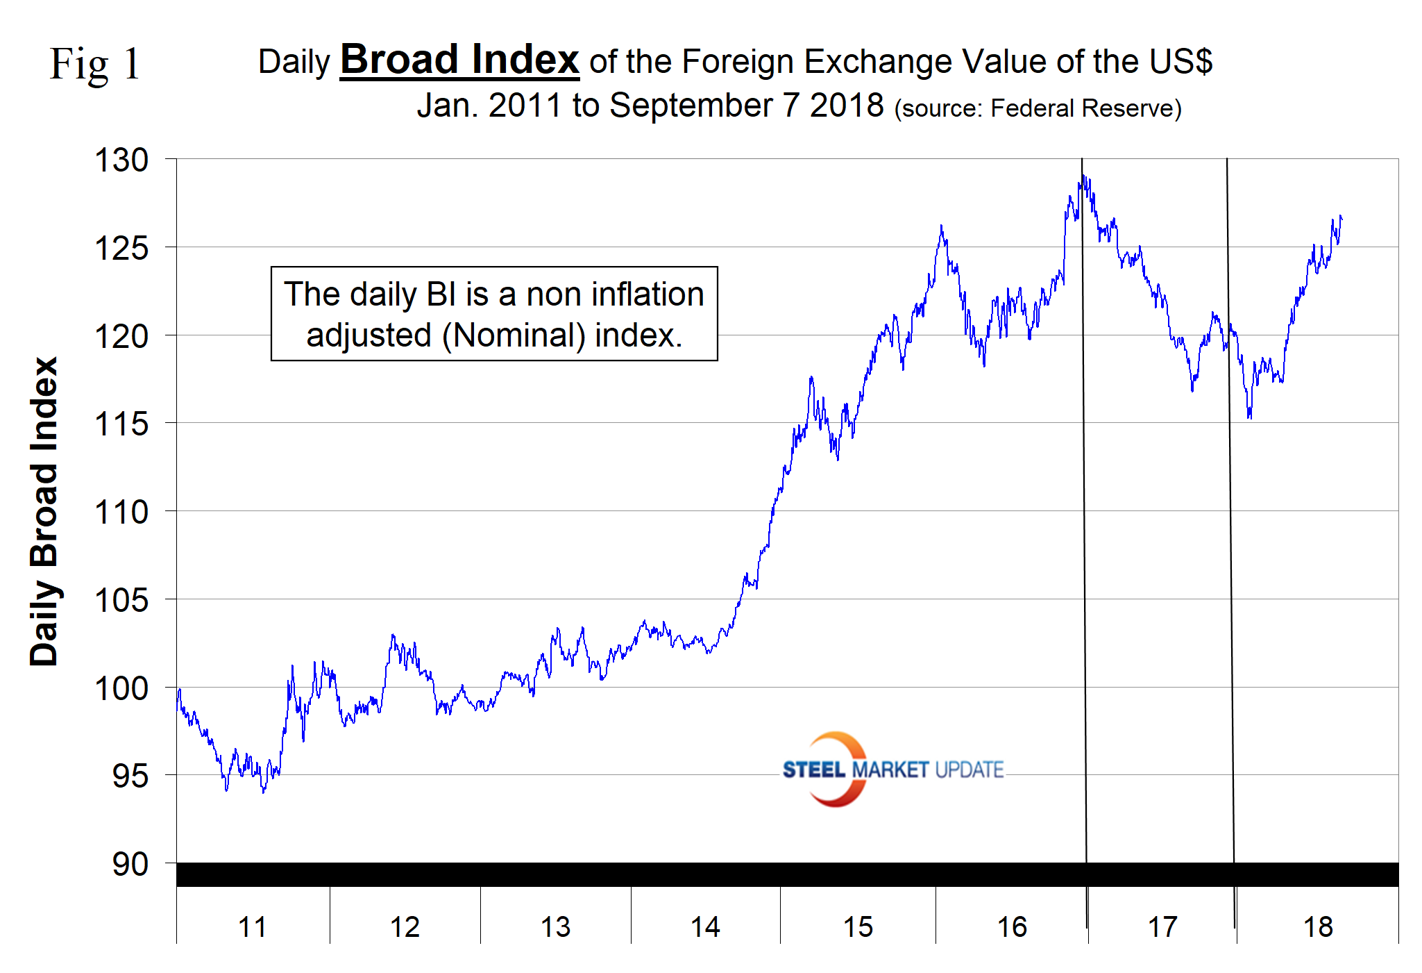
Each month, SMU publishes an update of Table 1, which shows the value of the U.S. dollar against the currencies of 16 major global steel and iron ore trading nations. The table shows the change in value in one year, three months, one month and seven days through Sept. 15. Currencies that weakened against the U.S. dollar are color coded in red. Green indicates currencies that strengthened against the U.S. dollar. There is clearly a progression of the dollar weakening moving to shorter time frames. In the last seven days, the dollar weakened against 13 of the 16. This is not apparent from the broad index shown in Figure 1 because this data is only through Sept. 7.
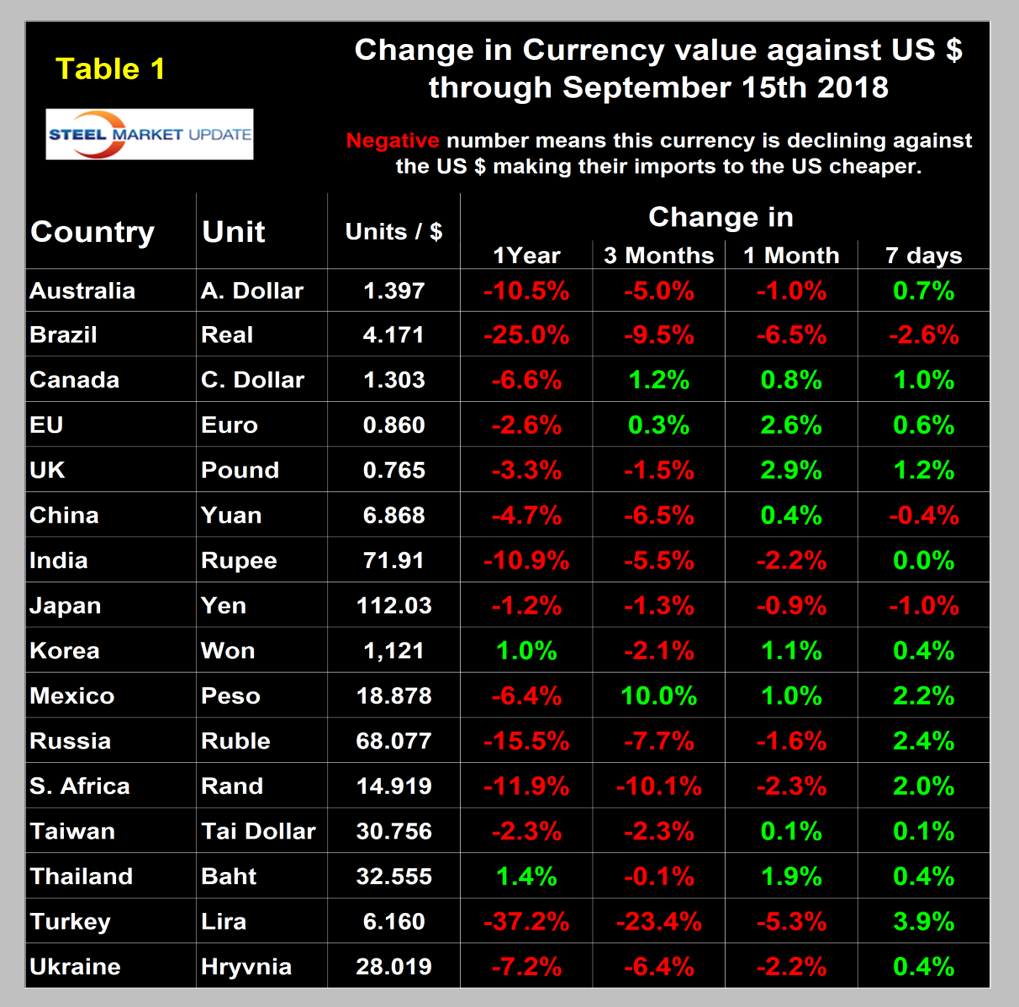
Figure 2 gives a longer-range perspective and shows the extreme gyrations that have occurred in the last three years at the one-month level. Through Sept. 15, the dollar strengthened against eight of the 16 in the previous month and weakened against the other eight.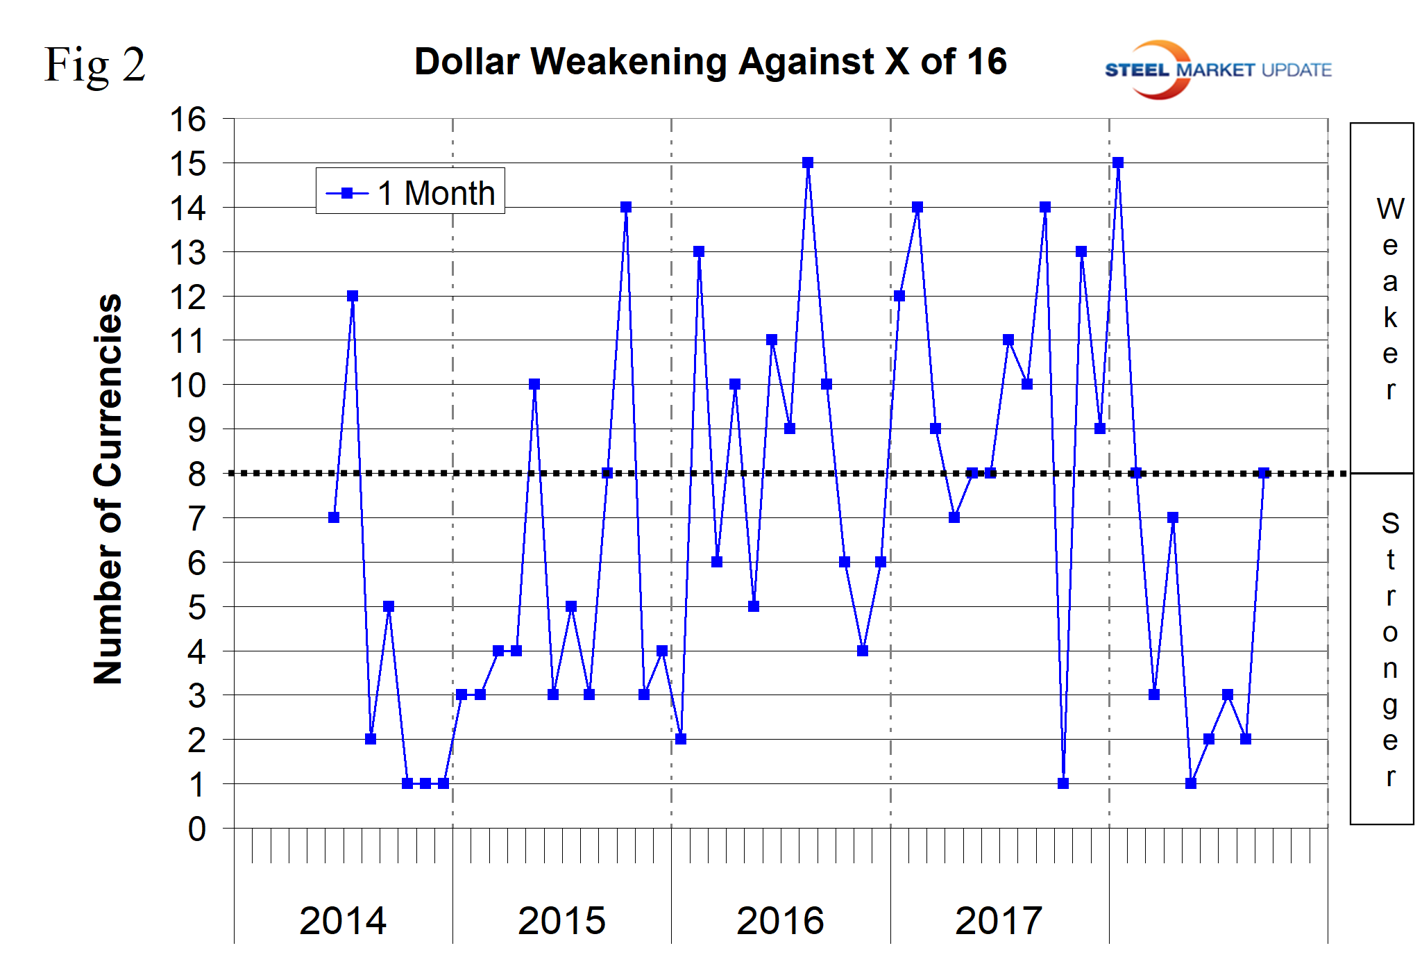
A falling dollar puts upward pressure on commodity prices that are greenback denominated. We regard strengthening of the U.S. dollar as negative and weakening as positive because of the effect on the trade balance of all commodities and on the total national trade deficit.
In each of these reports, we comment on several of the 16 steel and iron ore trading currencies listed in Table 1 and over a period of several months will describe the history of all of them. Charts for each of the 16 currencies are available through Aug. 13 for any premium subscriber who requests them.
The Chinese Yuan/Renminbi
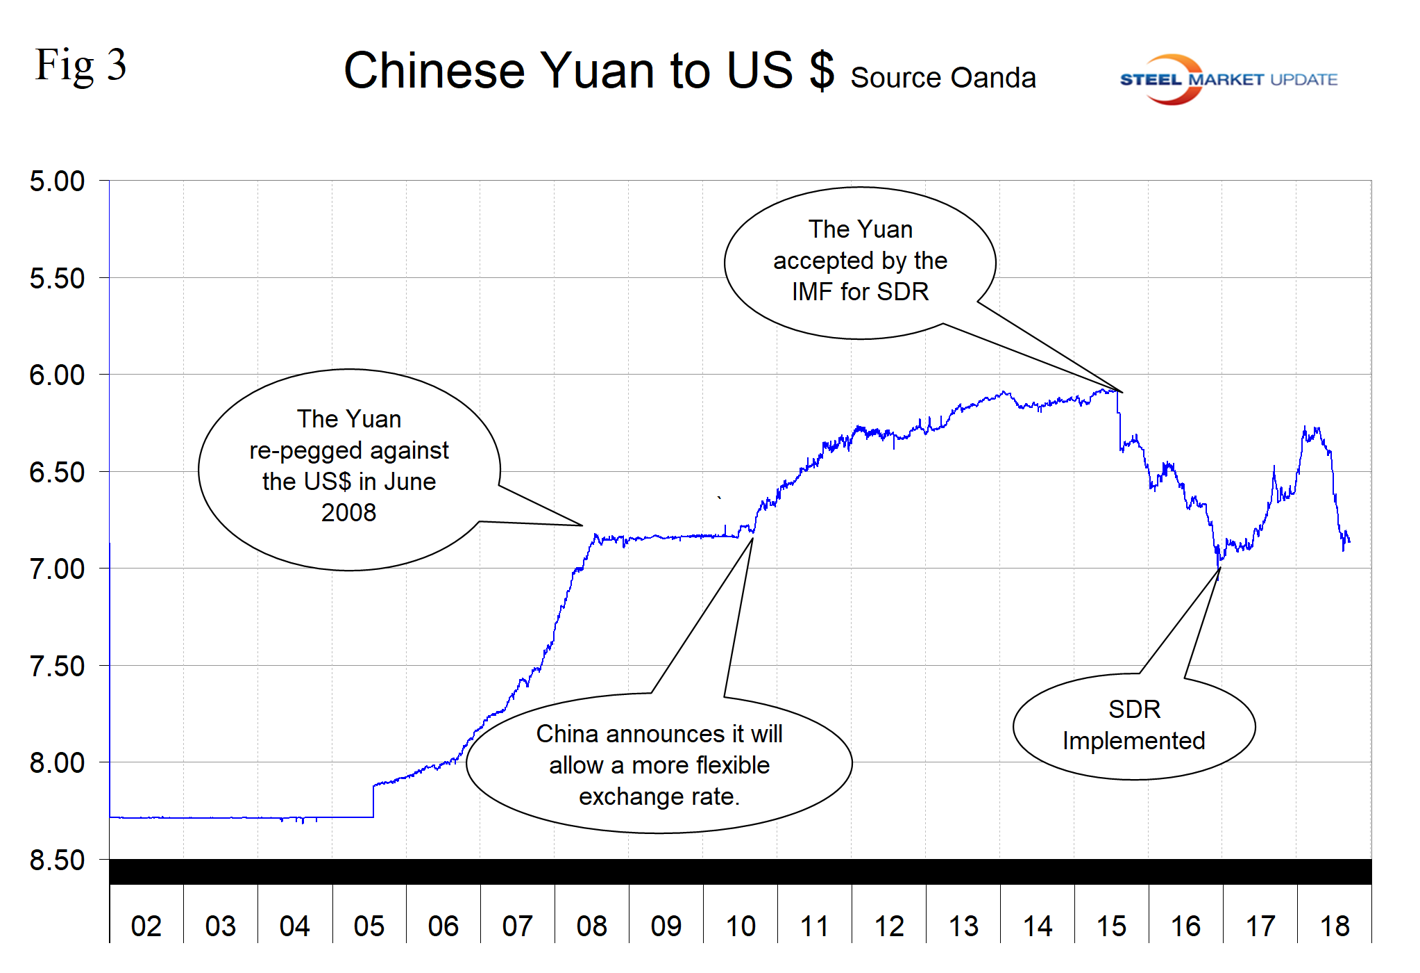
China’s currency has declined by 6.5 percent in the last three months and gave back 0.4 percent in the last month (Figure 3). On Sept.15, the yuan traded at 6.868 to the dollar. Last week, Invesco U.S. had this to say: “The renminbi/U.S. dollar exchange rate traded between 6.80 and 6.95 in August. In addition to the counter-cyclical adjustment factored into the daily fixing rate and the reserve requirement of 20 percent on foreign exchange forwards, the People’s Bank of China has banned interbank renminbi deposits and loans to the offshore market through free trade zones. This move likely led the exchange rate to quickly drop from 6.95 to 6.84. Capital controls for outflows remain tight, but financial opening, such as the inclusion of Chinese equities and onshore bonds in major global indexes, will probably further increase overseas demand for Chinese onshore assets and could help maintain stable capital flows. We expect the exchange rate to hover around 6.8 to 6.9 in the near term. However, positive headlines related to U.S.-China trade negotiations could cause the exchange rate to trade below 6.80.”
The Japanese Yen
Japan’s yen closed at 112.03 per dollar on Sept. 15. The yen has depreciated by 0.9 percent in one month and by 1.3 percent in three months (Figure 4). Invesco U.S. reported as follows on the yen: “The yen has benefited from the recent spike in volatility and deteriorating risk sentiment caused by the Turkish asset selloff. The yen/U.S. dollar exchange rate traded down from about 112 at the beginning of August to a low of 110.1 as the selloff in the Turkish lira peaked. Looking ahead, we believe that the Bank of Japan policy tweak (which increased the target for 10-year yields) will support the yen, and the current valuation looks attractive. However, the exception to our view is the potential for broader U.S. dollar strength driven by Fed policy and reduced global risk appetite from continuing trade tensions. We believe the yen may be sidelined against the U.S. dollar in this scenario, but will likely outperform versus other currencies.”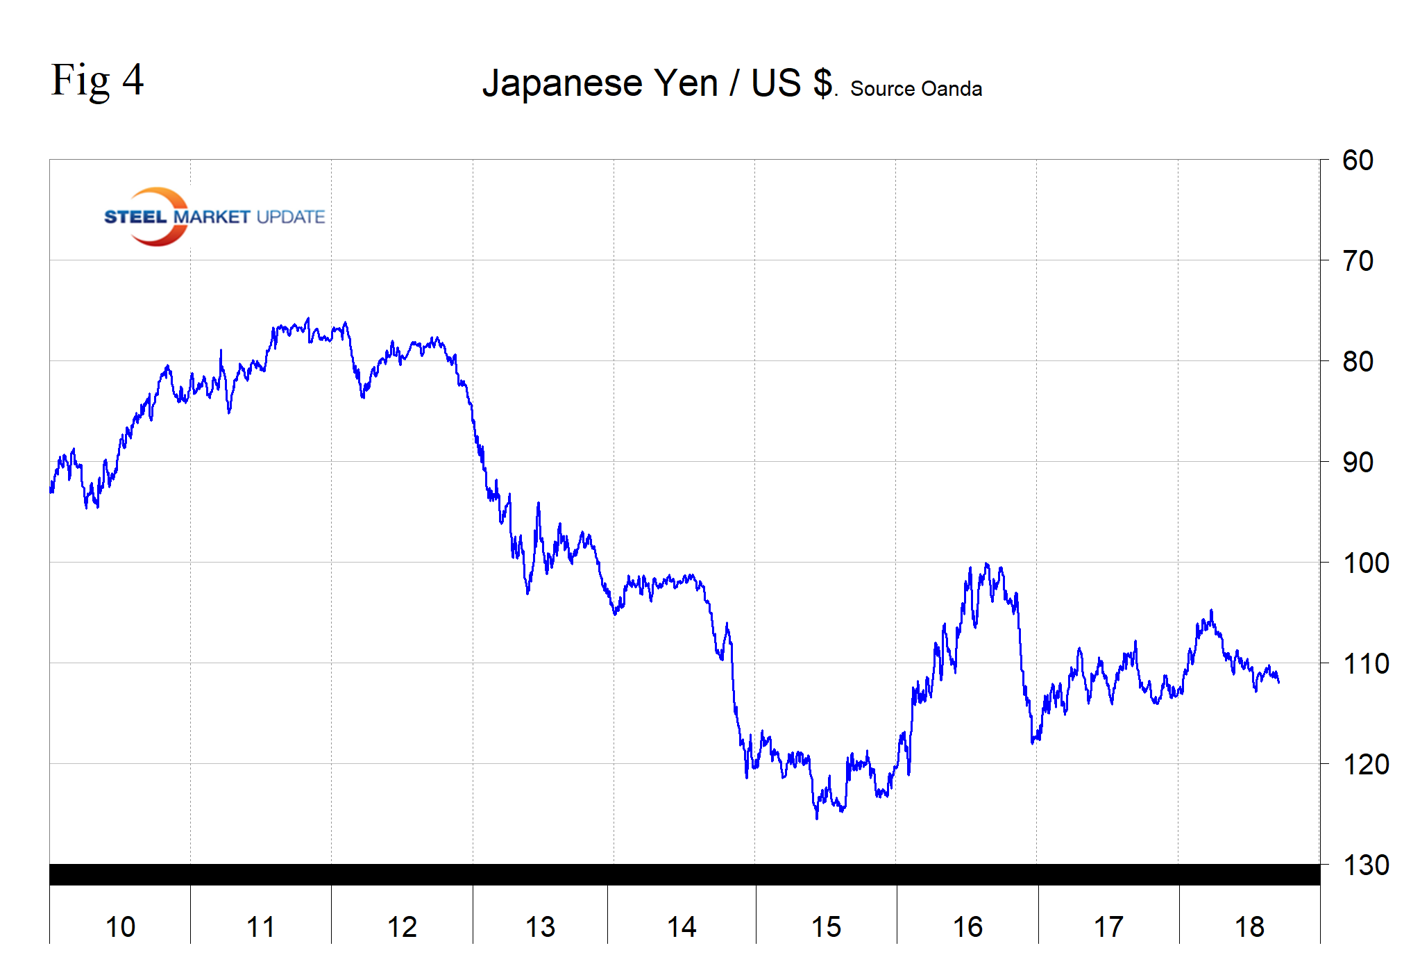
The UK Pound
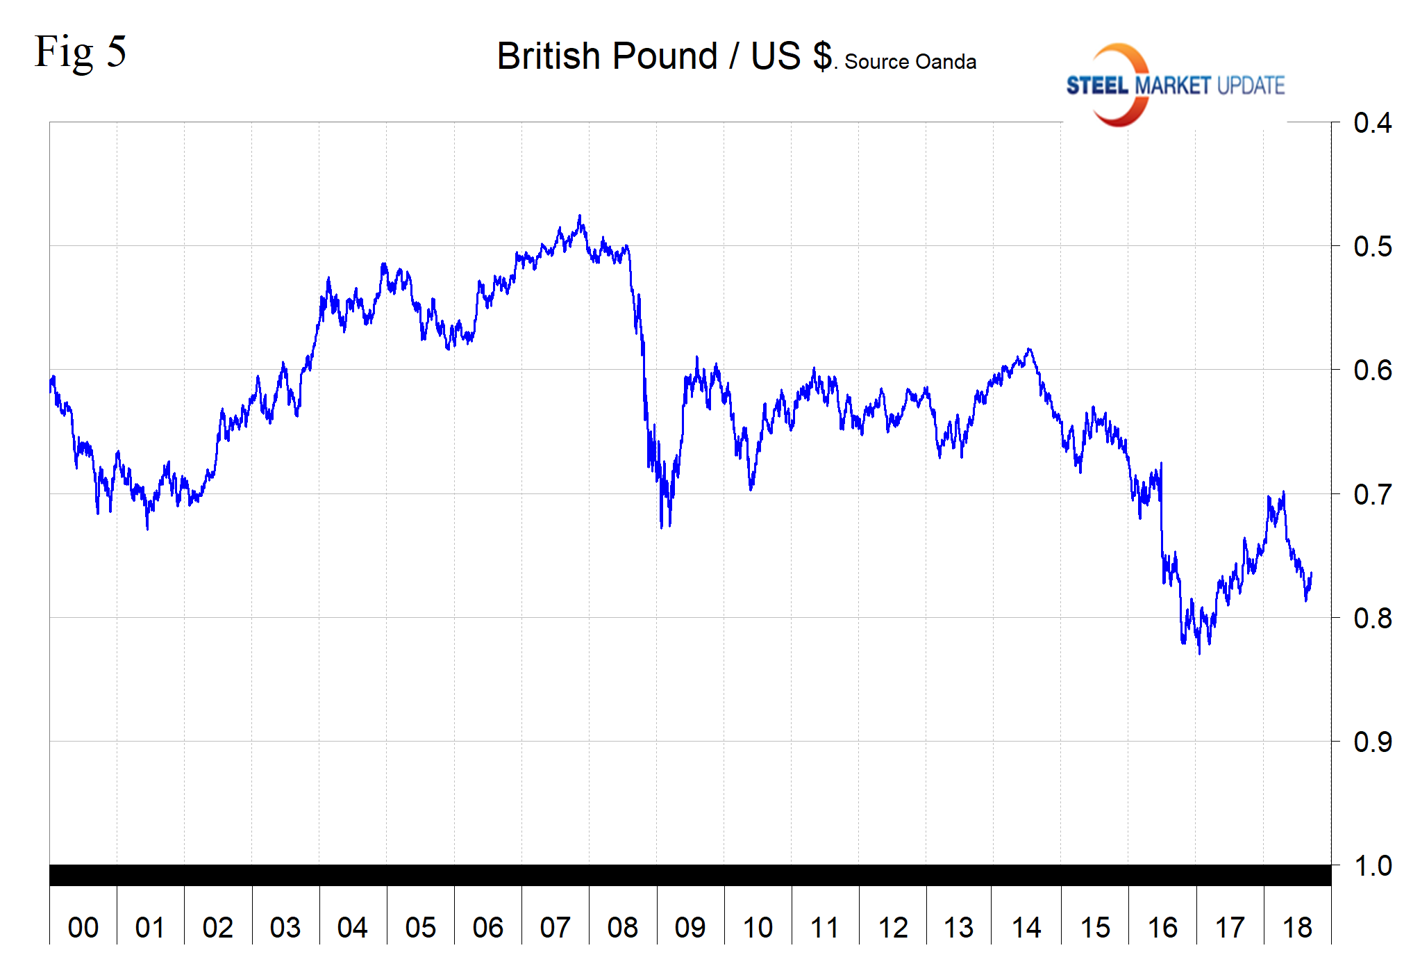
The British pound appreciated by 2.9 percent in one month through Sept. 15, but in the last three months is down by 1.5 percent (Figure 5). The pound closed at a value of 1.307 U.S. dollars on Sept. 15. Top Down Charts, an independent macro research house, reported on Sept. 4: “With Brexit looming, UK assets have been shunned by global investors, but sometimes the best investments are the ones that make you the most uncomfortable. And the pound may just fit the bill there. The other factor in play is that our composite measures of economic confidence in the UK are largely stable, and on monetary policy, the Bank of England is now in a process of gradual rate hikes—both of which are factors that tend to support the currency. So, while the prospects of a bad Brexit are certainly real, the big question is whether markets have become too pessimistic…. Judging by the valuation and positioning indicators, I’d say it sure looks like it.”
The South African Rand
South Africa’s rand closed at 14.92 to the dollar on Sept. 15 and was down by 10.1 percent in the last three months (Figure 6). After the Turkish lira, this was the largest decline of any of the 16. The highest volume steel product shipped into the U.S. is hot dipped galvanized sheet.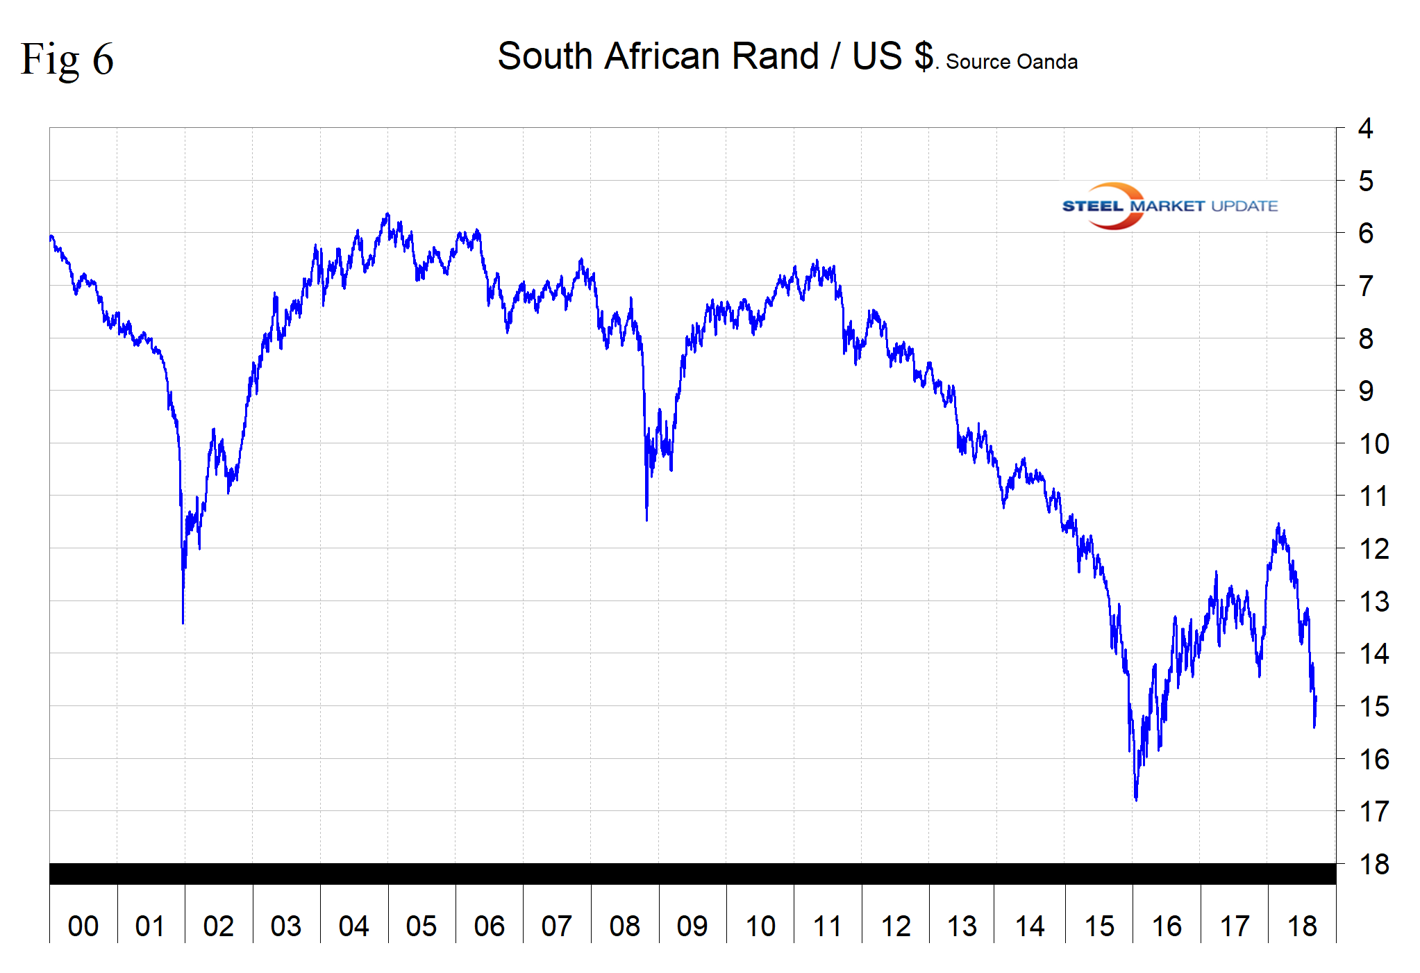
The Thai Baht
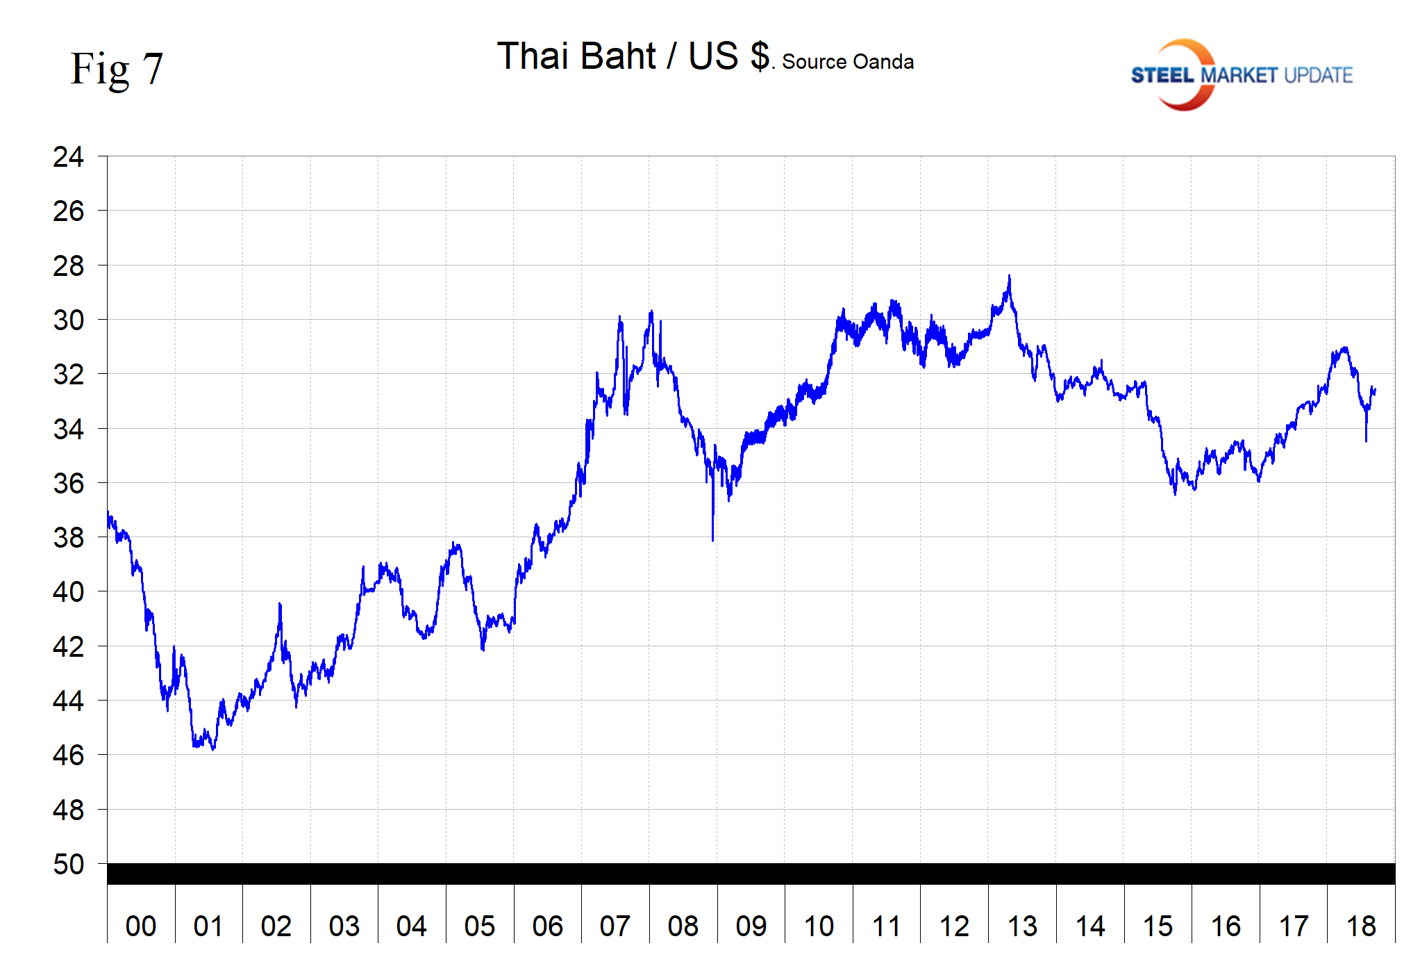
Thailand’s baht closed at 32.55 to the dollar on Sept. 15 and was up by 1.9 percent in the previous 30 days (Figure 7). On Aug. 27, currency analyst Hau Huang wrote: “If we look at BOT’s latest Monetary Policy Committee’s Decision, we see they voted 6 to 1 to maintain the policy rate at 1.50 percent. The BOT continues to remain accommodative in its monetary policy to help support the continuation of domestic economic expansion and bringing the headline inflation towards target in a sustainable manner. Hence, the chances for BOT to hike rates in their next meeting in September remain low and the divergence in the monetary policy between the two central banks should push USD/THB higher going forward.”
Explanation of Data Sources: The broad index is published by the Federal Reserve on both a daily and monthly basis. It is a weighted average of the foreign exchange values of the U.S. dollar against the currencies of a large group of major U.S. trading partners. The index weights, which change over time, are derived from U.S. export shares and from U.S. and foreign import shares. The data are noon buying rates in New York for cable transfers payable in the listed currencies. At SMU, we use the historical exchange rates published in the Oanda Forex trading platform to track the currency value of the U.S. dollar against that of 16 steel and iron ore trading nations. Oanda operates within the guidelines of six major regulatory authorities around the world and provides access to over 70 currency pairs. Approximately $4 trillion U.S. dollars are traded every day on foreign exchange markets.


