Market Data

September 13, 2018
SMU Analysis: Imports of Cut-to-Length Plate by Region
Written by Peter Wright
Each month, Steel Market Update produces an import analysis by region for two of the six flat rolled product groups (HRC, CRC, HGD, OMC, CTL plate and coiled plate). This month, we are focusing on plate products. The intent of these regional updates is to bridge the gap between our monthly licensed data summaries and the detailed monthly reports that we produce for premium subscribers that cover import volume by port and source.
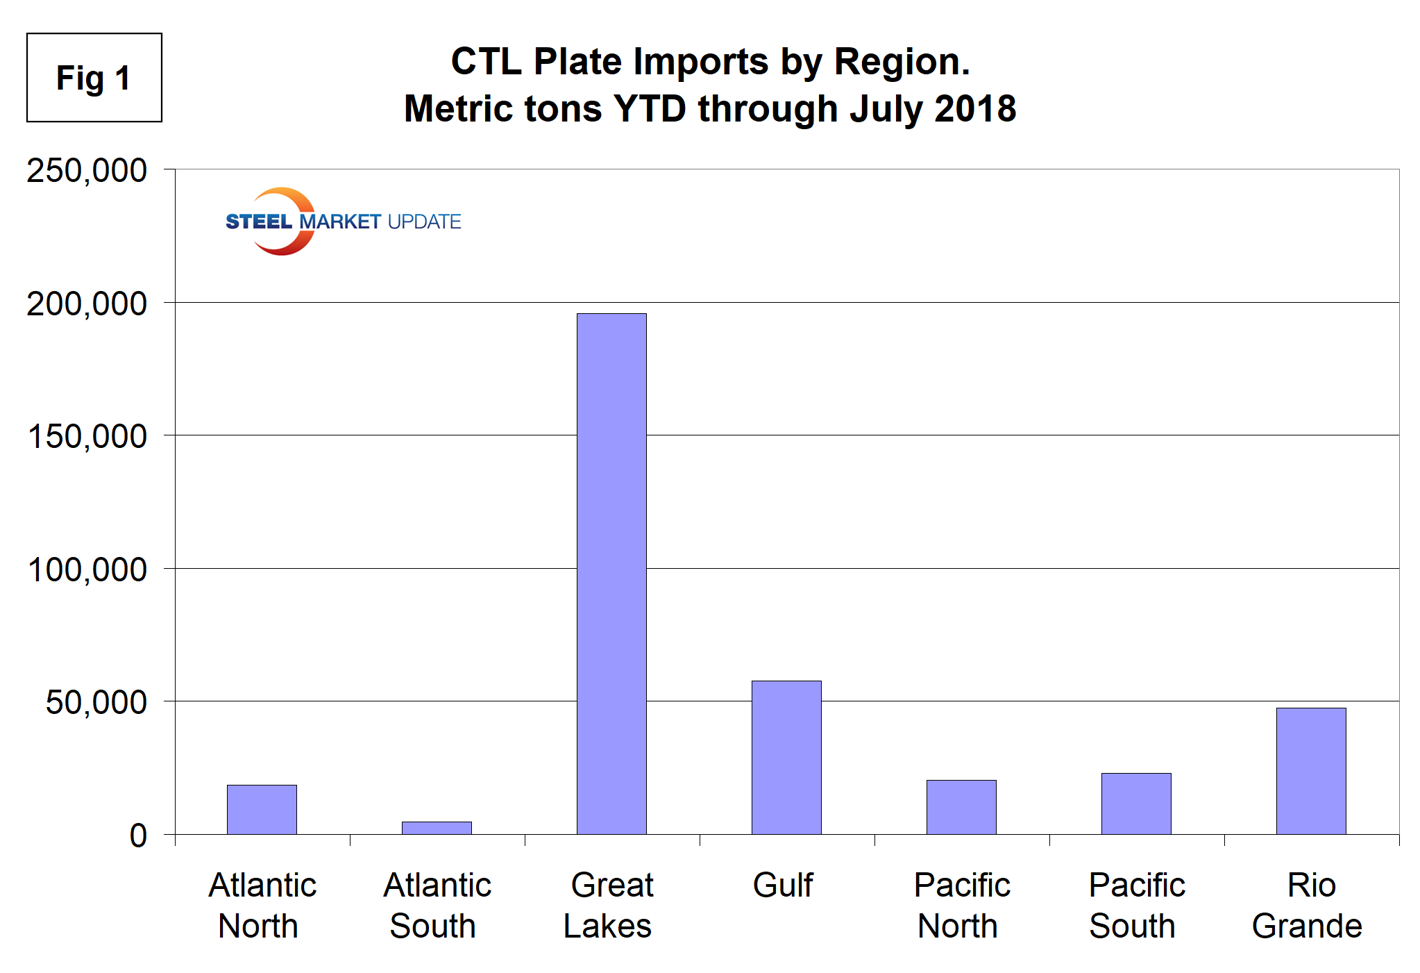
In the year to date through July 2018, 53.3 percent of all cut-to-length plate imports came in through the Great Lakes ports. The Gulf was in second place with 15.7 percent and the Rio Grande Valley third with 12.9 percent. The tonnage into the whole Pacific seaboard was minimal and even less into the Atlantic coast ports.
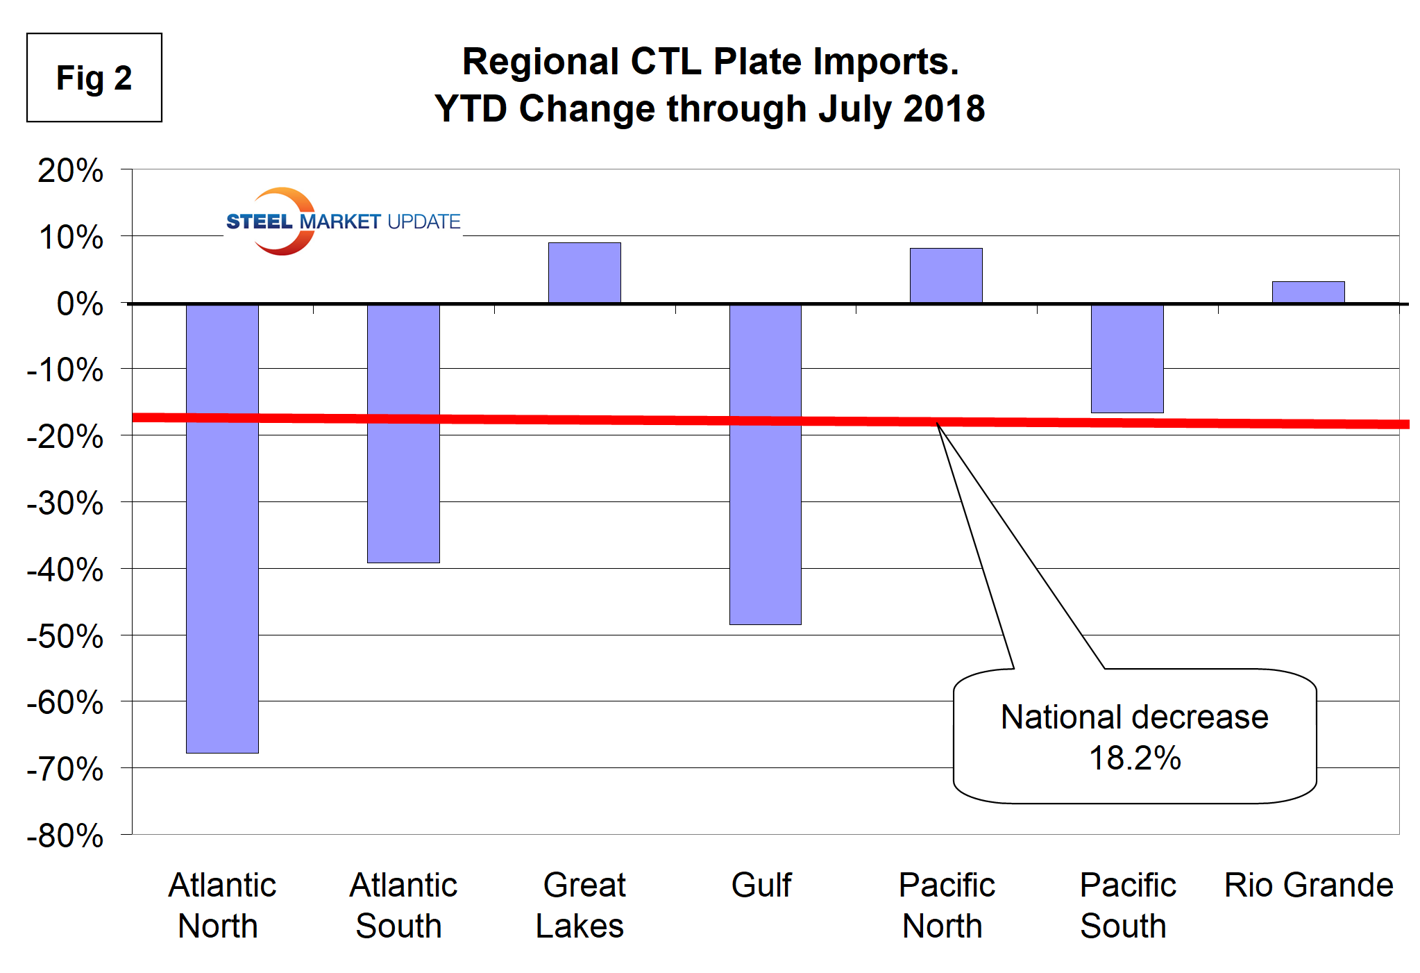
Imports into the U.S. as a whole were down by 18.2 percent year to date compared to 2017, but the Great Lakes were up by 9.0 percent and the Gulf was down by 48.5 percent. Figure 2 shows the percent change by region in 2018 compared to 2017.
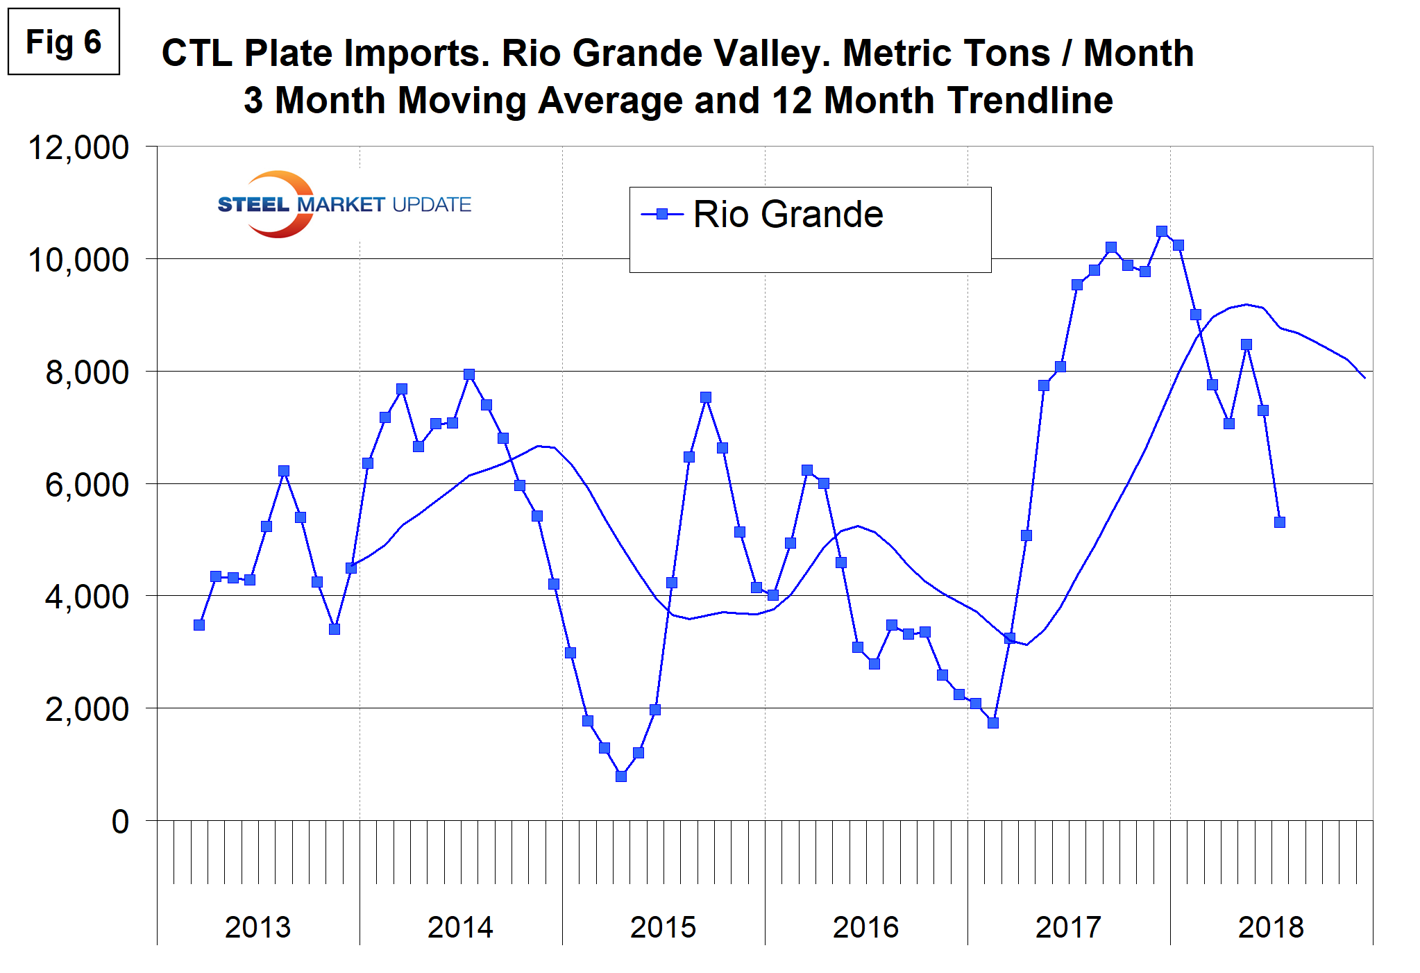
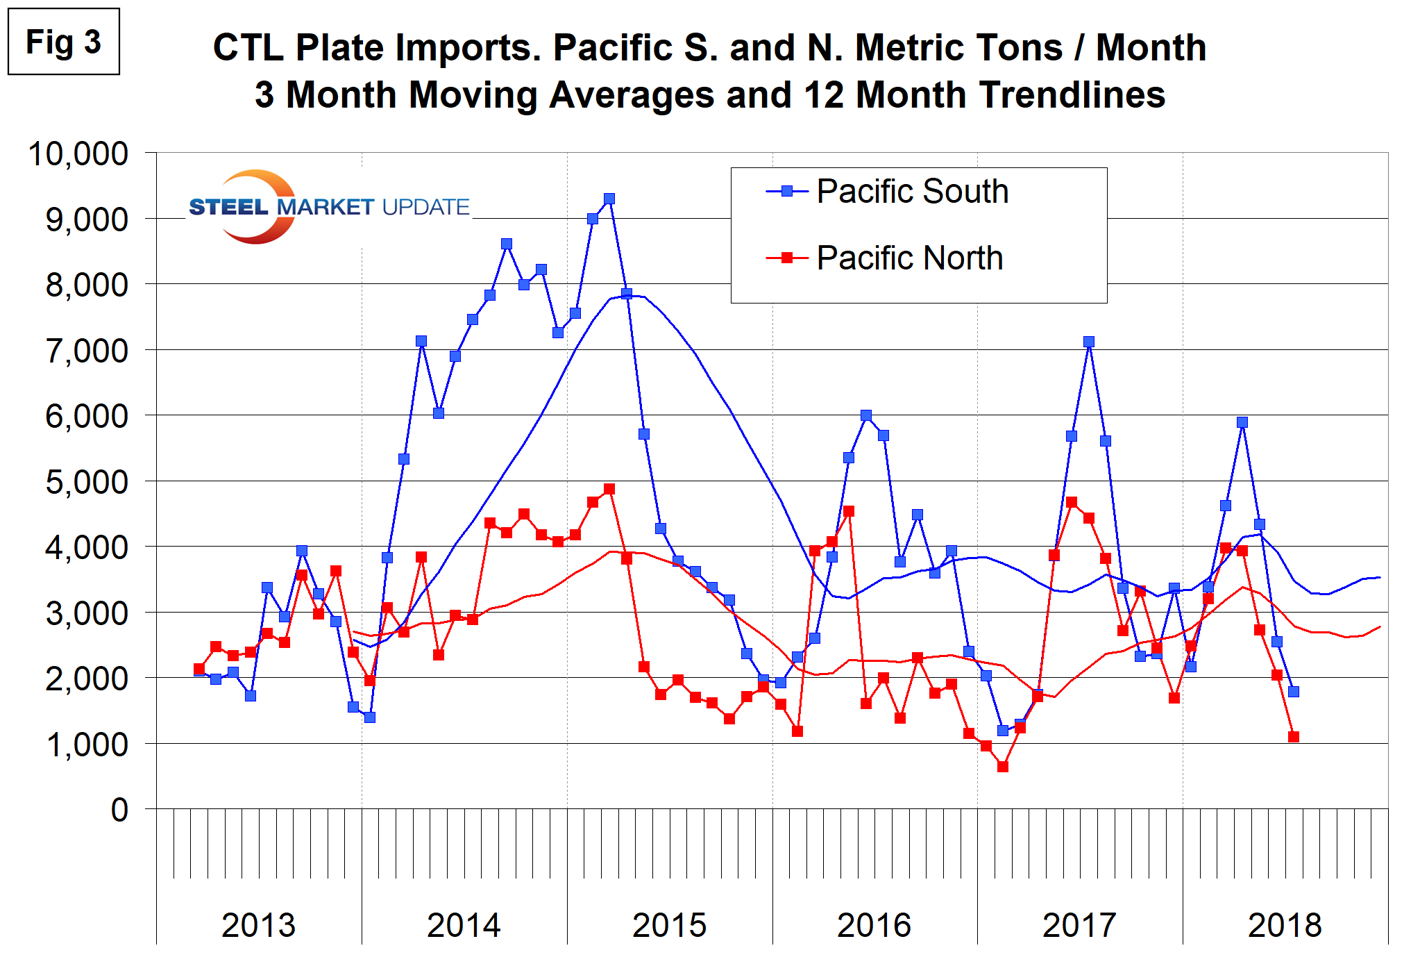
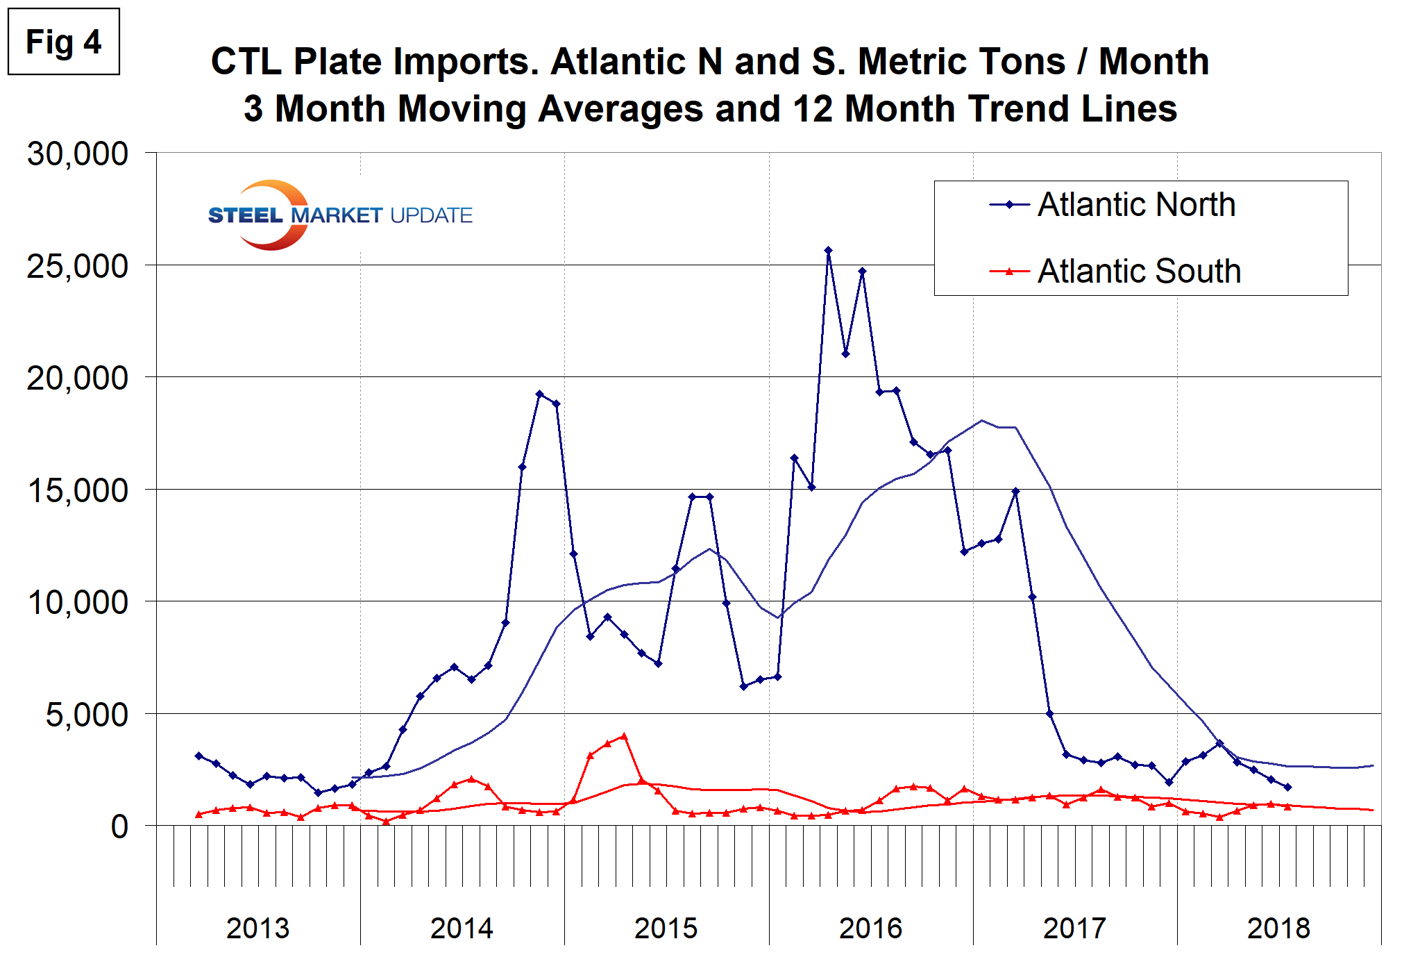
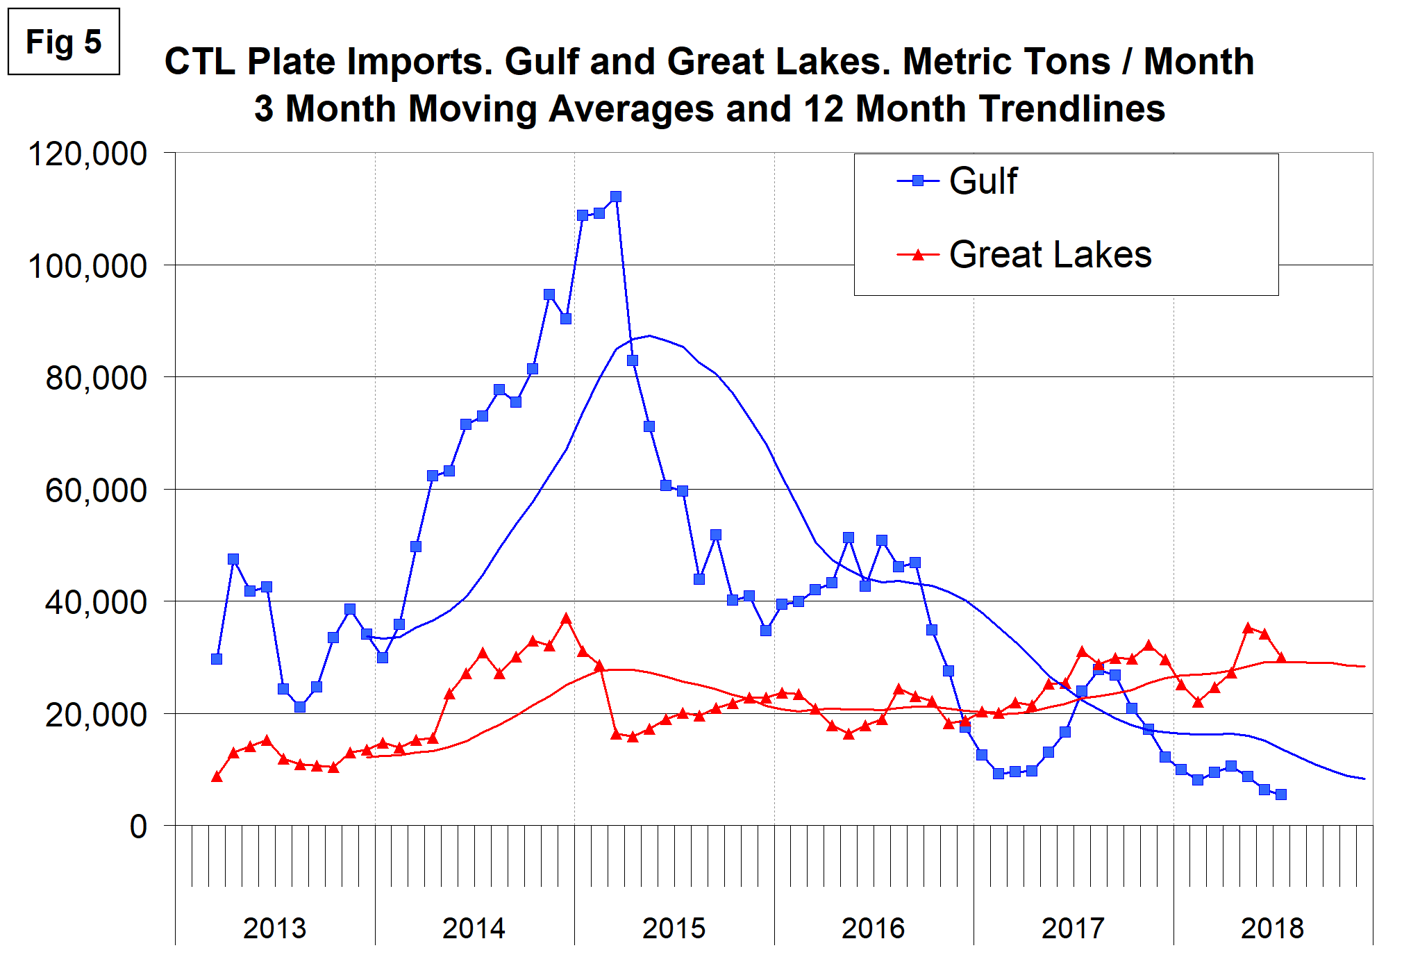
Figures 3, 4, 5 and 6 show the history of CTL plate imports by region since March 2013 on a three-month moving average basis.
Imports through the Pacific Coast ports have been very erratic since the beginning of 2016, and currently both the North and South ports are at a low point.
CTL plate imports into the North Atlantic ports collapsed from mid-2016 to mid-2017 and have not recovered. Imports into the South Atlantic have been minimal throughout the whole time frame of this study.
Import volume into the Gulf has declined by 95 percent since March 2015 and is still trending down. Imports into the Great Lakes have been trending up in the same time frame.
Tonnage out of Mexico, mostly through Laredo, increased strongly last year, but has been trending down in 2018.