Prices

September 13, 2018
HRC Futures Rangebound and Backwardated; Remains a Buyer’s Market
Written by David Feldstein
The following article on the hot rolled coil (HRC) futures market was written by David Feldstein. As the Flack Global Metals Director of Risk Management, Dave is an active participant in the hot rolled futures market, and we believe he provides insightful commentary and trading ideas to our readers. Besides writing futures articles for Steel Market Update, Dave produces articles that our readers may find interesting under the heading “The Feldstein” on the Flack Global Metals website, www.FlackGlobalMetals.com. Note that Steel Market Update does not take any positions on HRC or scrap trading, and any recommendations made by David Feldstein are his opinions and not those of SMU. We recommend that anyone interested in trading steel futures enlist the help of a licensed broker or bank.
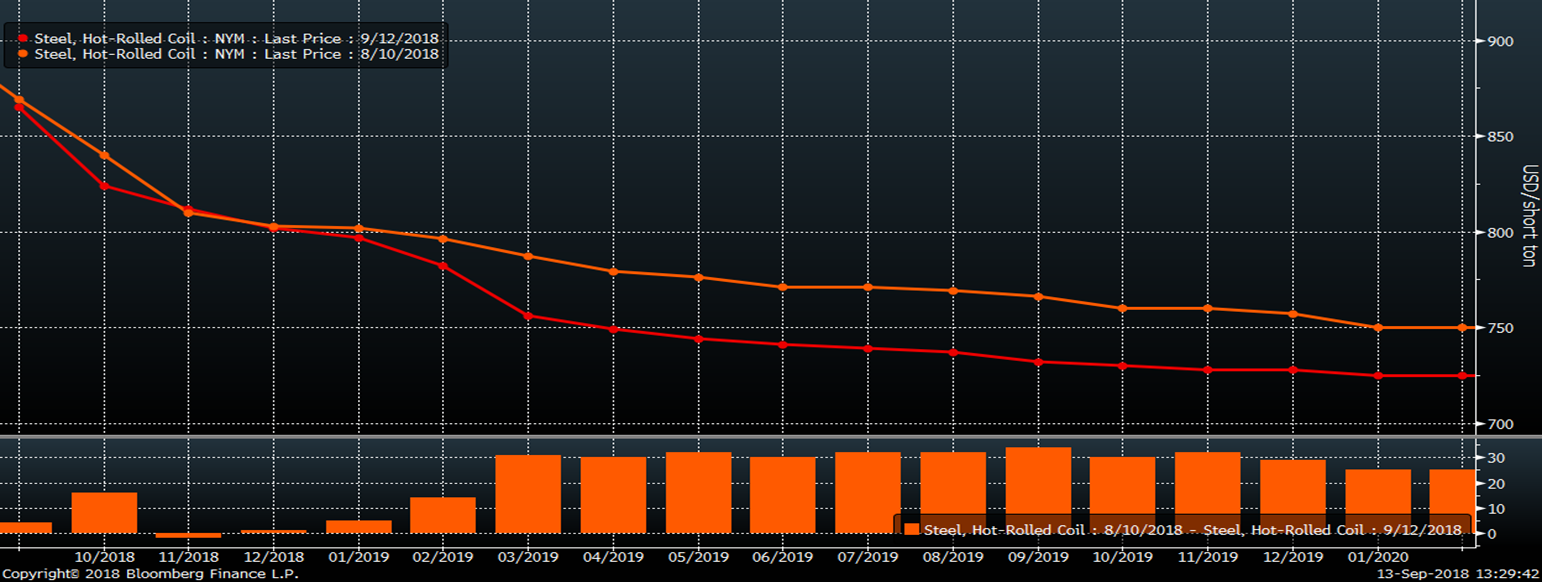
The CME Midwest HRC futures continue to be rangebound and steeply backwardated. The chart below shows the curve settlements as of 9/12/18 and 8/10/18. There has been almost no change in the front of the curve, however the back side of the curve (3/19 – 12/19) has moved down $25 to $30 over that time.
CME Midwest HRC Futures Curve
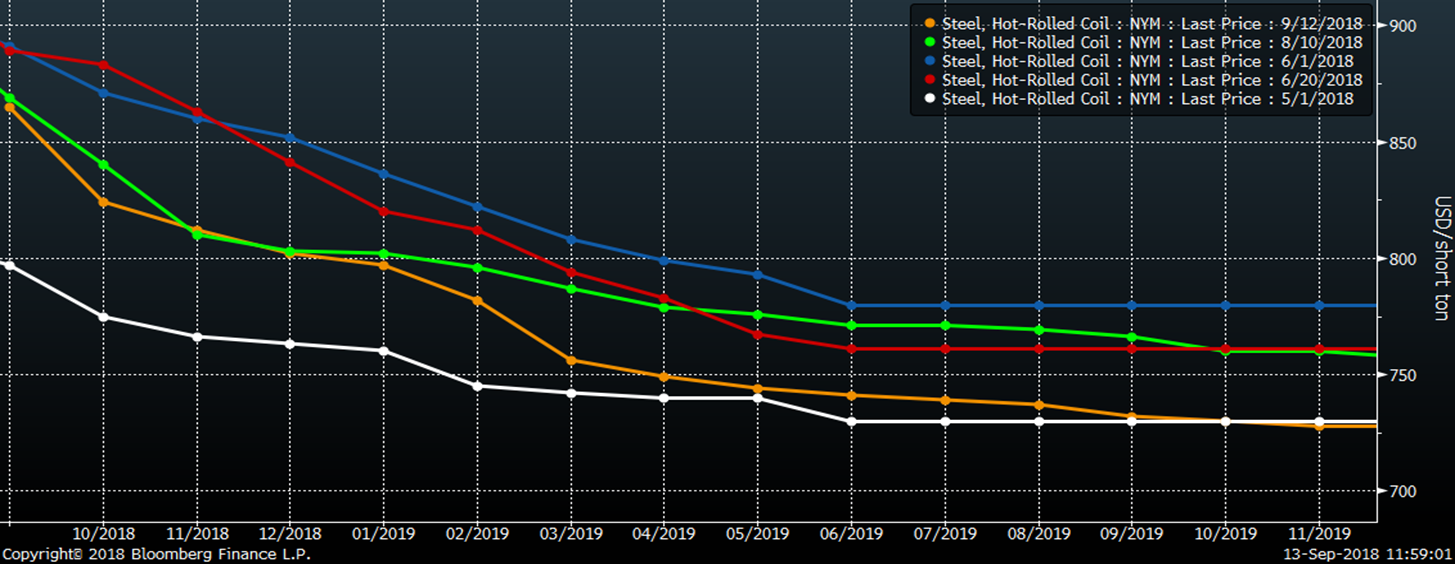
This chart shows the curve dating back to May 1 (white) and June 1 (blue), and the other dates are indicated in the upper right hand corner. June 1 was the reaction to President Trump’s pulling of tariff exclusions. Since then, the curve has traded in a $50 range.
CME Midwest HRC Futures Curve
HRC indexes are finally catching up with the move lower in physical hot rolled prices; however, the futures are still below spot. This week’s week-over-week report provided an analysis of why we believe the market is setting up for a near-term V-shaped recovery in flat rolled prices.
October CME Midwest HRC Future (orange) & Platts TSI Midwest HRC Index (white)
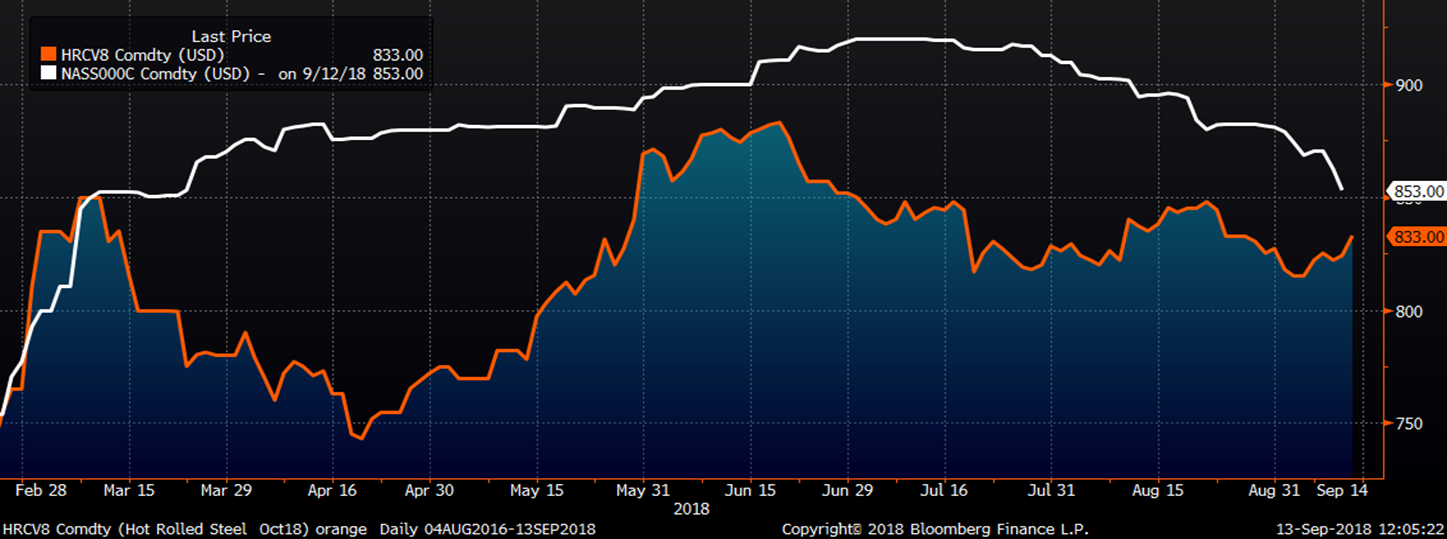
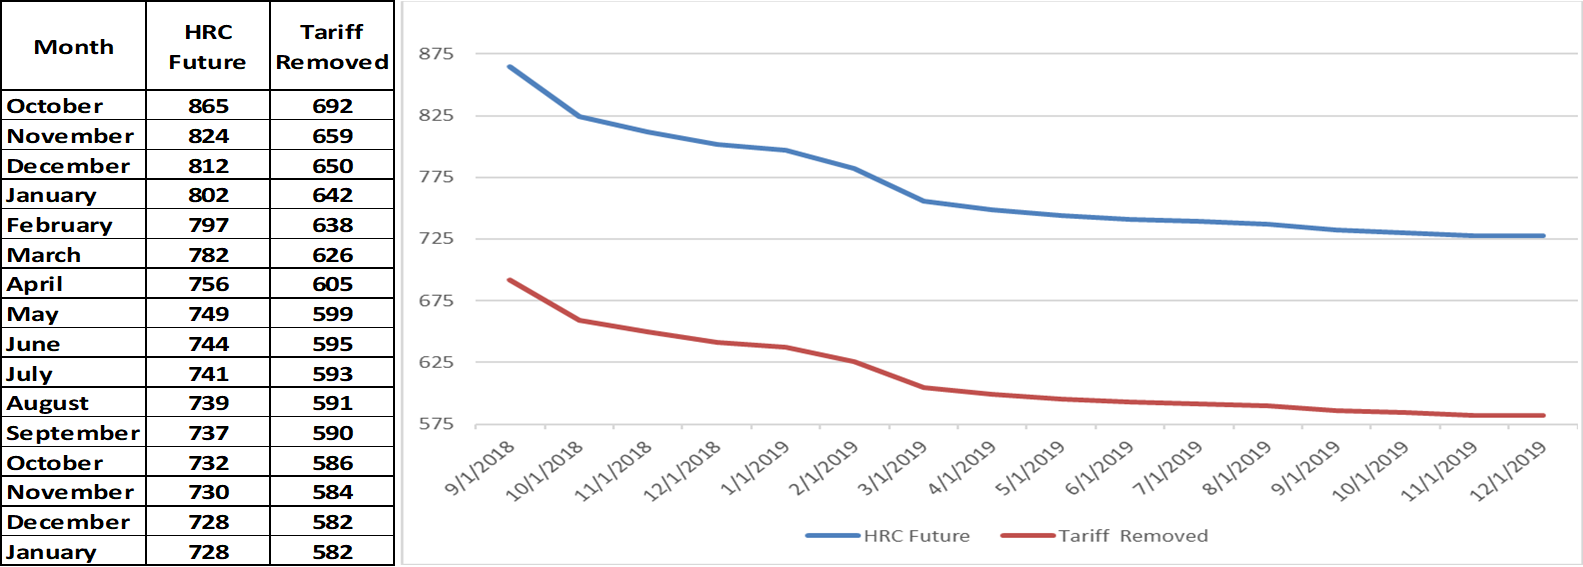
One perspective on evaluating futures prices is to look at the futures curve with the 25 percent tariff removed (shown below in red). Tariff removed, Q1 2019 would be trading at $635, Q2 at $600 and calendar 2019 at $600. Thoughts?
So, what is the trade in hot rolled for importers, mills, OEMs and service centers? The best trade continues to be in the favor of OEMs to buy the backwardation. This has worked all year and continues to be attractive, especially for those OEMs that can lock in margins on fixed sales for their products. As difficult of a year as it has been for OEMs and buyers in the spot market, it has been a phenomenal year for OEM buyers that have bought futures to hedge upside price risk. The metal spread, i.e. buying scrap or iron ore and selling HRC, has decreased, but continues to be a very profitable trade for domestic mills at $380 to $440/st. As far as service centers and importers go, hedging downside inventory or carry trade (import) risk continues to be an uphill battle and not attractive due to the curve’s steep backwardation.
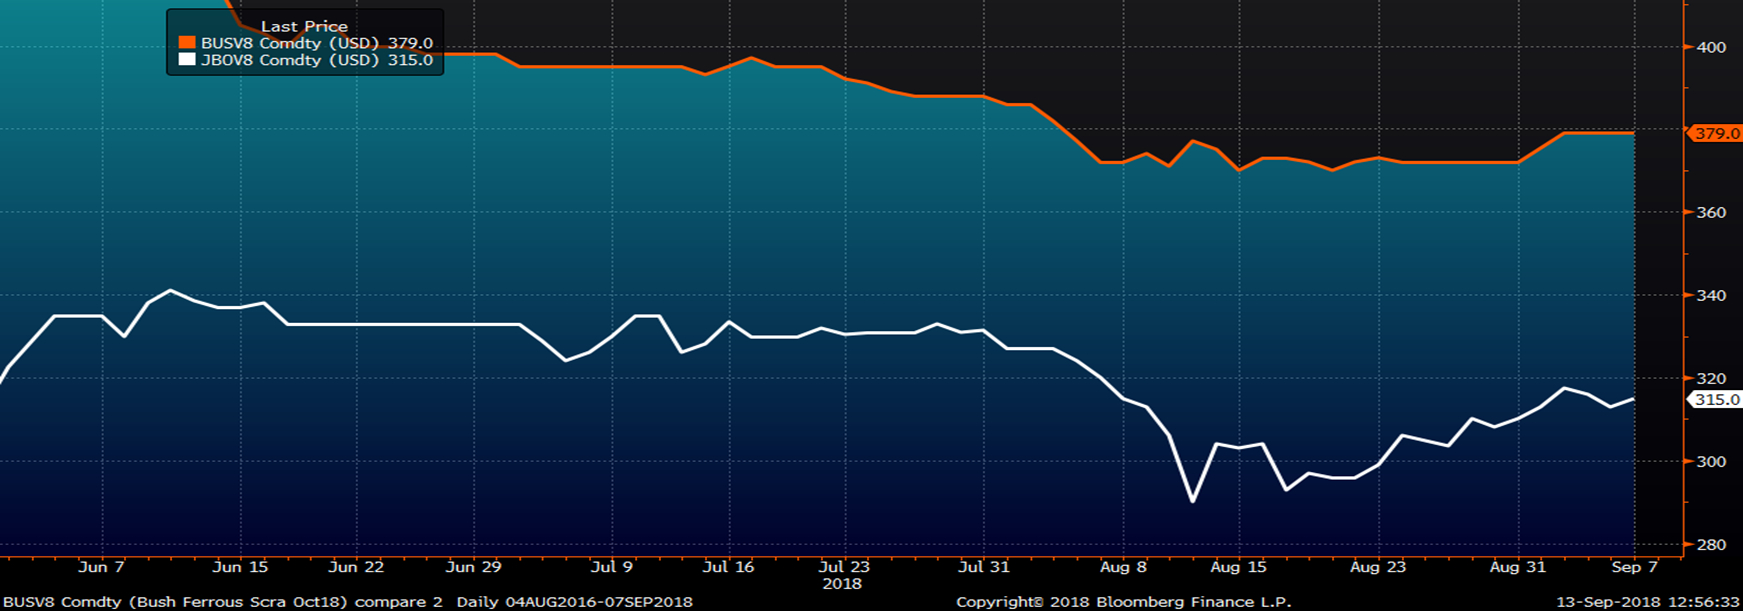
Scrap futures have rebounded since the Turkish financial market and currency scare in mid-august. The Turkish Scrap future ripped lower falling from $330/t to $290/t in early August. Since then it has rebounded, trading back to as high as $318 before settling today at $313. U.S. busheling was down in September, but hasn’t moved far in either direction for months.
October Busheling (orange) & Turkish Scrap Futures
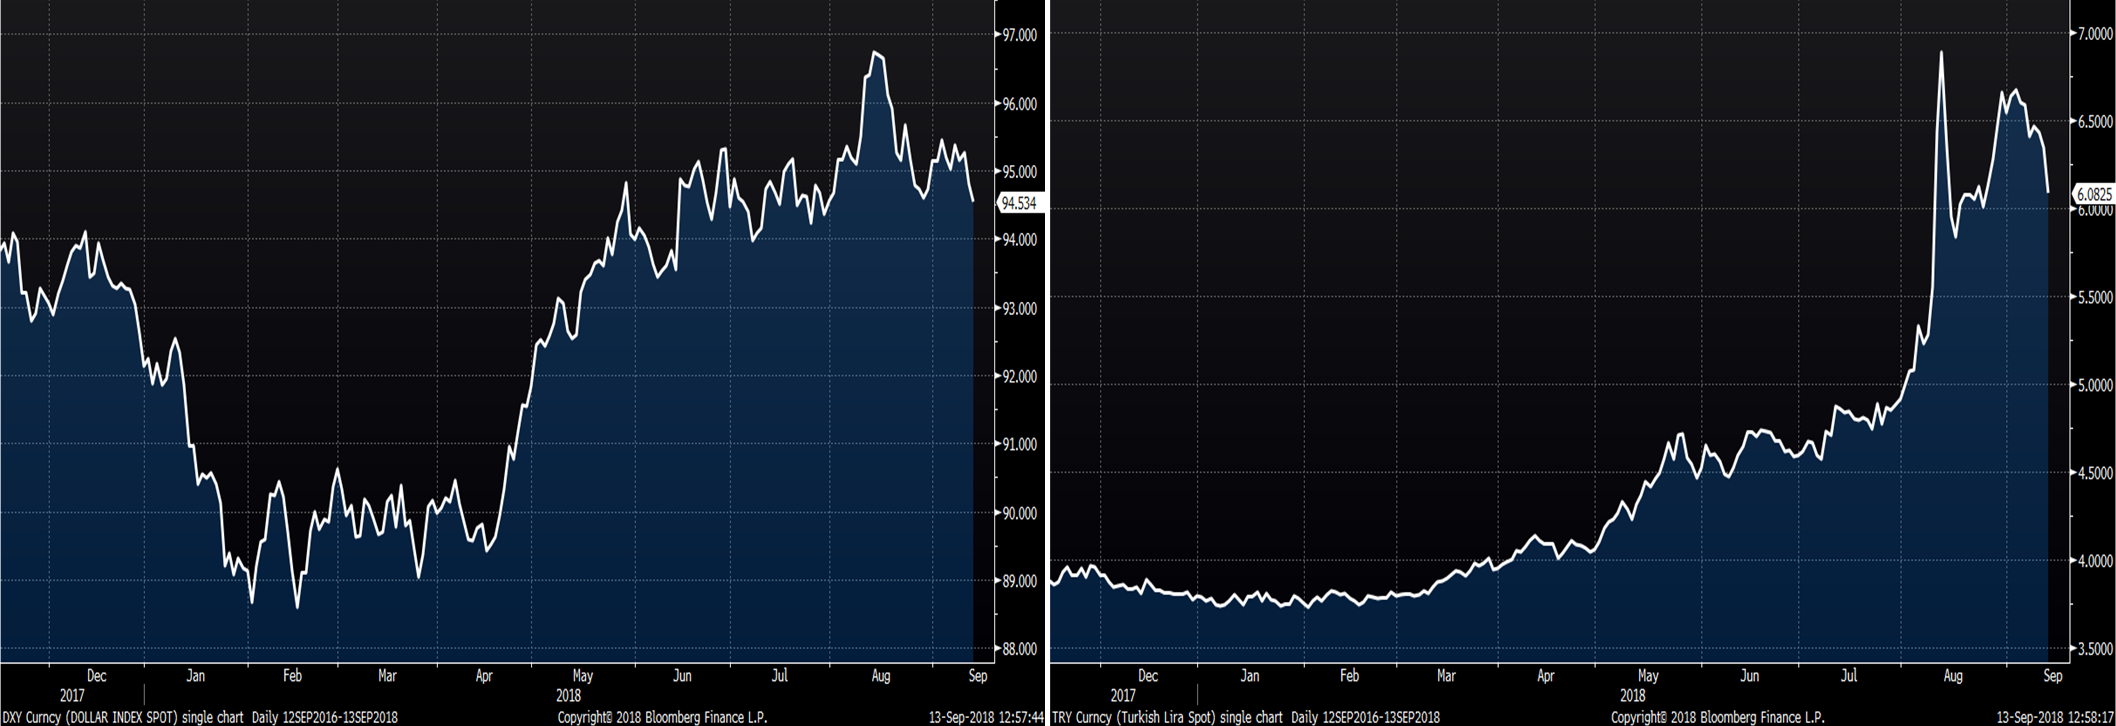
CPI data released today sent the U.S. Dollar Index to its lowest intraday level since July. A weaker U.S. dollar typically results in higher commodity prices. The Turkish central bank hiked rates to 24 percent today, which helped the currency improve to just above 6 lira to the dollar. Both developments have bullish implications for steel if they continue.
U.S. Dollar Index (left) & Turkish Lira (right)
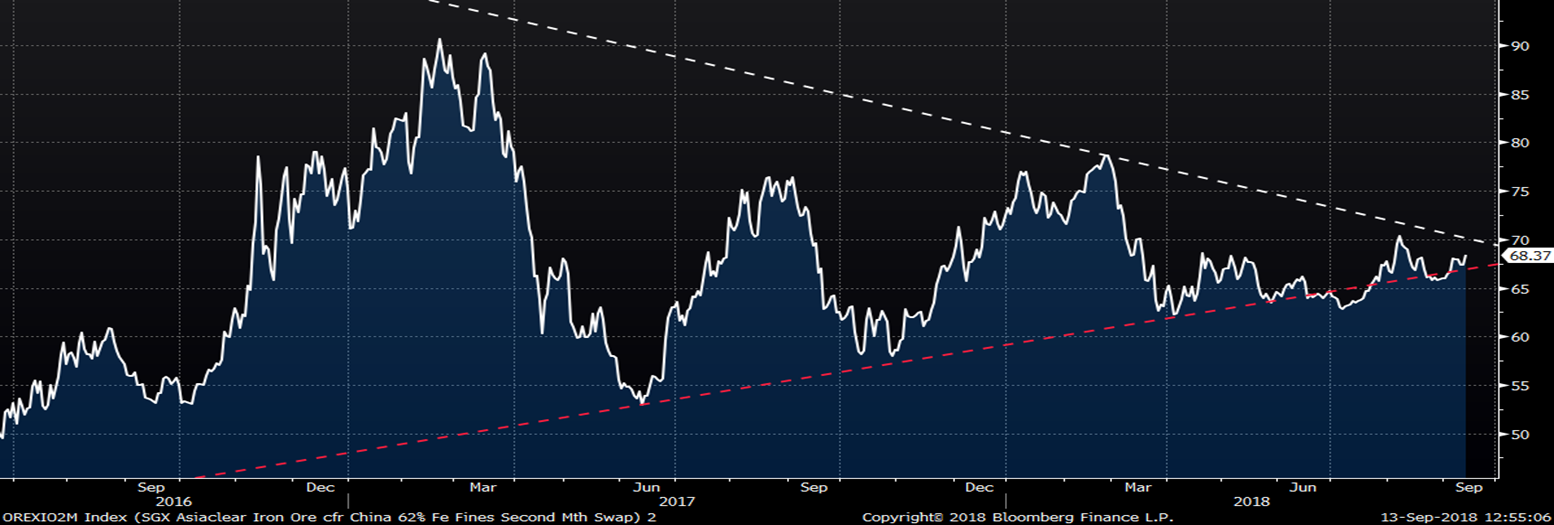
Iron ore continues to trade in a very tight range with October futures closing at $68.30/t.
2nd Month Iron Ore Future