

Market Data

August 17, 2018
New SMU Report Identifies CR Sheet Imports by Product Detail
Written by Peter Wright
Premium subscribers to Steel Market Update receive reports on imports broken down into district of entry and source nation. This new report from SMU takes the analysis to the product detail level. Our rationale is that the more information steel buyers have about the fine detail of what is coming into their region, the better job they can do of negotiating with suppliers.
Using U.S. International Trade Commission (USITC) data, SMU has taken the import tonnage of cold rolled sheet and broken it down into coil and leveled, then it breaks out four thickness ranges and identifies how much was full hard, annealed and high strength. Finally, this analysis is taken to the district of entry level. This report does not include strip. Total year-to-date sheet and strip imports through June were 797,483 and 21,863 metric tons, respectively.
Table 1 (click to enlarge) is a monthly summary through June and year-to-date 2018 showing gauge range and condition.
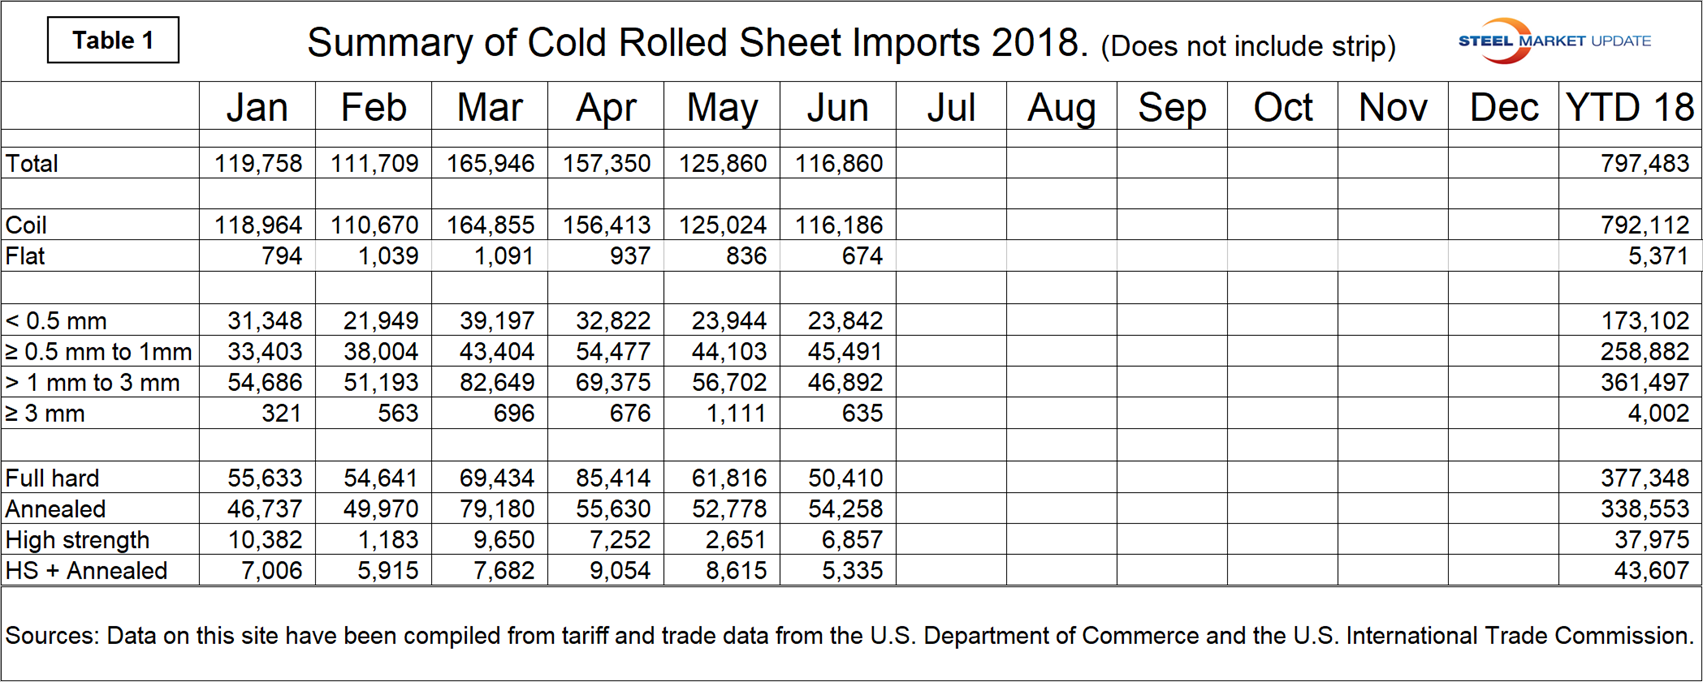
Figure 1 breaks the year-to-date cold rolled sheet tonnage down into the four gauge ranges that are identified in the HTS codes. Year-to-date in June, 21.7 percent was < 0.5 mm, 32.5 percent was ≥ 0.5 mm to 1.0 mm, 45.3 percent was >1.0 to 3.0 mm, and 0.5 percent was > 3.0 mm.
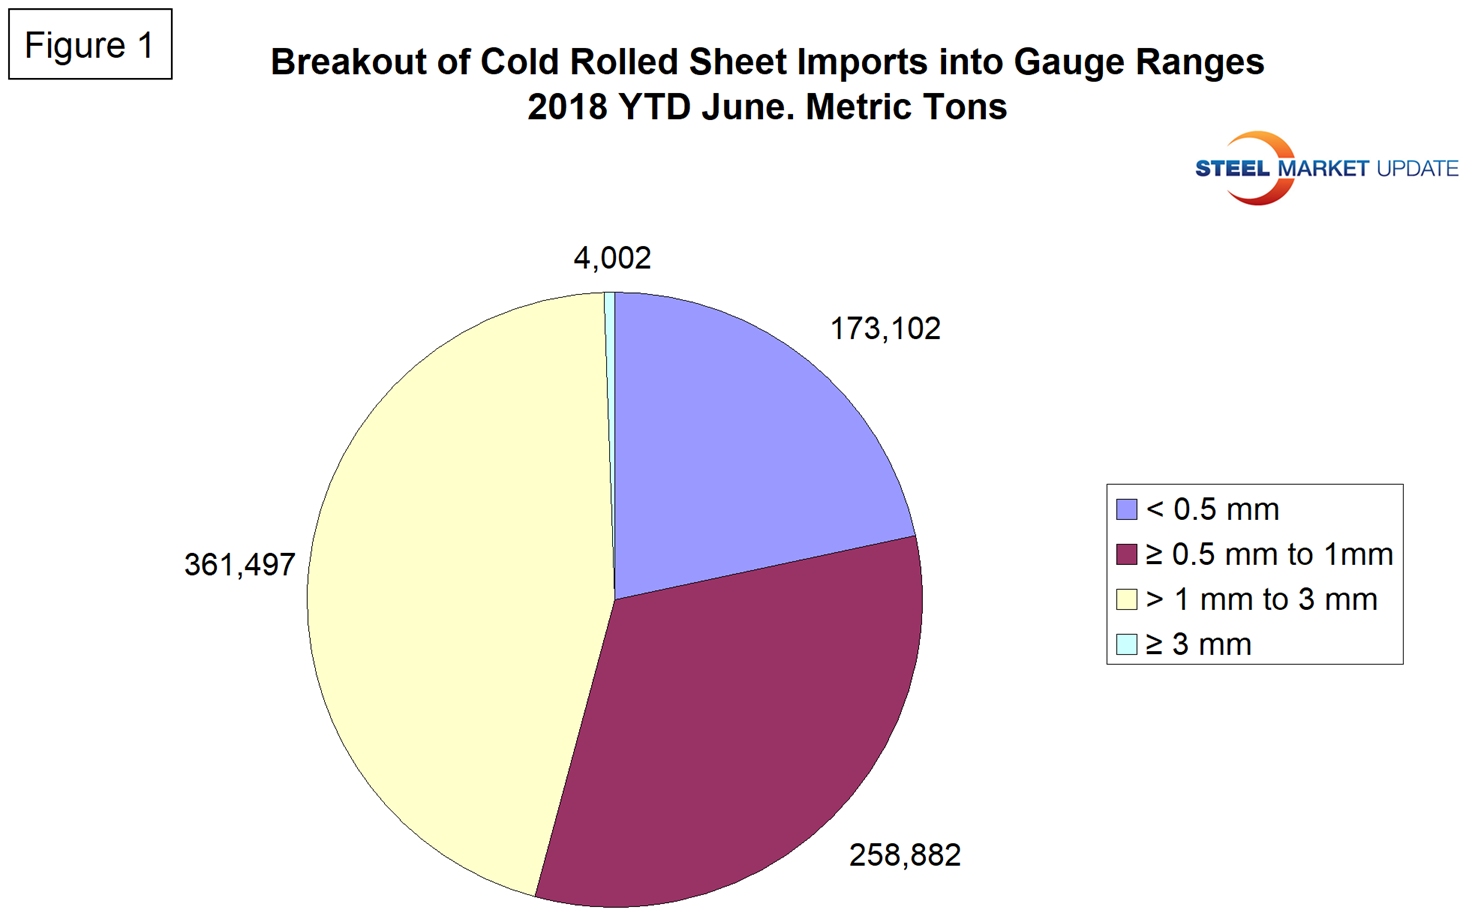
Figure 2 does the same thing for condition. It identifies the volume of full hard, annealed, high strength and high strength annealed. Year-to-date in June, 47.3 percent was full hard, 42.5 percent was annealed, 4.8 percent was high strength and 5.5 percent was high strength annealed.
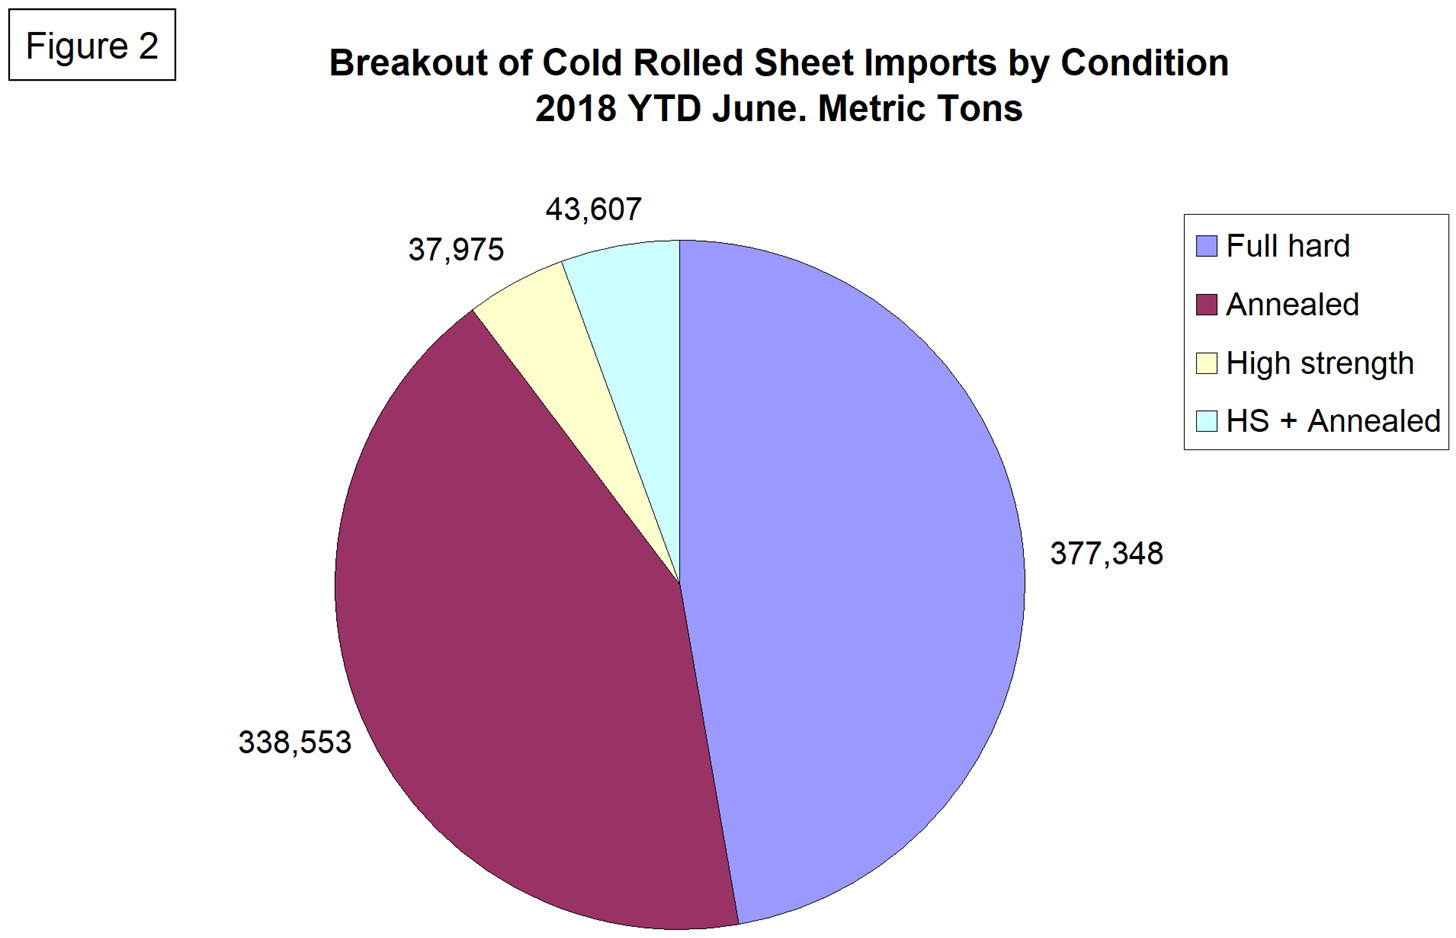
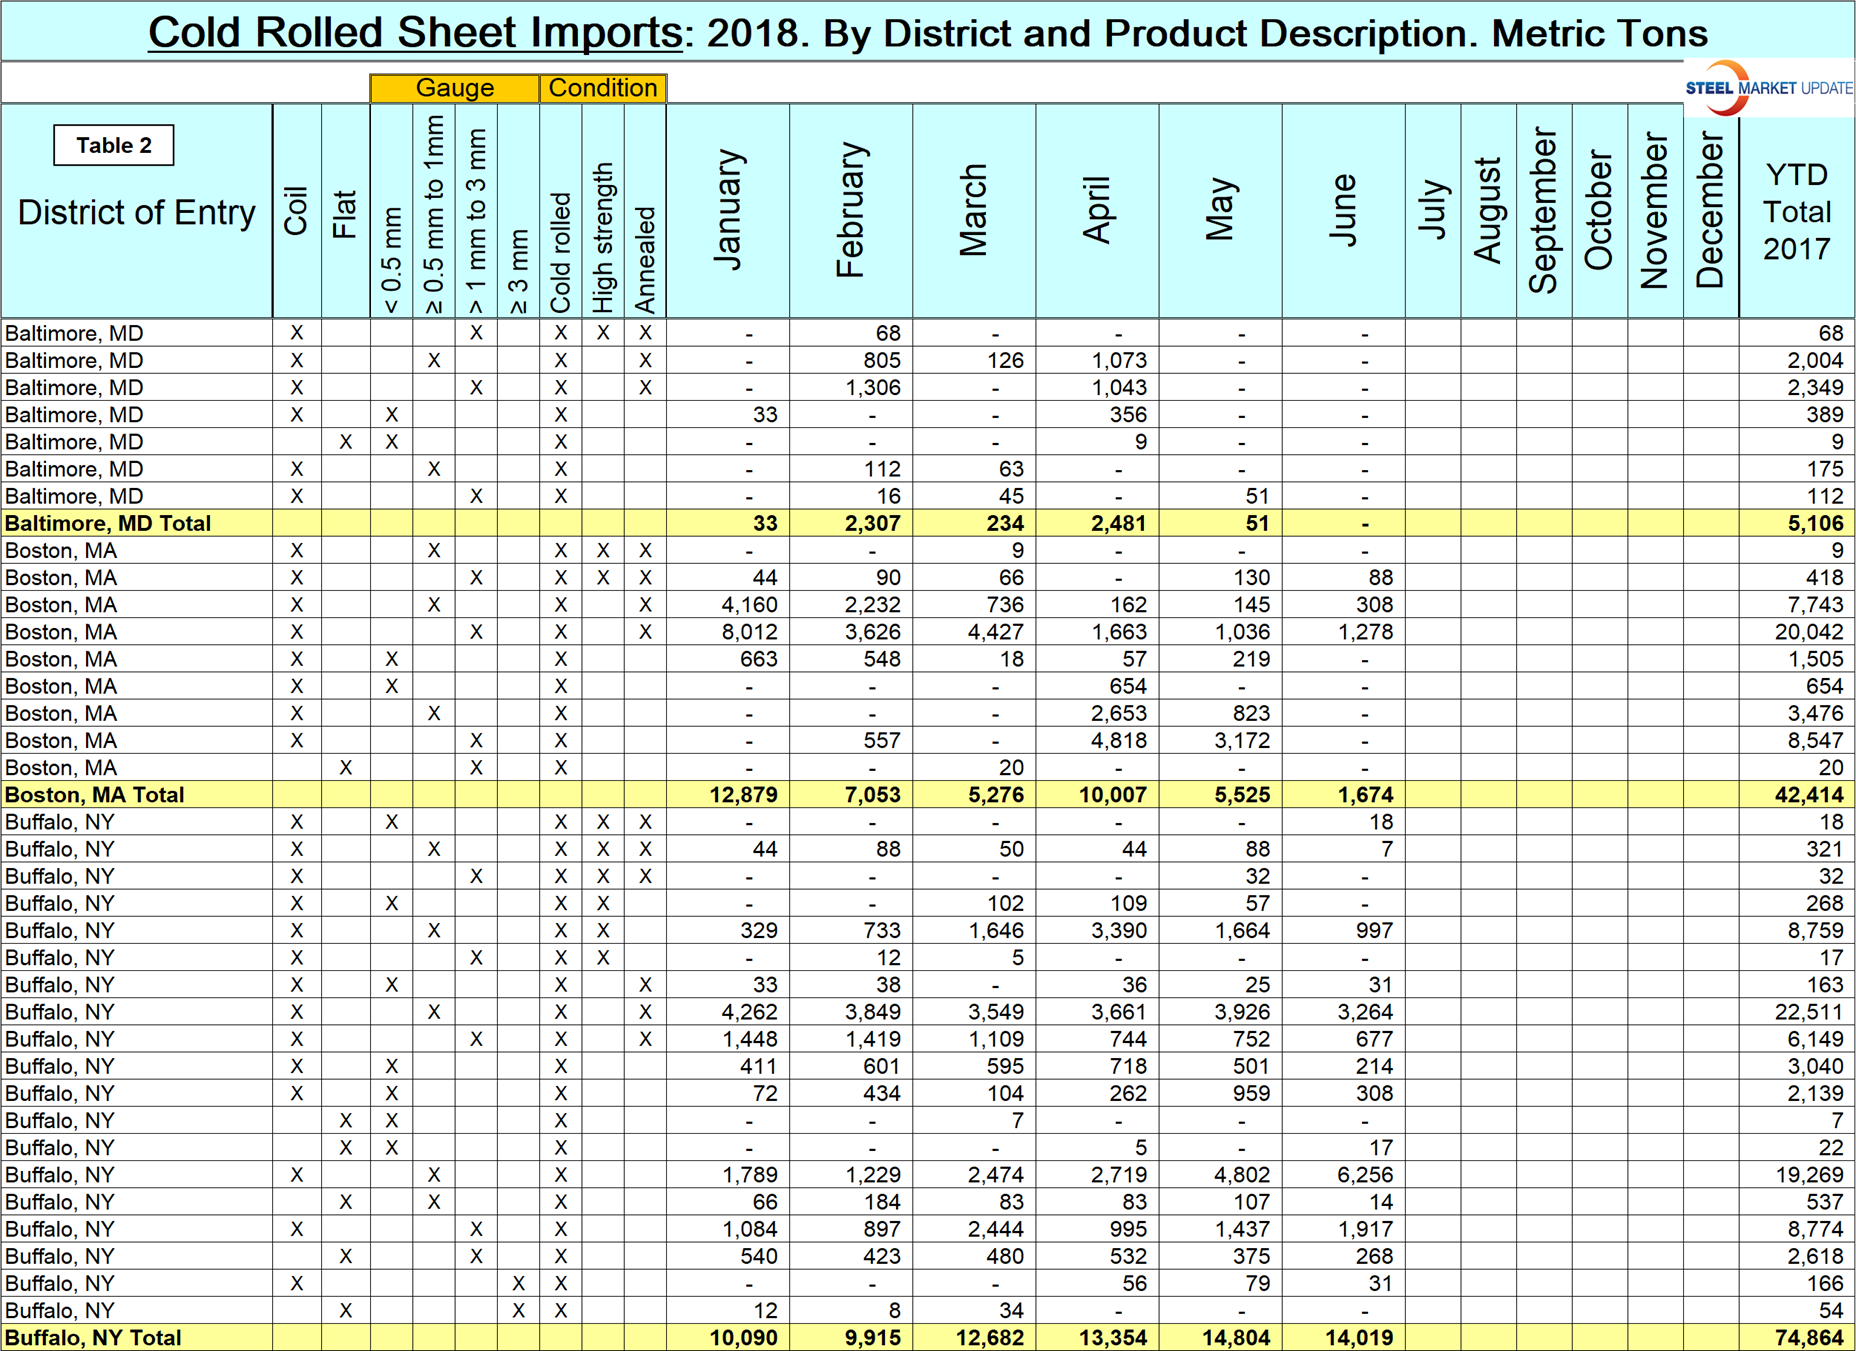
Table 2 (click to enlarge) is a small part of a sheet that shows detail for every region in the U.S. and is available here for premium SMU members. It shows the product detail of cold rolled sheet imports by district of entry. For example, almost half the tonnage entering Boston in the first six months of 2018 was 1 to 3 mm thick, annealed. Another example: if a steel buyer wanted to know how much of the same product came into Houston year to date, the answer is 21,275 tons, which was the highest volume item into that district.
Note: This data was accessed through the USITC database. All steel traded globally is classified by the Harmonized Tariff System (HTS). The HTS code has 10 digits. The first six are globally universal. The last four are used at the discretion of the nations involved in a particular transaction and are the basis of this report. The way the U.S. uses the last four digits to define products may be different from other nations’ product classification.


