Market Data

August 2, 2018
BEA: U.S. GDP Tops 4 Percent in Second Quarter
Written by Peter Wright
The U.S. economy grew at a 4.1 percent rate in the second quarter, up from 2.2 percent in the first quarter, according to the government’s first estimate of the gross domestic product. Growth of second-quarter GDP was the best since third-quarter 2014, and on a trailing 12-month basis has improved for the last eight quarters, according to Steel Market Update’s latest analysis.
The Bureau of Economic Analysis (BEA) has changed and backdated the base of their GDP calculation from chained 2009 dollars to chained 2012 dollars beginning with the Q2 2018 data. In addition to changing the base, the BEA made data revisions back to some time before 1970 when SMU’s data stream begins. This is vexing when we have to go back so far to keep our data accurate, but our take is that it illustrates the dedication to data integrity expressed by economists within the BEA. In contrast, we have never seen the revision of a single number put out by Chinese data providers even from one month to the next.
On July 3, the International Monetary Fund (IMF) published its Executive Board consultation with the United States. Its conclusions were as follows: “The near-term outlook for the U.S. economy is one of strong growth and job creation. Unemployment is near levels not seen in 50 years, and growth is set to accelerate, aided by a fiscal stimulus, a recovery of private investment and supportive financial conditions. These positive outturns have supported, and been reinforced by, a favorable external environment. The balance of evidence suggests that the U.S. economy is beyond full employment. A slow but steady rise in wage and price inflation is expected as labor and product markets tighten. Core PCE inflation is expected to rise modestly above 2 percent after mid-year. Wages have been growing broadly in line with (relatively weak) labor productivity growth, leaving unit labor costs virtually unchanged over the past two years. In the next several months, wages and unit labor costs are anticipated to increase at a modest pace. Despite good near-term prospects, a number of vulnerabilities are being built up. The planned expansion in the federal deficit at this stage of the cycle could trigger a faster-than-expected rise in inflation. That would be accompanied by a more rapid rise in interest rates that could increase market volatility both in the U.S. and abroad. There is a risk of a marked reversal of capital flows, particularly from emerging markets with weaker macroeconomic fundamentals. The net effect of U.S. budget and tax policy choices will exacerbate an already unsustainable upward dynamic in the public debt and leave few budget resources available to invest in a range of urgently needed supply-side reforms, including infrastructure spending. It will also contribute to a rise in global imbalances. These risks are added to by recent actions by the U.S. to impose tariffs on imports.”
GDP is now measured and reported in chained 2012 dollars, and on an annualized basis in the second quarter was $18.507 trillion. The growth calculation is misleading because it takes the quarter-over-quarter change and multiplies by 4 to get an annualized rate. This makes the high quarters higher and the low quarters lower. Figure 1 clearly shows this effect. The blue line is the trailing 12-months growth and the black line is the headline quarterly result. On a trailing 12-month basis, GDP was up by 2.85 percent in Q2, which was the best result since Q2 2015 and better than the 2.20 percent average in 34 quarters since Q1 2010. Therefore, we conclude that the current growth of U.S. GDP is better than its average for the last nine years. The blue line in Figure 1 shows the slow but steady progress of the trailing 12 month result since Q2 2016.
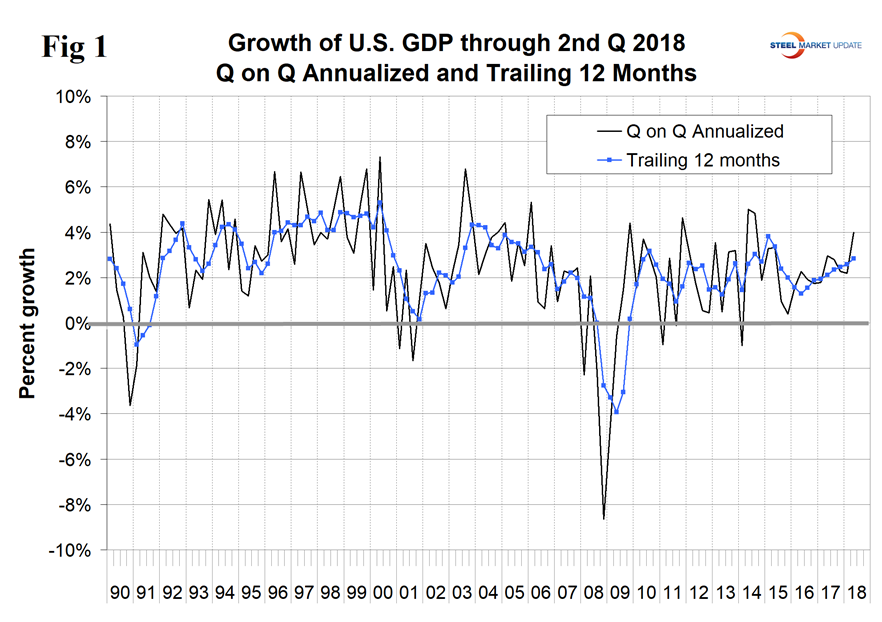
Figure 2 shows the headline quarterly results since 1990 and the April 2018 Congressional Budget Office forecast through 2022. The CBO forecasted a 3.5 percent growth rate in Q2 2018 and that 2018 as a whole gets a boost from the tax break before falling back in 2019. The IMF forecasts global and national economic growth each April and October. In the April update, the forecast of U.S. economic growth in 2018 was revised up for the years 2018 through 2020, then revised down for 2021 and 2022. The IMF growth forecast for 2018 was revised up from 2.3 percent to 2.9 percent, and the 2019 forecast was adjusted from 1.9 percent to 2.7 percent.
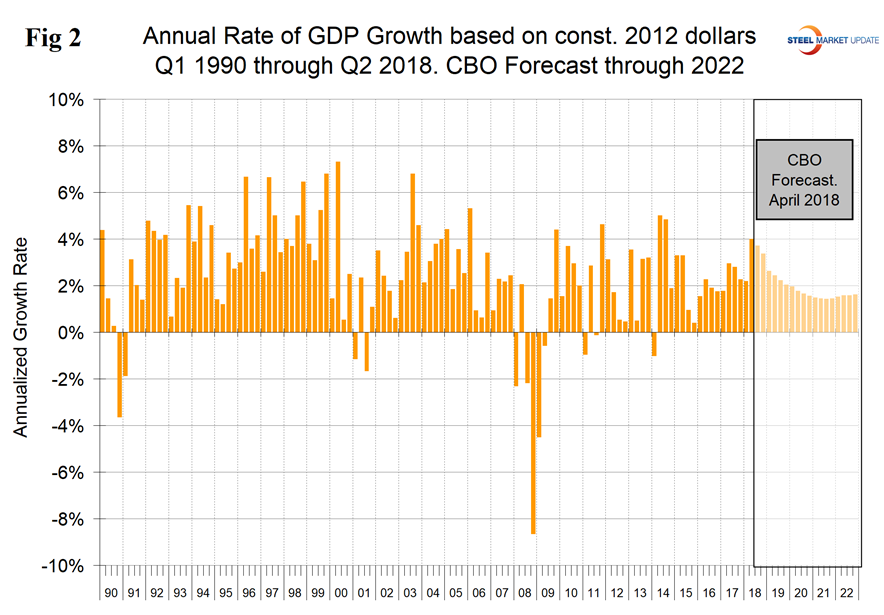
Figure 3 shows the change in the six major subcomponents of GDP in Q2 2018. Normally, personal consumption is the dominant growth driver and this was the case in the second quarter. Personal consumption includes goods and services, the goods portion of which includes both durable and non-durables. The contribution of inventories declined from positive 0.27 percent in Q1 2018 to negative 1.00 percent in Q2 2018. Rising inventories are entered as a positive in the GDP calculation. Note that in the definitions at the end of this piece, inventories are not mentioned. Over the long run, inventory changes are a wash and simply move growth from one period to another. In Q2, the contributions of inventories and net exports did almost an equal and opposite reversal. In Q1, net exports contributed negative 0.02 percent, flipping to positive 1.06 percent in Q2. The contribution of government expenditures was positive 0.37 percent in the second quarter.
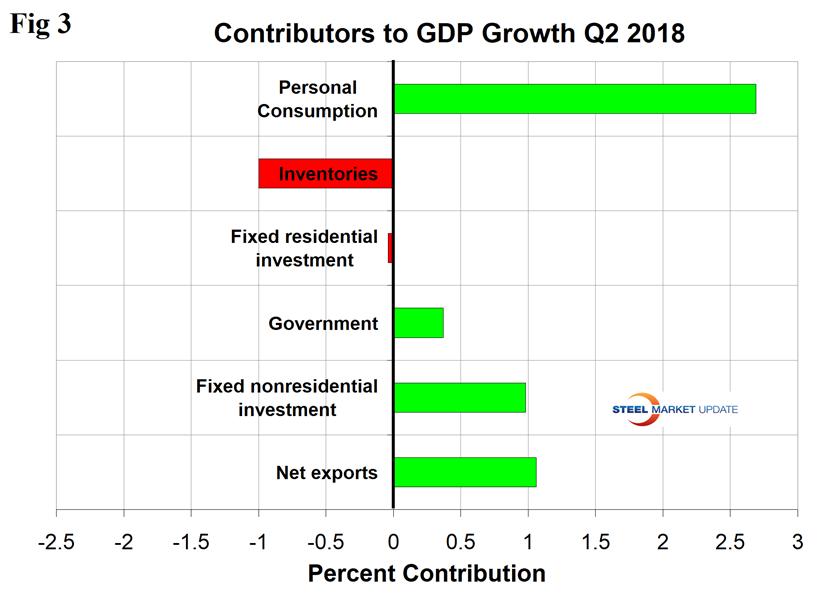
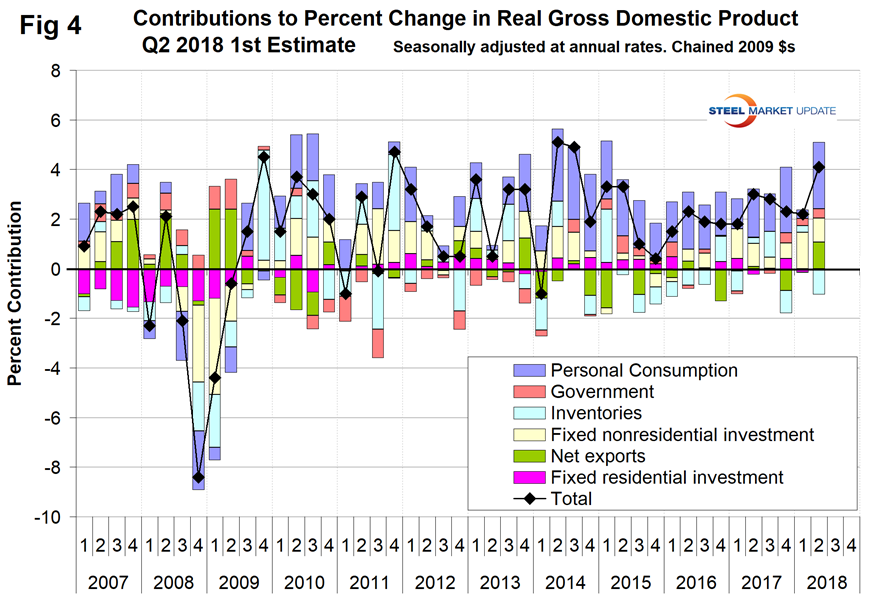
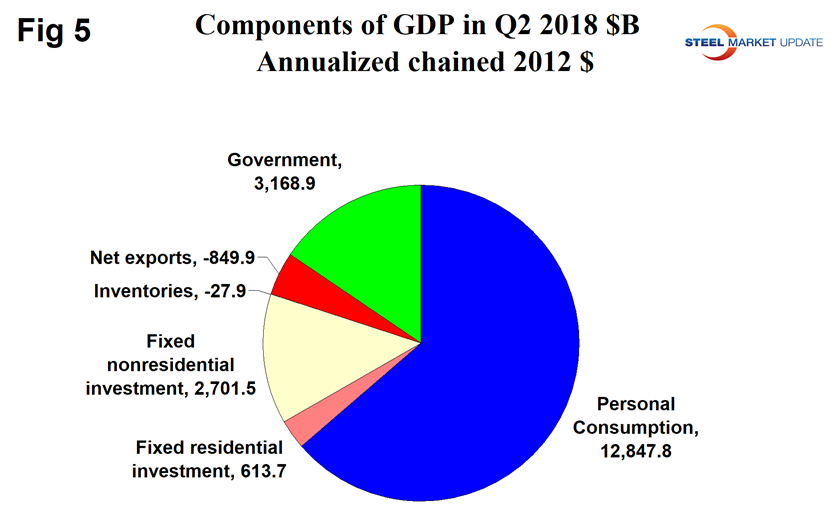
Figure 4 shows the quarterly contributors of the six major subcomponents of GDP since Q1 2007. This chart clearly shows the whipsaw effect of inventory changes. Figure 5 shows the breakdown of the $18 trillion economy.
SMU Comment: This was an excellent result and exceeded the CBO forecast of a 3.5 percent increase. We should expect a decline in the growth of GDP every quarter from now until Q3 2021 if the CBO forecast is correct. The trailing 12-month growth rate has improved for each of the last eight quarters and in Q2 reached 2.85 percent. We think this is a more valid measure of how the economy is really progressing than the headline number. However, the trailing 12-month result is high enough to stimulate future steel consumption, which requires about a 2.2 percent growth to break even.
Definition of GDP: Gross domestic product (GDP) is the value of the goods and services produced by the nation’s economy less the value of the goods and services used up in production.
GDP is defined as Consumption (C) plus Investment (I) plus Government Spending (G) plus [Exports (E) minus Imports (I)] or: GDP = C + I + G + (E-I)
National savings is GDP minus (consumption plus government spending). That means that investment equals savings plus net exports. If there are no net exports, then money must come back into the U.S. from outside the country to finance investments, along with savings. Thus, if there is a government deficit, there must be savings by both consumers and businesses, plus capital flows from outside the country, to offset that deficit in order for there to be any money left over for investments.
Another definition of GDP states that it equals the growth in working population multiplied by their productivity.


