Prices

July 26, 2018
HRC Futures: Backwardation -- “A Gift or a Shift in Fundamentals?”
Written by Gaurav Chhibbar
Gaurav Chhibbar is a partner at Metal Edge Partners, a firm engaged in Risk Management and Strategic Advisory. In this new role, he and his firm design and execute risk management strategy for clients along with providing process and analytical support.
In Gaurav’s previous role, he was a Trader at Cargill spending time in Metal and Freight markets in Singapore before moving to the U.S. He can be reached at Gaurav@MetalEdgePartners.com for queries/comments/questions.
Many in the industry are looking around perplexed. At best, an efficient business can handle economic uncertainty. The changes in demand and supply driven by economic factors can be modeled, and while imprecise, these models can help business managers to design a playbook for different scenarios. The steel market today gives no such advantage to the well reasoned. Many are trying to plan for not just economic but also political uncertainty.
The futures market is another arena offering an opportunity to gauge the expectations of those trading. The shape of the HRC futures remains backwardated with the 3rd month contract trading at low-mid 820’s in the past week. The chart below shows how relative to the front month HRC contract, the 3rd month futures have traded. The bottom chart shows the extent of the difference between the CME HRC Contract three months-out to the spot month. A negative number (periods of red) represents backwardation in that period, while a green zone highlights the 3rd month trading at a premium to spot.

The end of the first quarter of 2018 saw the futures market come under pressure as players expected the administration to allow for exemptions, and allowances to be in place, effectively betting that the high spot prices were not sustainable. As we came closer to the deadlines set by the DoC, some participants realized that not only will there not be loopholes in the tariff regime, but also the unexpected tariffs against NAFTA and EU eventually drove cash (physical) prices higher. The curve reacted by reducing some of the backwardation as we moved towards late May-early June.
The current pressure from the sellers, however, stems from expectations of additional supply. This aggressive backwardation has left importers with smaller margins to ‘lock-in’ and reduced the ability of the inventory holders to off-load risk. The buyers of the discounted futures who have benefited thus far in 2018 have once again to assess if indeed the bearishness of the sellers is a gift or a shift in fundamentals?

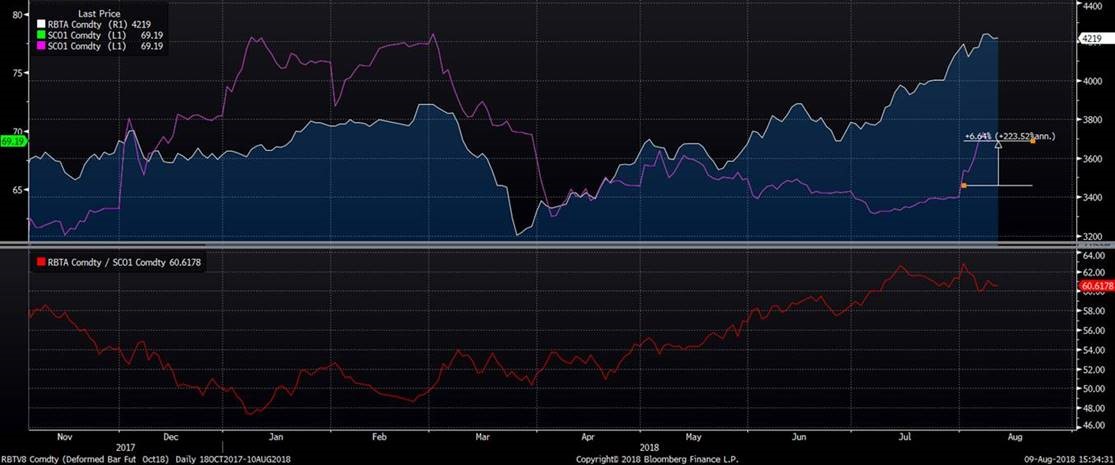
As market players assess the gyrations of the HRC futures, the international markets are seeing support as Iron Ore indices moved up. The headline grabbing drop in the Chinese steel export number was seen as a positive by many. The fewer exports come in the backdrop of multi-year margin highs for Chinese steel mills. The chart below shows the continued rise of the rebar price (white line) in China compared with the Iron Ore prices, which have gained over 6.5 percent since the beginning of August. As a result of the Iron Ore price increase, the ratio (red line) has come off the recent highs.

It is interesting to note that as ratio of the international TSI Iron Ore number vs. U.S. HRC is currently trading at ~13.0x.

The same ratio if calculated comparing the U.S. HRC forward curve to the forward curve of Iron Ore shows an aggressive drop to sub 11.50x TSI Iron Ore price (white line)

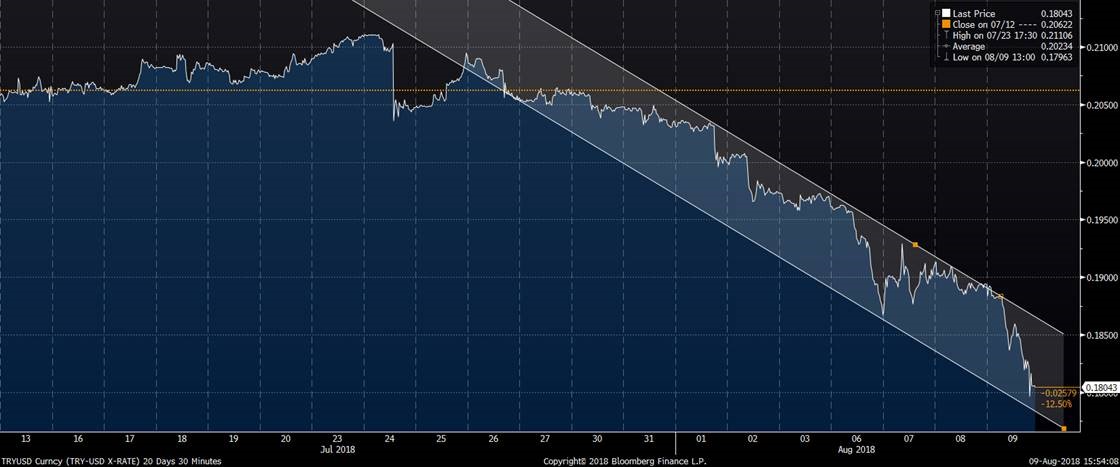
The support for Ore comes at the same time as pressure on Scrap. Turkish mills struggle in an environment of a fast depreciating Turkish Lira. The ability for the Turkish mills to pay higher for dollar denominated scrap erodes as the domestic currency weakens with the latest CFR Turkey HMS transactions being reported in low $320’s. This also, however, implies that exports from Turkey can be more aggressive as the pay-off in the domestic currency is higher due to the TRYUSD movement–a factor that sellers of the U.S. HRC futures expect will eventually drive HRC prices lower.

Disclaimer: The information in this write-up does not constitute “investment service,” “investment advice,”,or “financial product advice” as defined by laws and/or regulations in any jurisdiction. Neither does it constitute nor should it be considered as any form of financial opinion or recommendation. The views expressed in the above article by Metal Edge Partners are subject to change based on market and other conditions. The information given above must be independently verified and Metal Edge Partners does not assume responsibility for the accuracy of the information.


