

Prices

July 26, 2018
Futures: A ‘Tail’ of Fear
Written by Gaurav Chhibbar
Gaurav Chhibbar is a partner at Metal Edge Partners, a firm engaged in Risk Management and Strategic Advisory. In this new role, he and his firm design and execute risk management strategy for clients along with providing process and analytical support. In Gaurav’s previous role, he was a trader at Cargill spending time in metal and freight markets in Singapore before moving to the U.S. He can be reached at gaurav@metaledgepartners.com for queries/comments/questions.
This market is handing nearly a $100 discount between the front month (Aug’18) and six months out (Feb’19). With the spot month trading at below the benchmark index, it represents the view of those selling that the index will be under pressure going into August. The backwardation itself, while steep, has presented some interesting calendar spread possibilities for those with the view that the difference between any two time buckets will compress or expand. A calendar spread involves a parallel buy and sell of futures with different expiration dates. These can come in very handy when managing or shifting risk across different parts of the curve.

The probable explanation for the backwardation in the HRC curve is the expectation for a negative impact on spot pricing from projected additional supply as domestic capacity restarts and imports flow in.
However, the robust domestic demand outlook and interest from buyers to lock in discounts has ensured buying along the curve, resulting in a strong boost to liquidity. Last week, the market saw over 72,000 tons traded on the exchange. This volume does not include the OTC transactions, which would push the number of tons transacted even higher. The volumes this week have been steady with Q4 being under pressure, reflecting the fears of the abovementioned additional supply. Interestingly, the HRC contract, which in the past often traded in spurts, is now seeing consistent market participation.
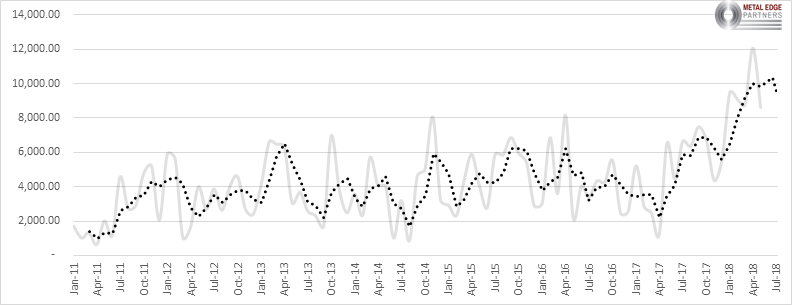
Monthly volumes viewed at a daily pace in the chart below highlight the increased liquidity in the HRC market. (The dotted line is a 3MMA of the average daily exchange traded pace.)
Mill margins on the curve look superbly attractive relative to marginal cost of production. The mills of course will have an opportunity to lock >$400 margins vs scrap looking out as far as Q1’19 if they can find willing sellers for scrap on the BUS contract. The chart below shows the spread between futures’ settlement prices from the CME on July 26th. The BUS traded small volumes last week and as such is seeing strong tire kicking from interested participants.

Disclaimer: The information in this write-up does not constitute “investment service,” “investment advice” or “financial product advice” as defined by laws and/or regulations in any jurisdiction. Neither does it constitute nor should be considered as any form of financial opinion or recommendation. The views expressed in the above article by Metal Edge Partners are subject to change based on market and other conditions. The information given above must be independently verified and Metal Edge Partners does not assume responsibility for the accuracy of the information.


