

Market Data

July 16, 2018
SMU Currency Analysis: Value of U.S. Dollar Surges
Written by Peter Wright
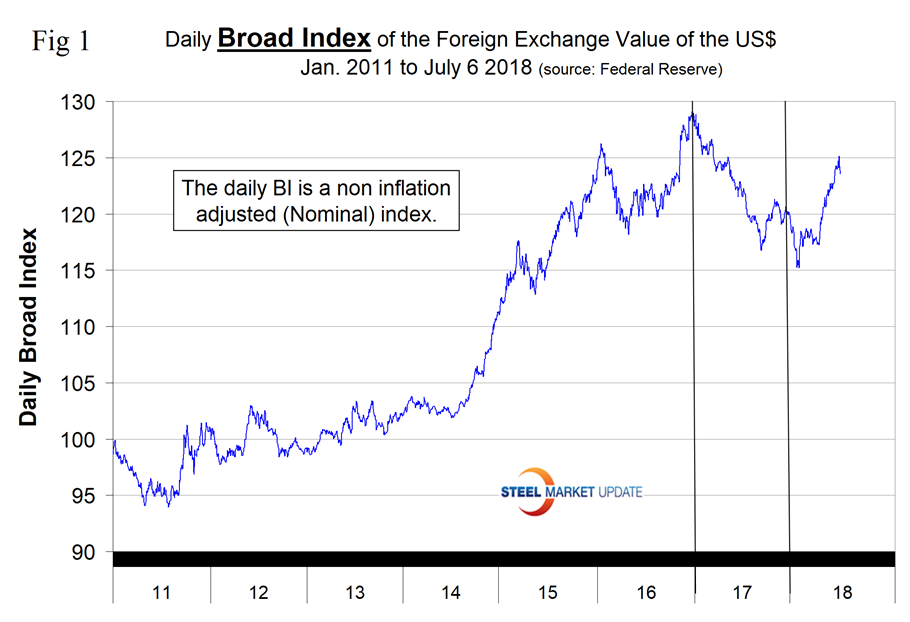
The U.S. dollar is continuing to surge. Through July 6, the strength of the dollar was up by 5.7 percent in three months and by 1.1 percent in the previous 30 days. (See the end of this report for an explanation of data sources.)
The Broad Index value of the U.S. dollar is reported several days in arrears by the Federal Reserve; the latest value published was for July 6. Figure 1 shows the index value since January 2011. The dollar had a recent peak of 128.96 on Jan. 3, 2017, which was the highest value in almost 15 years; the recent low point was Feb. 1, 2018, at 115.21. On July 6, the dollar had recovered to 123.55
Each month, Steel Market Update publishes an update of Table 1, which shows the value of the U.S. dollar against the currencies of 16 major global steel and iron ore trading nations. The table shows the change in value in one year, three months, one month and seven days through July 14. Currencies that the dollar strengthened against are color coded in red. Green indicates currencies that strengthened against the U.S. dollar.
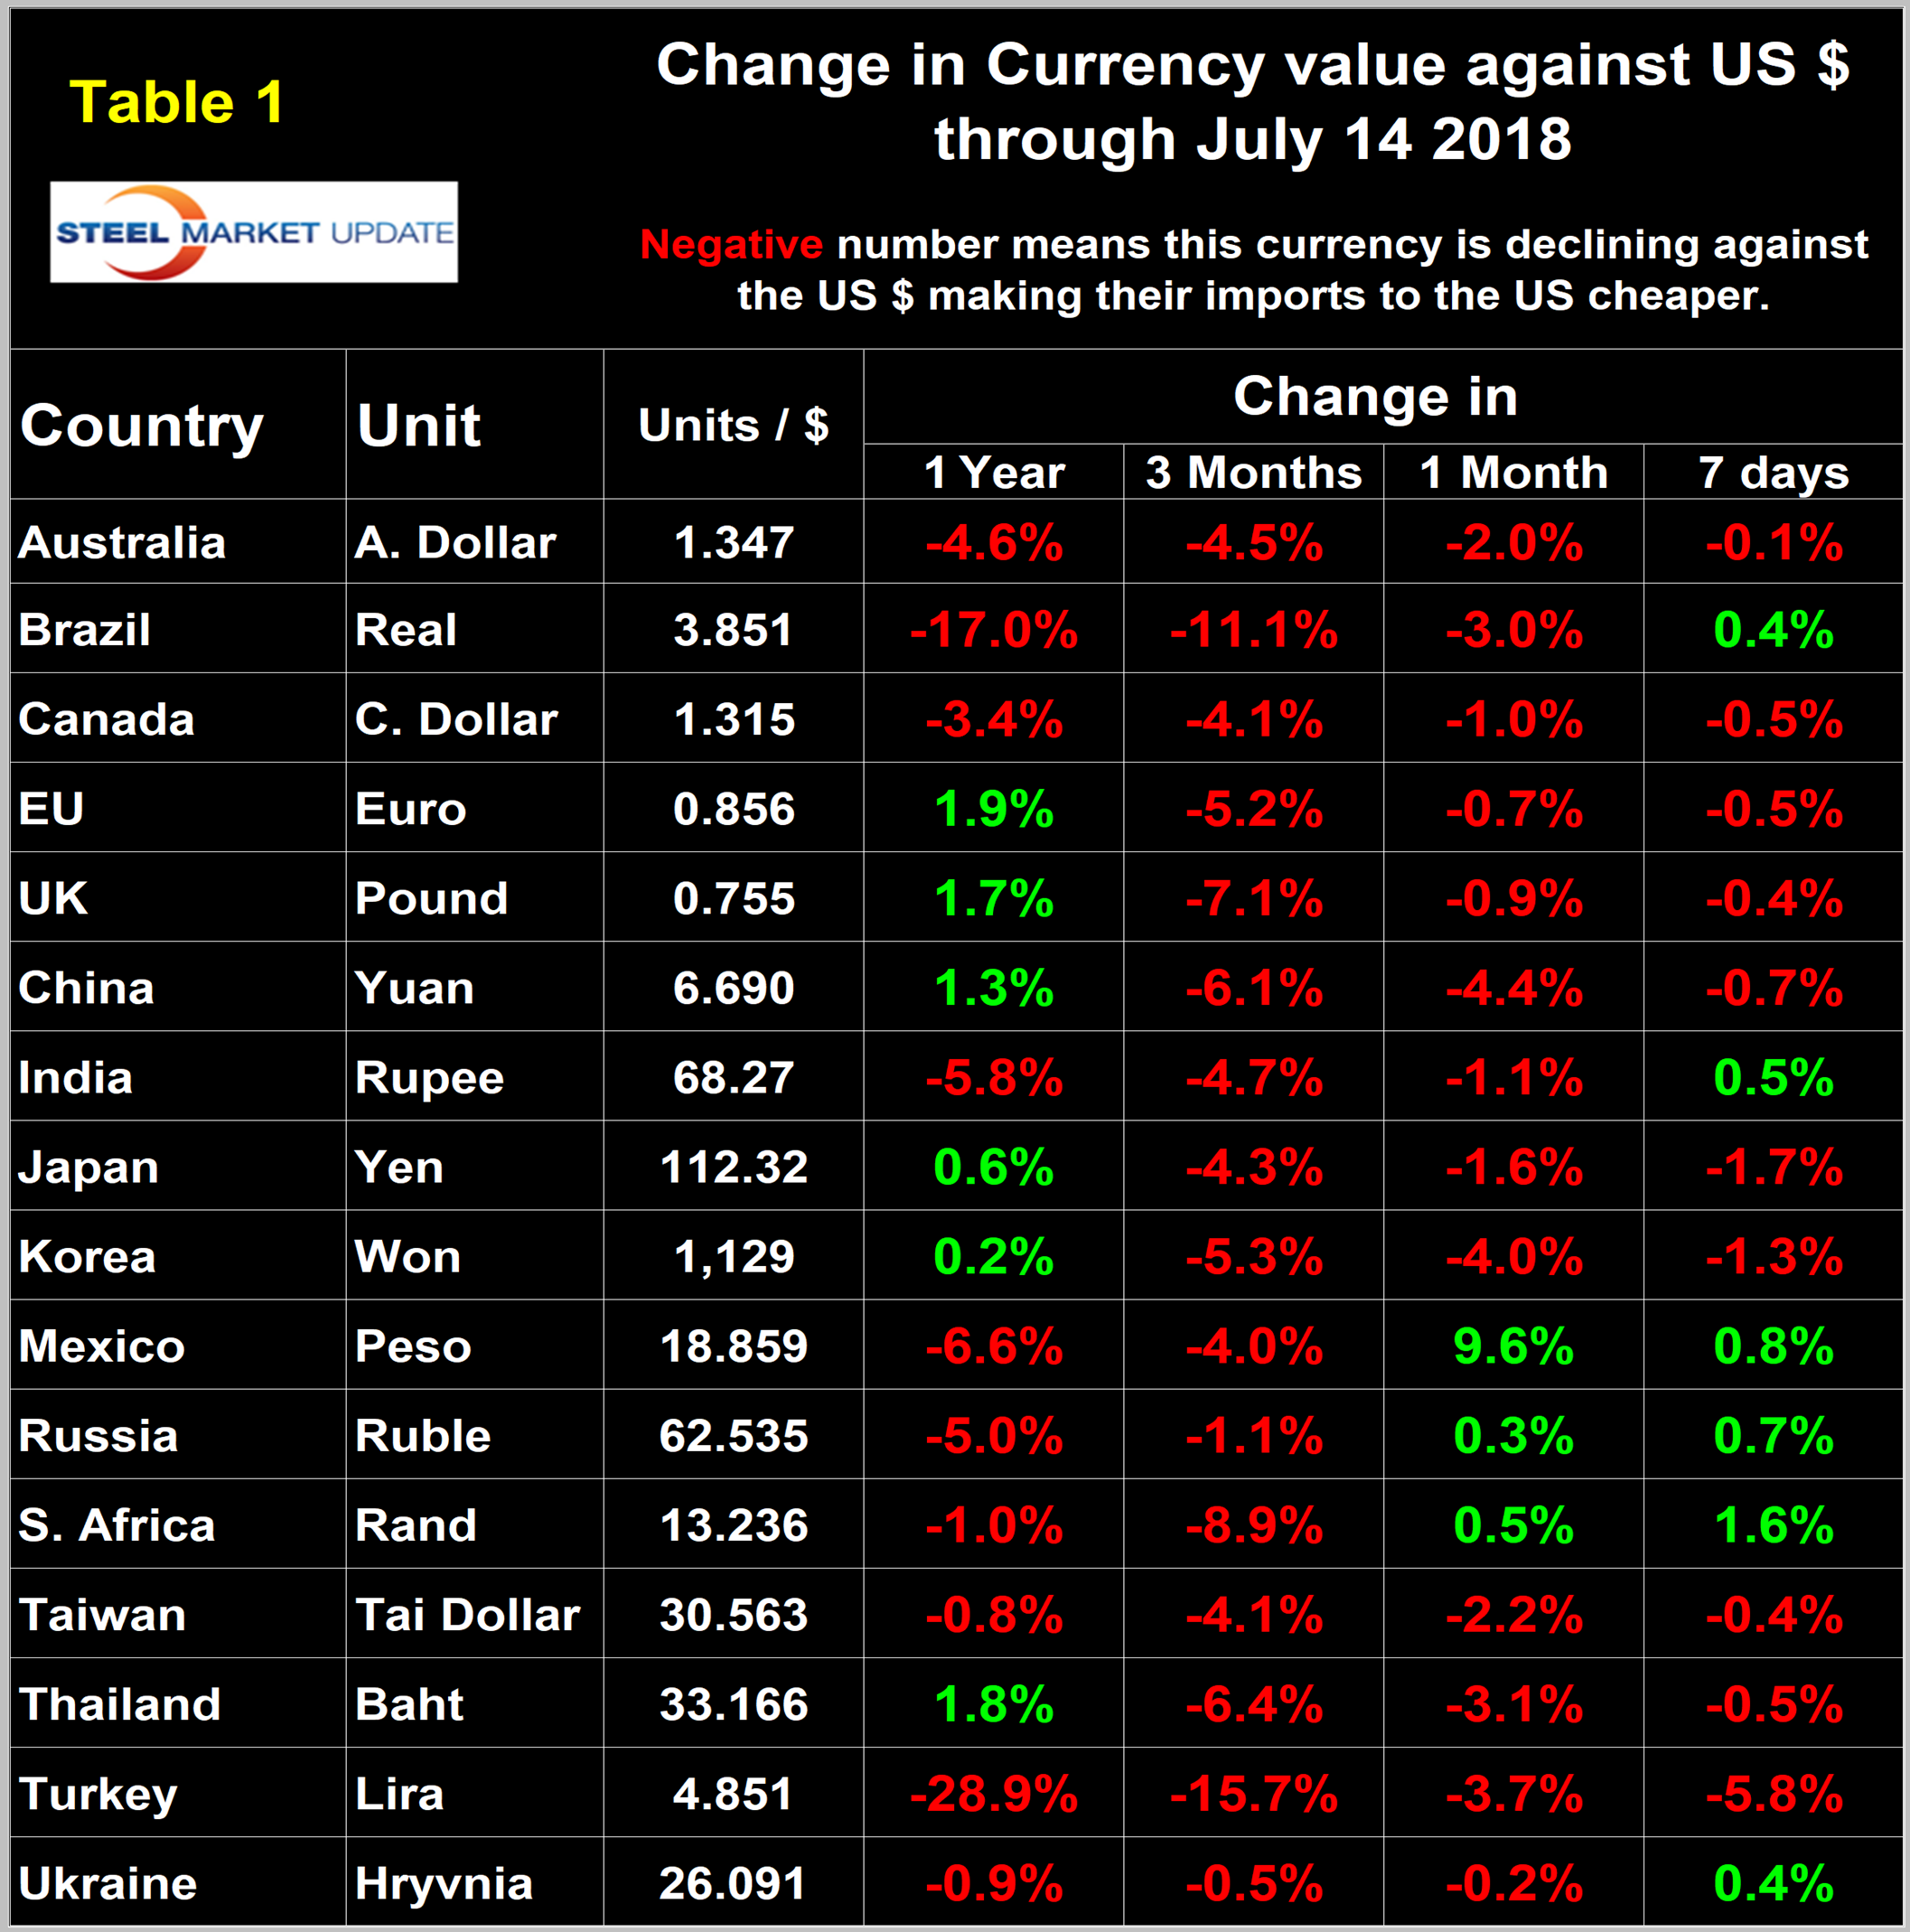
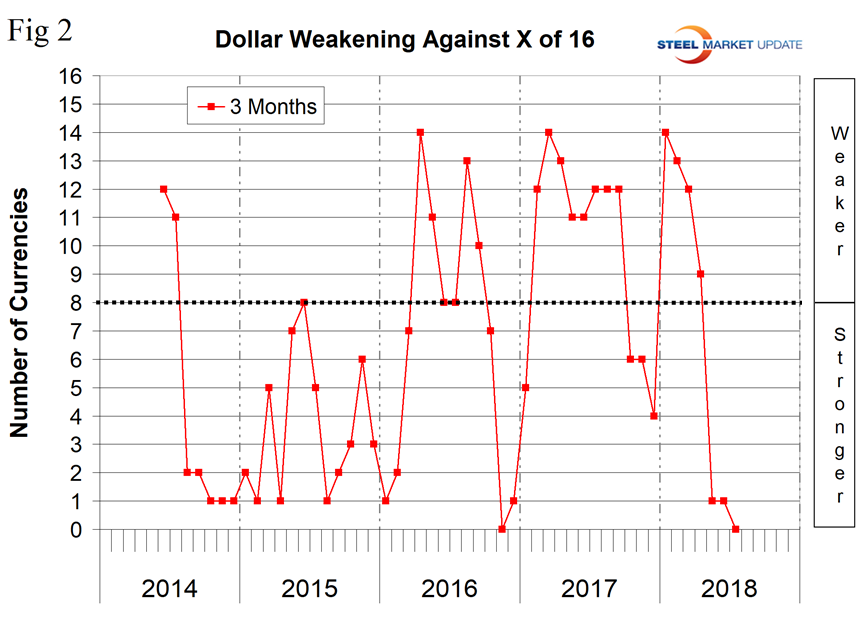
Figure 2 gives a longer-range perspective and shows the extreme gyrations that have occurred in the last three years. The dollar strengthened against every one of the 16 currencies in the last three months and against 13 in the last month. Quite often the change in value of these 16 currencies does not accord with the broad index, but this is not one of those times.
A falling dollar puts upward pressure on all commodity prices that are greenback denominated. We regard strengthening of the U.S. dollar as negative and weakening as positive because of the effect on the trade balance of all commodities and on the total national trade deficit.
In each of these reports, we comment on several of the 16 steel and iron ore trading currencies listed in Table 1 and over a period of several months will describe the history of all of them. Charts for each of the 16 currencies through June 24 are available for any premium subscriber who requests them.
The Euro
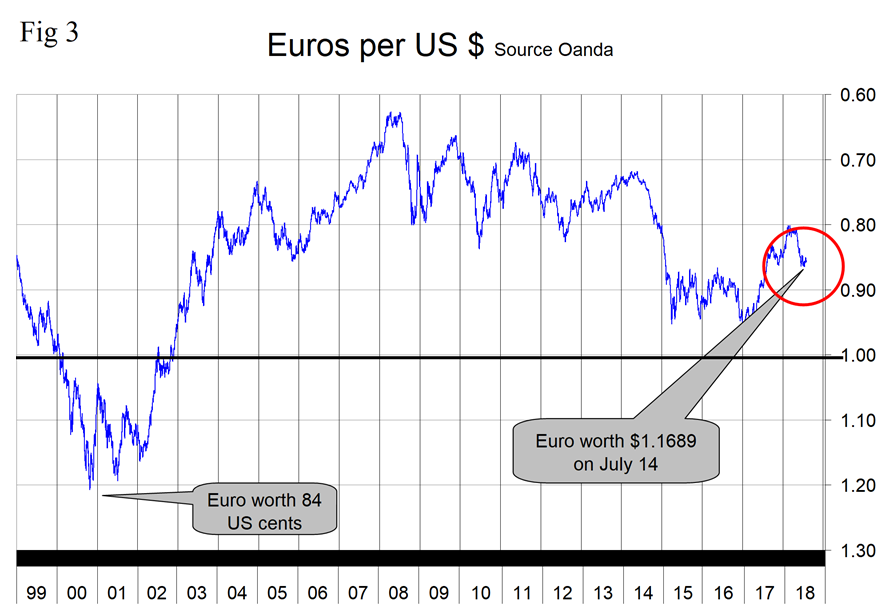
The euro has weakened by 5.2 percent in three months and by 0.7 percent in one month. On July 14, the euro had a value of 1.1689 U.S. dollars. Of the top 20 steel importing nations into the U.S., seven were members of the EU. In order, these were Germany, Italy, the Netherlands, Spain, France, Austria and the UK. Together, these nations have shipped slightly less than two million tons to the U.S. year to date, which was 10.6 percent of the total (Figure 3).
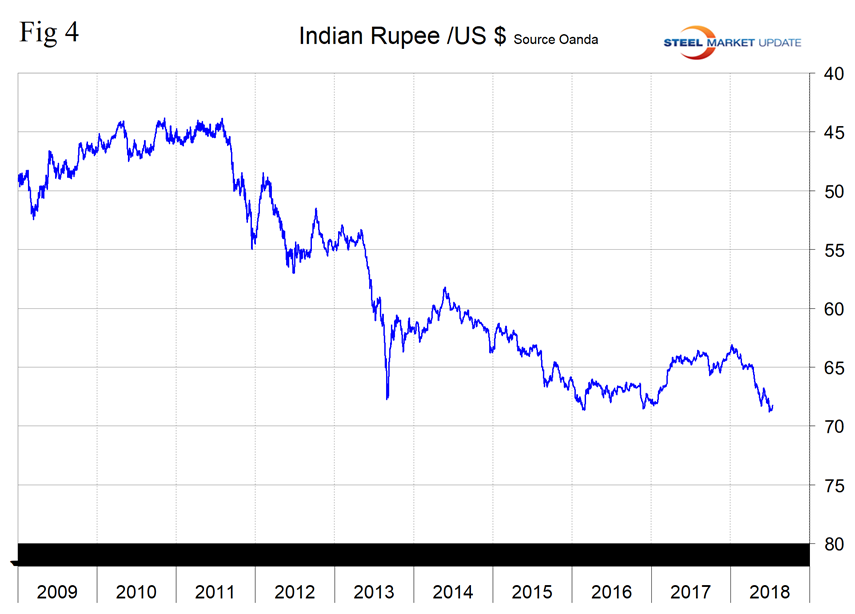
The Indian Rupee
India’s rupee has weakened by 4.7 percent in three months and by 1.1 percent in one month. India has shipped 232,000 tons into the U.S. year to date. Counting the EU as one source, that puts India in 12th place (Figure 4).
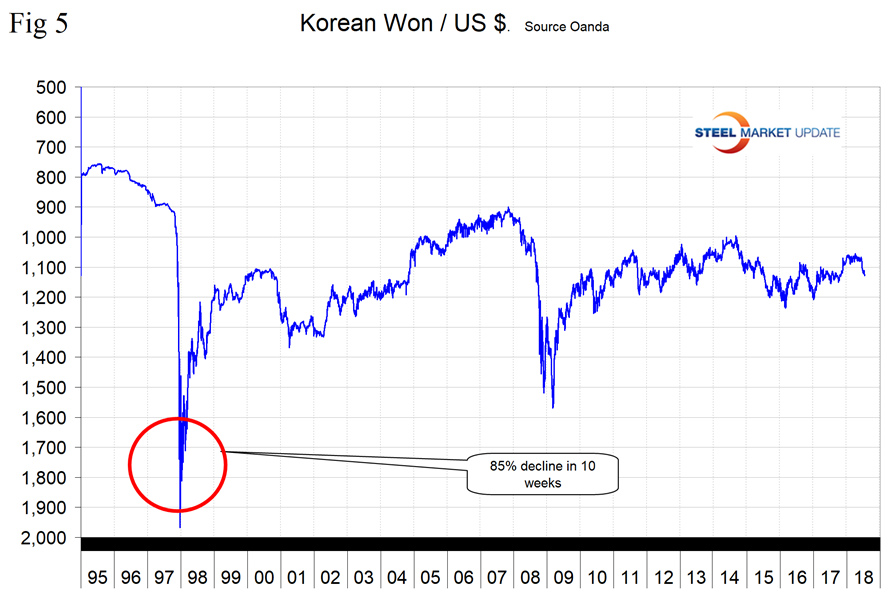
The Korean Won
Korea’s won has declined by 5.3 percent against the dollar in three months, of which 4.0 percent occurred in the last month. So far in 2018, Korea has shipped 1.7 million tons into the U.S., putting them in fourth place (Figure 5).
The Ukrainian Hryvnia
Ukraine’s hryvnia has declined by 0.5 percent in three months and by 0.2 percent in one month. Ukraine has shipped 100,000 tons into the U.S. this year (Figure 6).
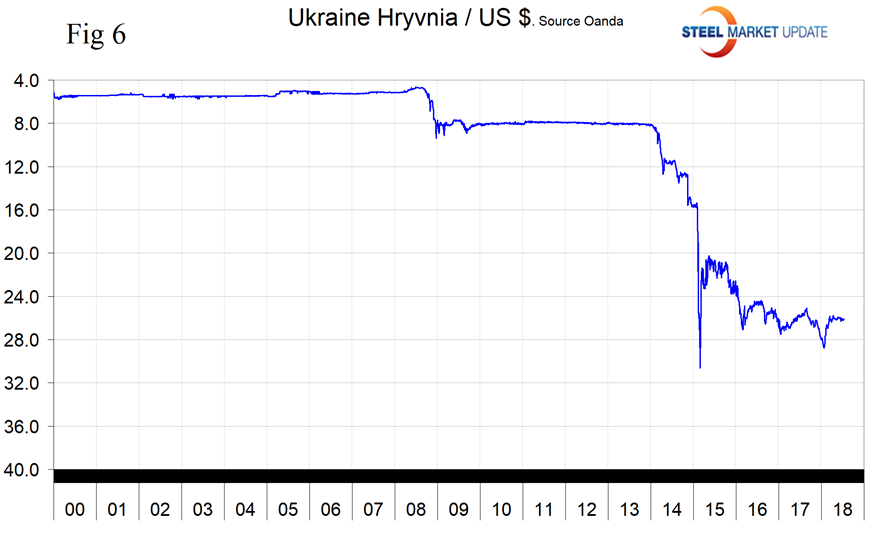
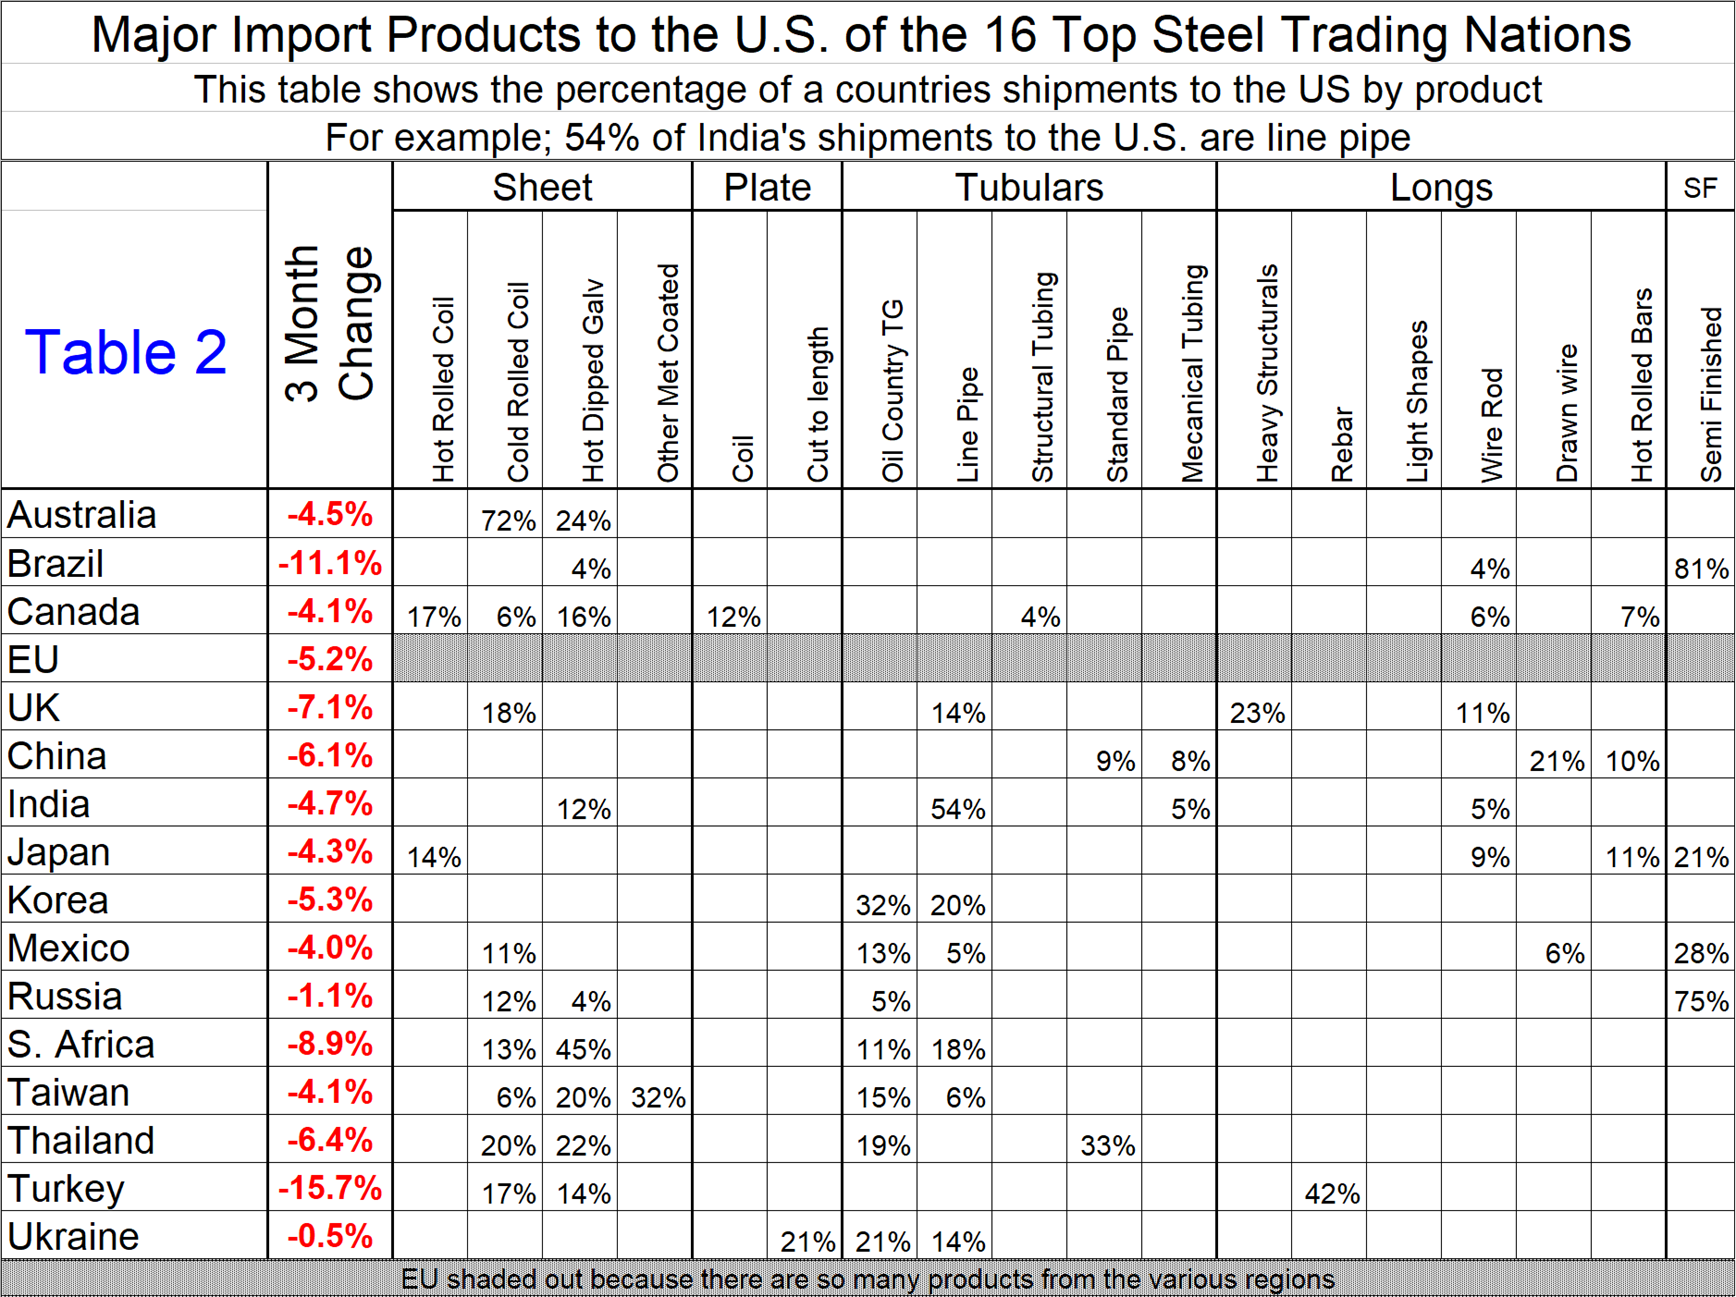
Table 2 shows the major products in the portfolio of the 16 nations and the three-month change in currency value. Something to think about as buyers of offshore steel work to minimize their input materials costs. Turkey and Brazil have had the most favorable (as a steel source) currency movement in the last three months.
Explanation of Data Sources: The broad index is published by the Federal Reserve on both a daily and monthly basis. It is a weighted average of the foreign exchange values of the U.S. dollar against the currencies of a large group of major U.S. trading partners. The index weights, which change over time, are derived from U.S. export shares and from U.S. and foreign import shares. The data are noon buying rates in New York for cable transfers payable in the listed currencies. At SMU, we use the historical exchange rates published in the Oanda Forex trading platform to track the currency value of the U.S. dollar against that of 16 steel and iron ore trading nations. Oanda operates within the guidelines of six major regulatory authorities around the world and provides access to over 70 currency pairs. Approximately $4 trillion U.S. dollars are traded every day on foreign exchange markets.


