

Market Data

May 14, 2018
SMU Report Identifies HR Imports by Product Detail
Written by Tim Triplett
Premium subscribers to Steel Market Update receive reports on imports with macro data broken down by product on the national level. SMU also provides reports that detail the import tonnage received by district of entry and source nation. This new report from SMU takes the analysis even further.
Using U.S. International Trade Commission (USITC) data, SMU takes the import tonnage and breaks it down into sheet and strip, and whether it was in coil or leveled. Then it separates three thickness ranges, it identifies how much was P&O, how much was high strength and how much had patterns in relief.
Table 1 is a monthly summary and year-to-date 2018 that shows each of these conditions (click to enlarge).
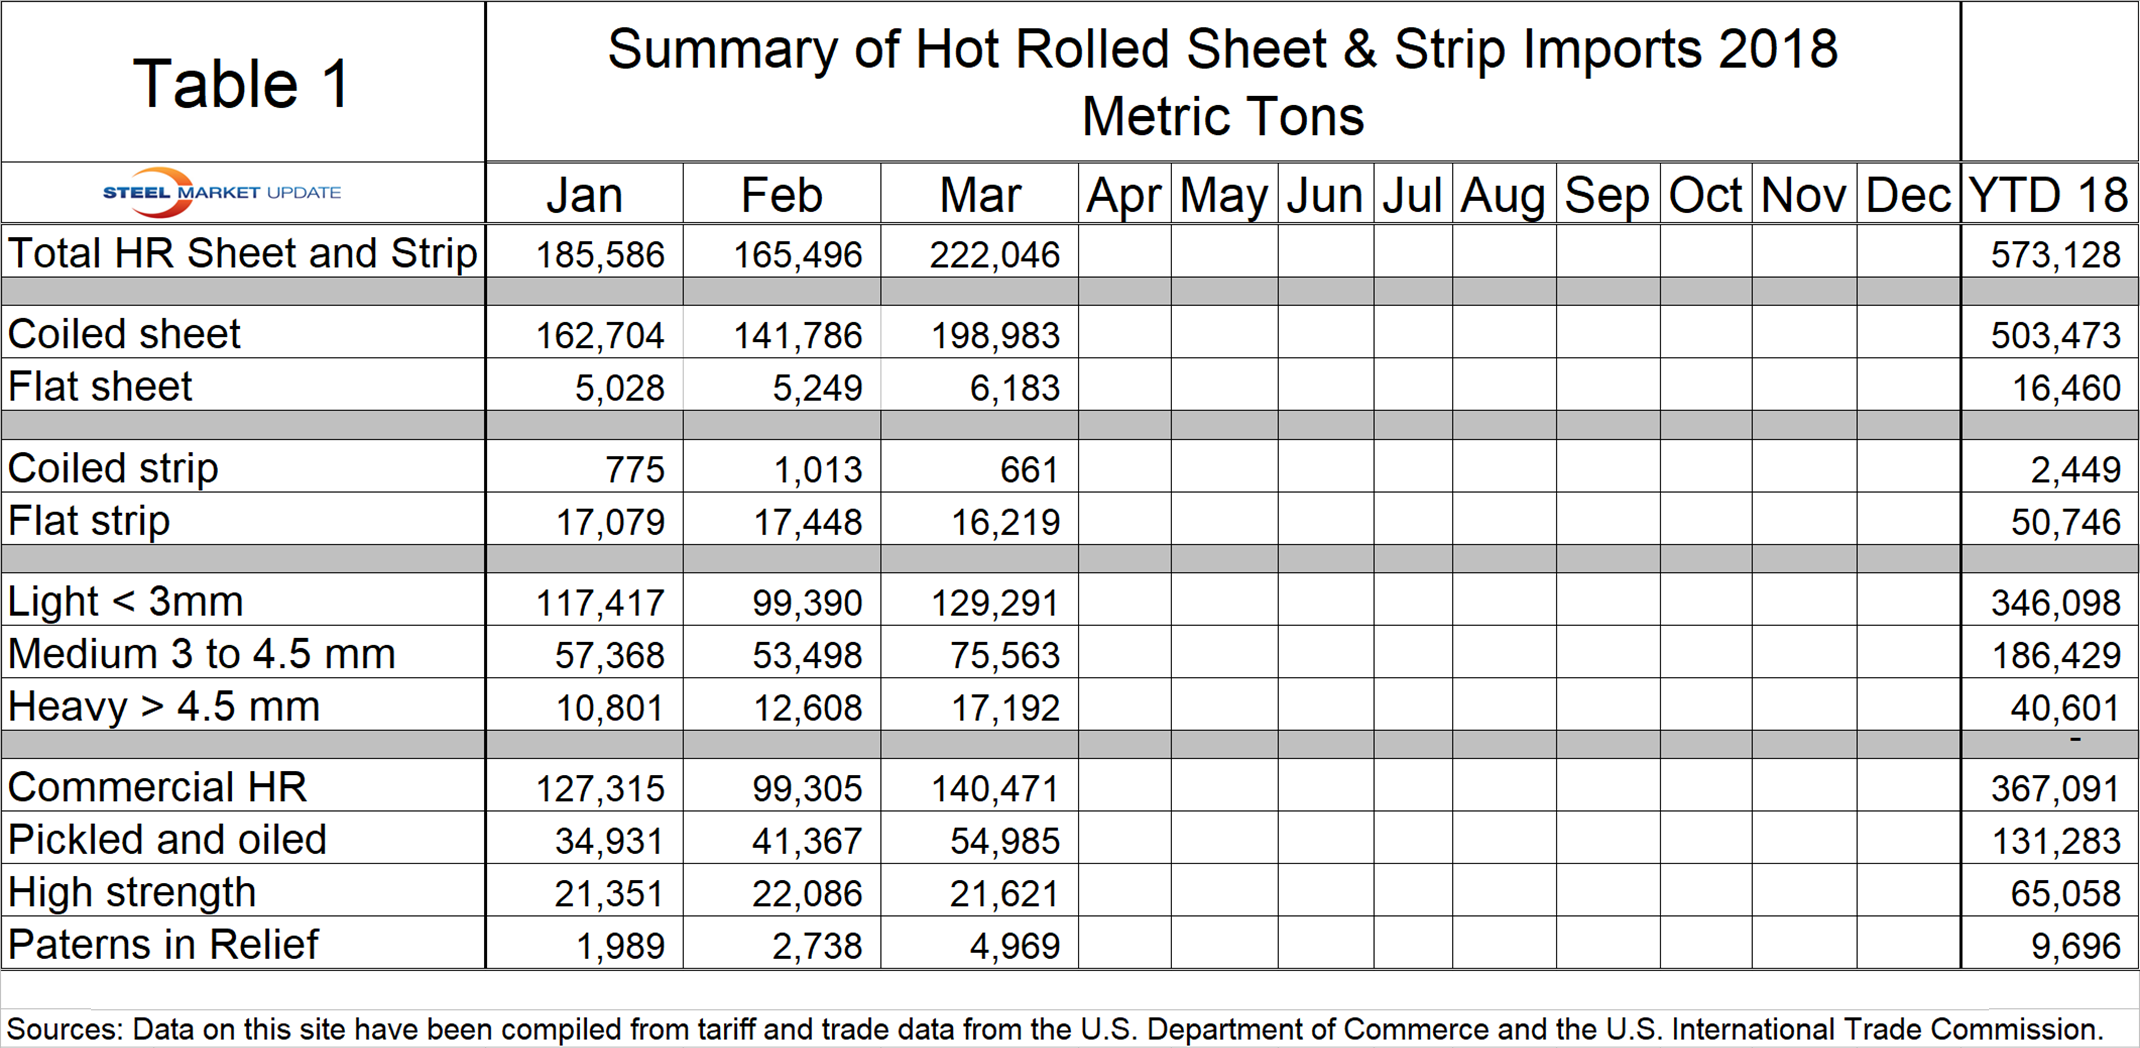
Figure 1 breaks the year-to-date tonnage down into commercial HR sheet, pickled and oiled, high strength and sheet with embossed patterns.
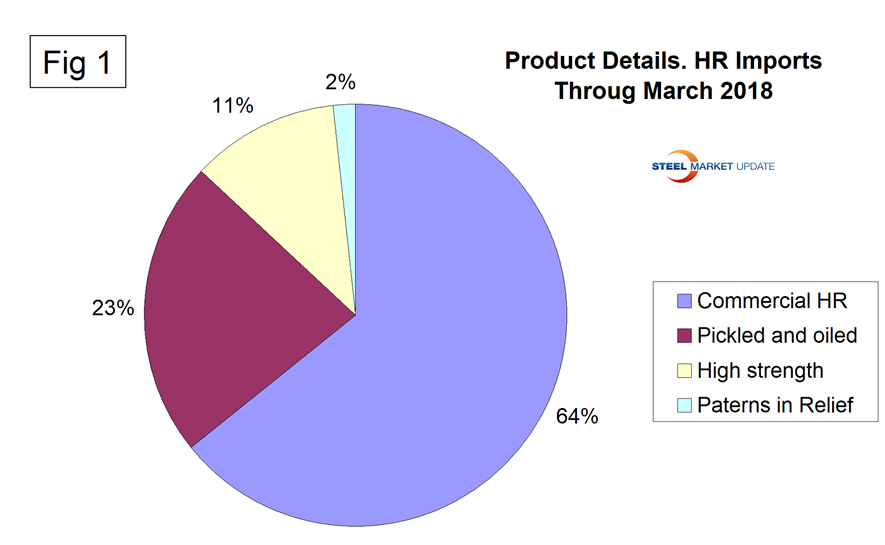
Figure 2 breaks the year-to-date tonnage down into three gauge ranges—light, medium and heavy.
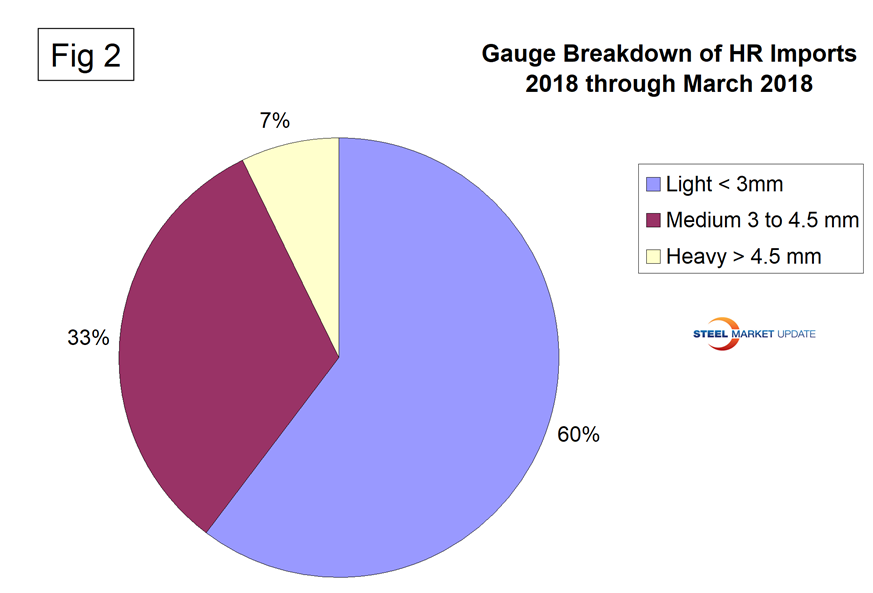
Figure 3 breaks hot rolled sheet imports into coiled and leveled tonnage
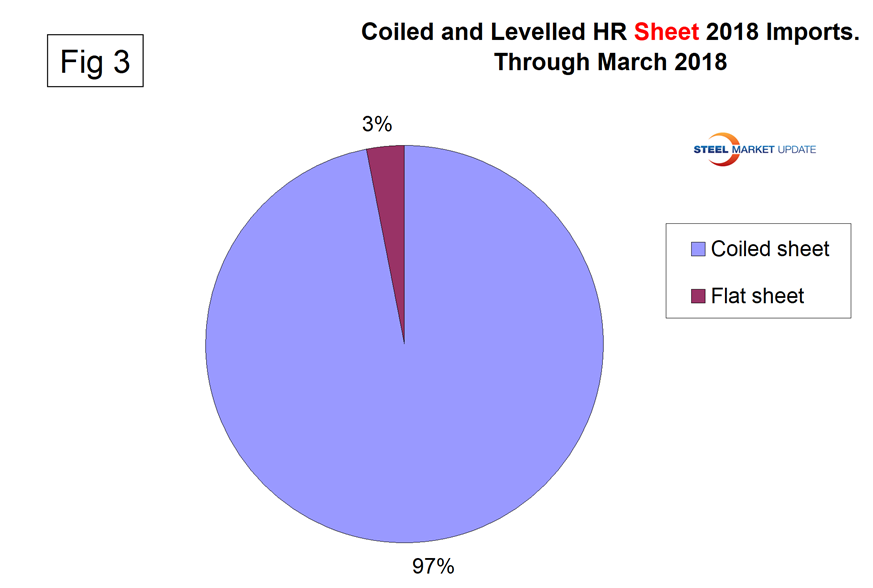
Figure 4 breaks hot rolled strip imports into coiled and leveled tonnage
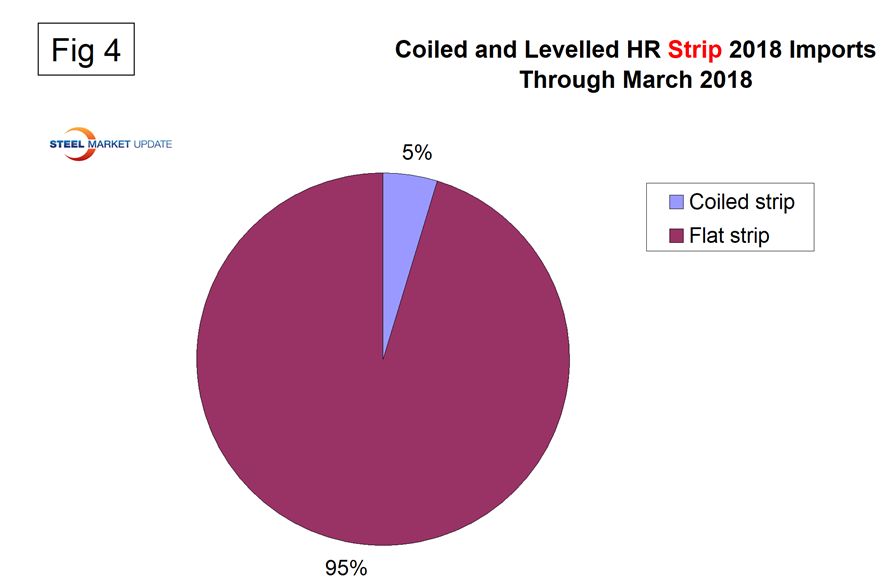
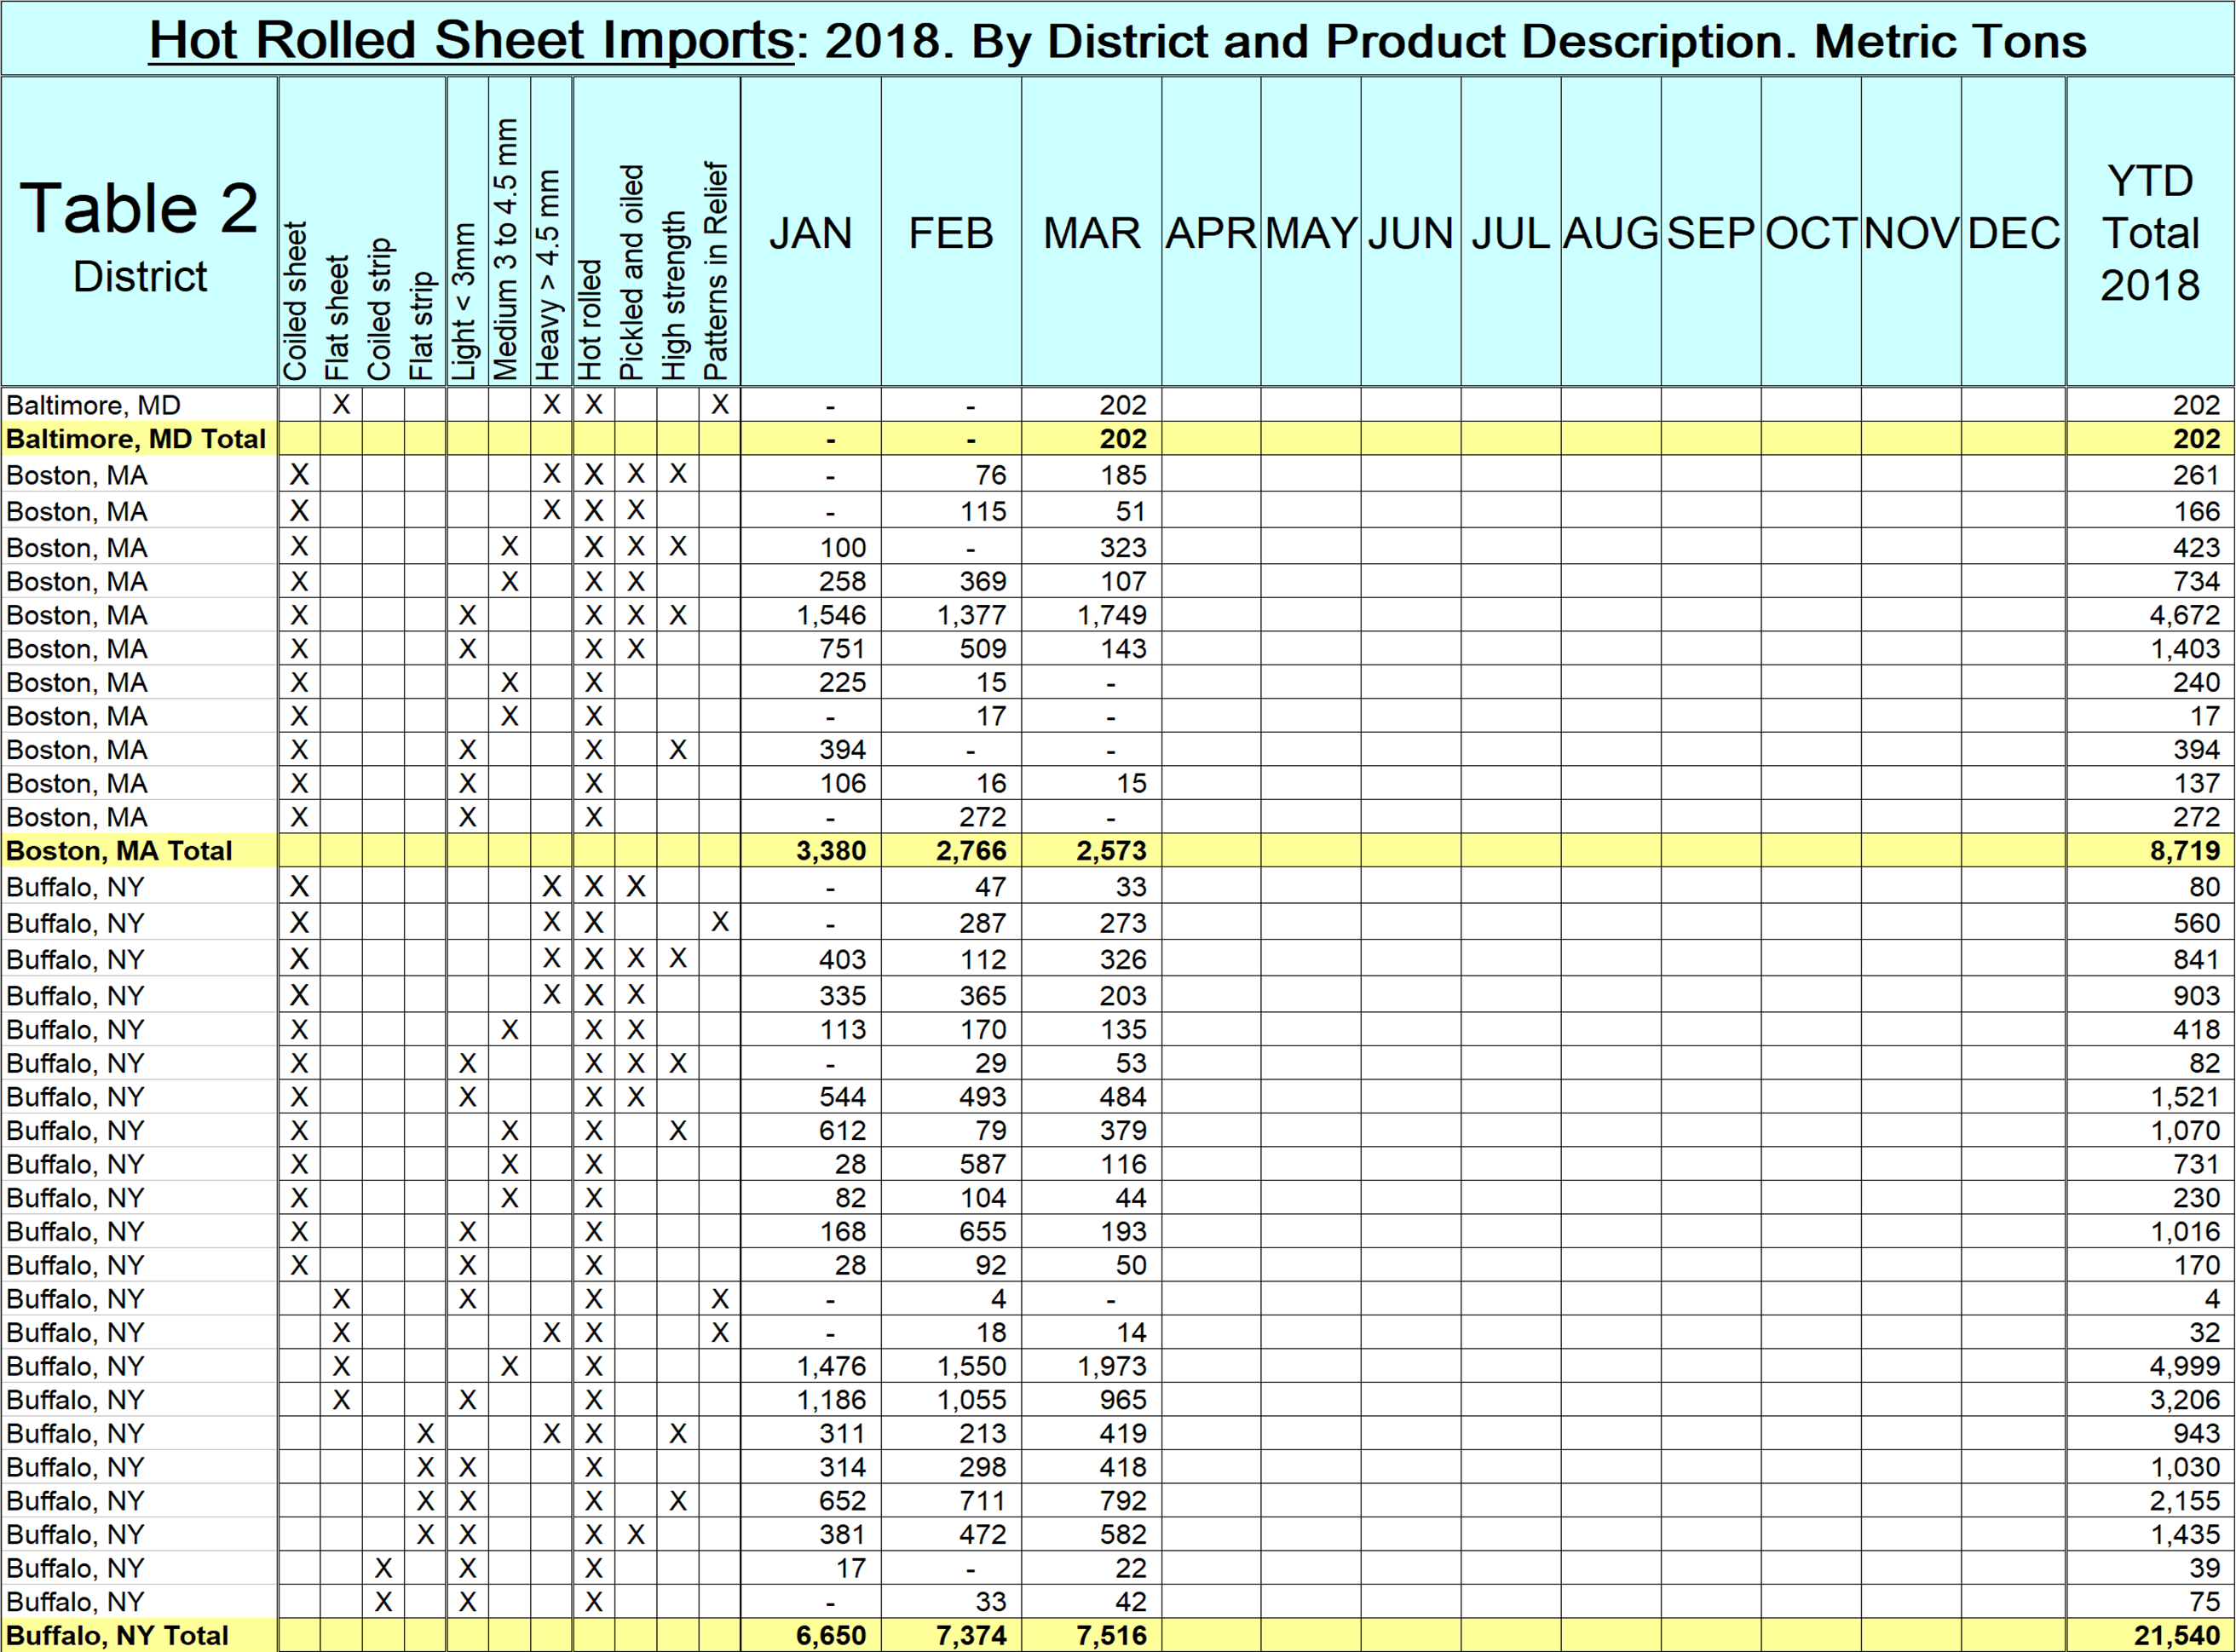
Table 2 is a small part of a sheet that shows detail for every region in the U.S. and is available as an Excel sheet here. It shows the product detail of hot rolled sheet and strip imports by district of entry. For example, the largest tonnage item entering Buffalo in the first three months of 2018 was medium-gauge leveled sheet. To cite another example, if a steel buyer wanted to know how much light gauge, high strength, pickled and oiled coiled sheet had come into Boston year to date, the answer is 4,672 metric tons, which was the highest volume item into that district.;
In June, we will present the same analysis for cold rolled sheet and strip through April.
Note: This data was accessed through the USITC database. All steel traded globally is classified by the Harmonized Tariff System (HTS). The HTS code has 10 digits. The first six are globally universal. The last four are used at the discretion of the nations involved in a particular transaction and are the basis of this report. The way the U.S. uses the last four digits to define products may be different from other nations’ product classification.


