Logistics

April 7, 2018
April 2018 Shipping Report
Written by Sandy Williams
A lot is going on in shipping markets as uncertainty regarding the U.S. trade situation takes hold. Tariffs are expected to affect import volumes at coastal and inland ports. Truck availability continues to be an issue with the flatbed load-to-truck ratio soaring past 100 last week and prices on the increase. Barges are frustrated by high water shipping delays and rails are watching demand closely in regards to economic, trade and financial issues. Here’s the latest recap on shipping in the U.S.
Seaborne Freight
A slowdown in the seaborne freight market in the past 10 days led to a correction in spot market rates across all size vessels. MID-SHIP says the correction was expected and “we continue to believe the underlying fundamentals remain intact: slower fleet growth and steady global improvement.”
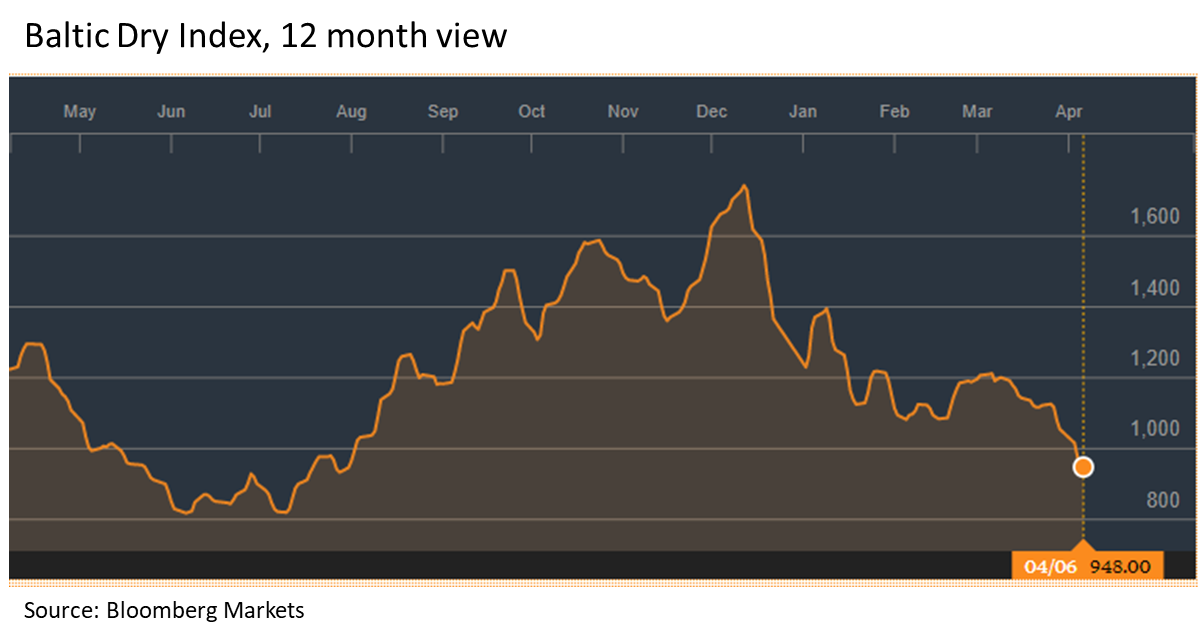
The Baltic Dry Index stood at 948 on April 6, down from 1055 at the end of March and 1700 in December. The BDI tracks dry-bulk rates based on vessel size and shipping route and is a used as a benchmark for overall trade volume.

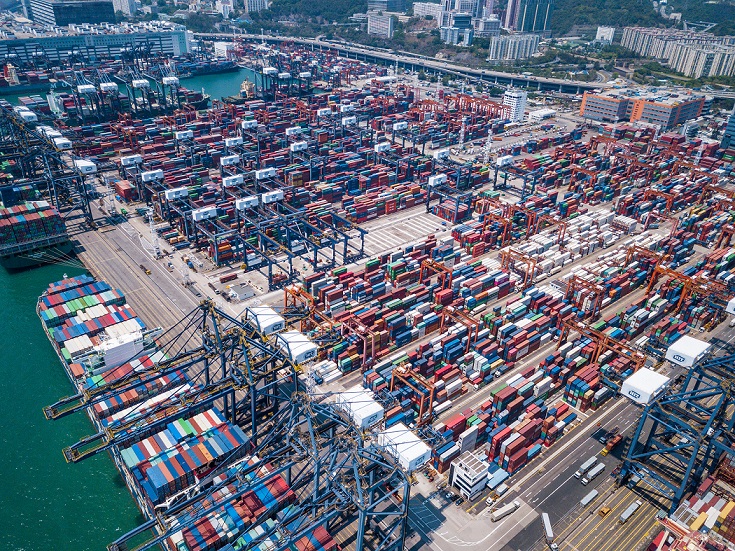
Impending tariffs and a potential trade war has added to the uncertainty in the market. The U.S. tariffs on imports from China, and the resulting Chinese retaliation, threaten roughly 6.6 percent of the total U.S. container trade with China and 2.4 percent of total U.S. container volume, reports JOC.com. The ports of Los Angeles, Long Beach, New York-New Jersey and Savannah will have the most exposure to volume loss caused by the U.S./China trade war.
The Section 232 steel tariffs are expected to affect import volume at major U.S. ports that handle large quantities of steel cargo, and ports have warned about the negative impact to jobs and local economy. The ports of Mobile and Houston handle annually about 5 million tons and 3.7 million tons of steel, respectively. One third of general cargo volume at the Port of New Orleans is comprised of steel imports.
Steel and aluminum shipments are mostly breakbulk cargo, but U.S. ports handled 282,996 TEU of containerized steel and aluminum last year. Remove TEUs from countries that are exempted from the Section 232 tariffs and the containerized volume drops to 201,324, according to PIERS data and JOC.com.
Barge
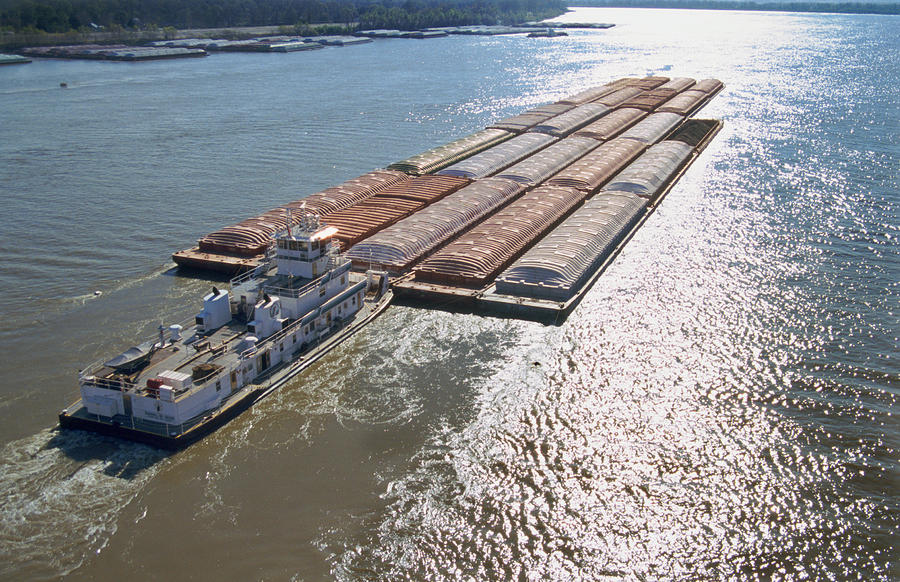
Flood conditions on the U.S. river system are causing delays and congestion for the inland barge market. Delays are worst on the Lower Mississippi River, Ohio River and canals at the Gulf of Mexico. MID-SHIP said river conditions are causing a shortage of barges at the Gulf.
Rail
Rail freight demand is looking positive, said the Association of American Railroads in their March 31 rail traffic report. U.S. railroads originated 1,050,653 carloads in March 2018, up 3.6 percent, or 36,157 carloads, from March 2017. U.S. railroads also originated 1,082,239 containers and trailers in March 2018, up 6.5 percent, or 66,151 units, from the same month last year. Combined U.S. carload and intermodal originations in March 2018 were 2,132,892, up 5 percent, or 102,308 carloads and intermodal units from March 2017.
“Railroads are a derived-demand industry,” said AAR Senior Vice President of Policy and Economics John T. Gray. “Their level of business depends to a large degree on what’s happening elsewhere in the economy. There’s always some economic uncertainty — today that involves, among other things, trade relations, commodity prices, and what the Fed will do about interest rates — but economic signals today are mostly positive. Rail traffic in March was largely positive, too, at least in terms of traffic segments that are most sensitive to what’s going on in the economy.”
Trucking
The average national flatbed spot rate increased another penny last week to $2.53 per mile, the highest weekly rate since summer 2014. The load-to-truck ratio was the highest ever recorded for any truck type by DAT Trendline and was elevated across all regions. The LTR for flatbeds jumped 16 percent from the previous week to 101.5 loads per truck. Compared to February, the ratio jumped 37 percent and was a whopping 148 percent higher than March 2017.
“All states are Hot States now,” said DAT market analyst Peggy Dorf. “If you have an available flatbed, you’re gonna be very, very popular with freight brokers.”


