Prices

April 2, 2018
Raw Material Prices: Scrap, Coking Coal Advance
Written by Peter Wright
Scrap and coking coal prices advanced in March. Iron ore and zinc declined.
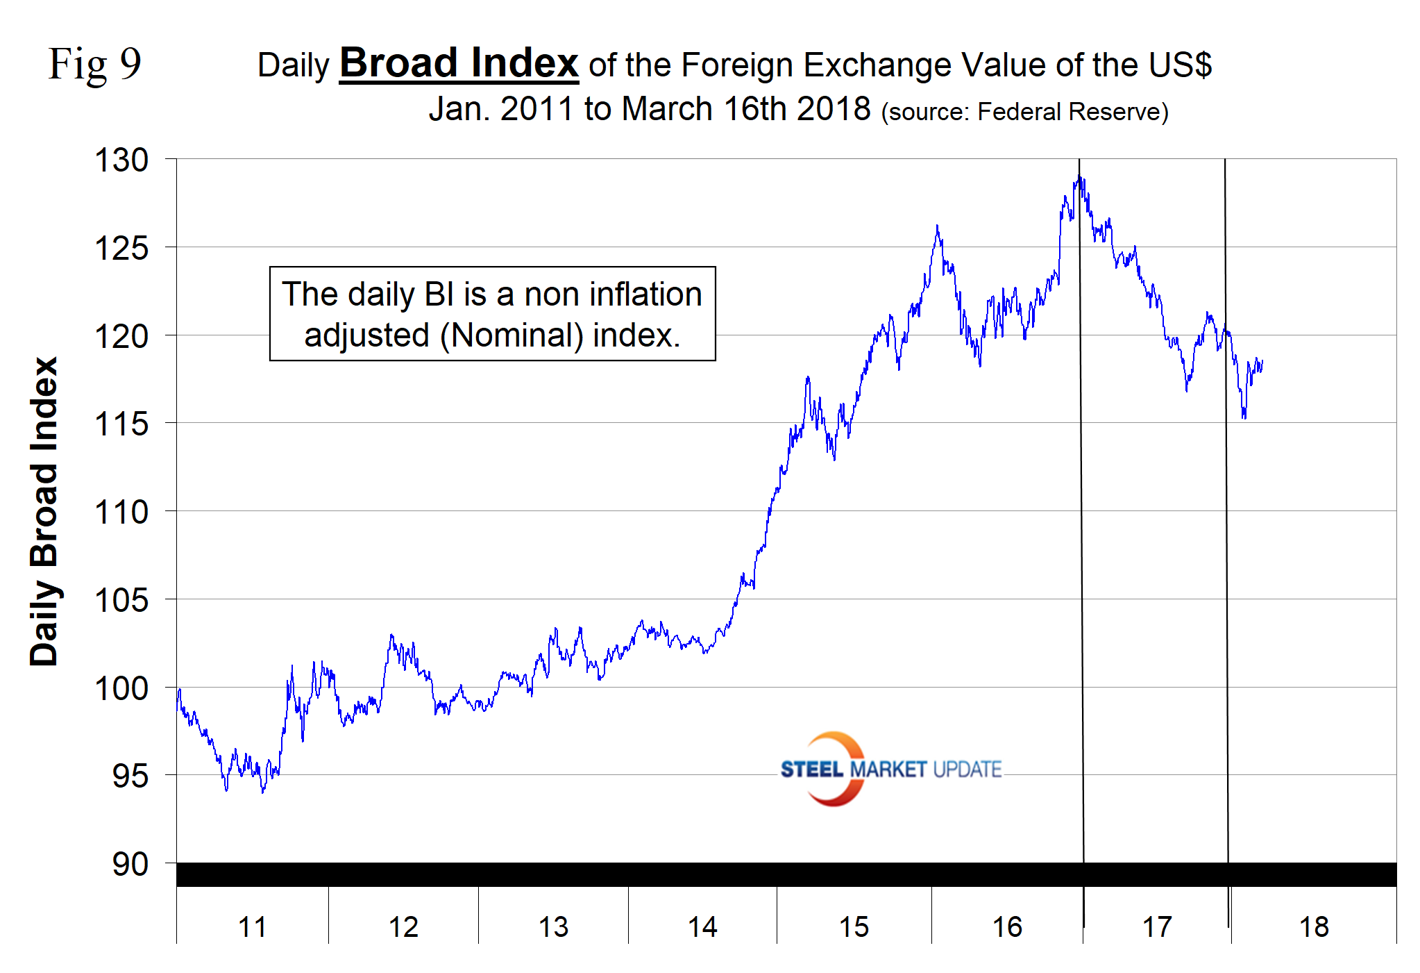
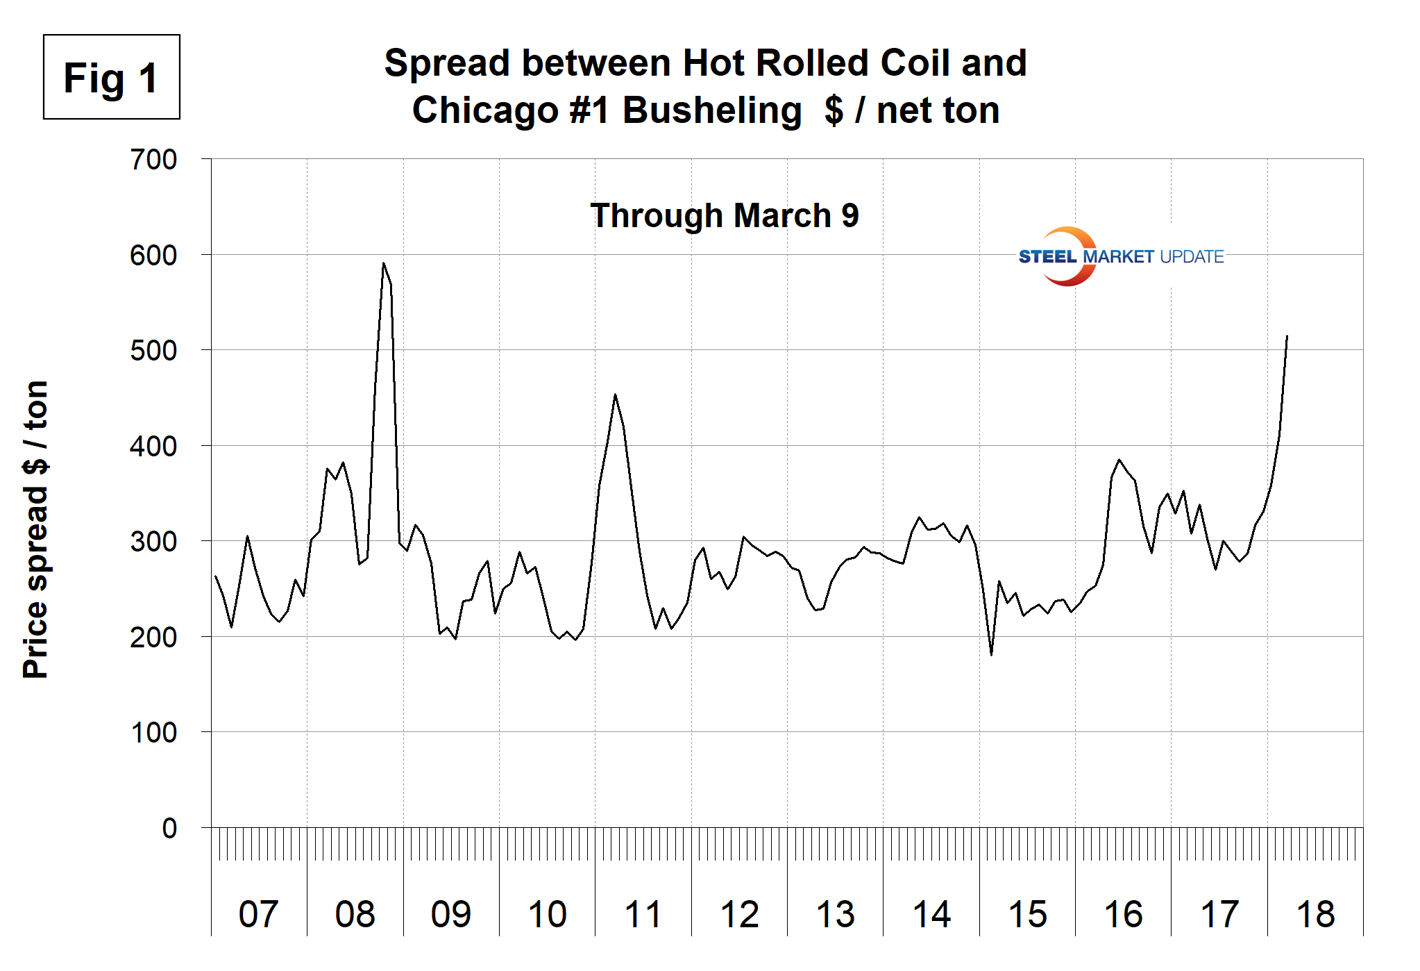
To put the raw materials analysis into perspective, we include here Figure 1, which shows the spread between Chicago #1 busheling and hot rolled coil ex works Indiana through March 9, both in dollars per net ton. March was the first time for the spread in dollars per net ton to exceed $500 since the wild ride of 2008. The spread has increased every month since September when it stood at $278.48.
Scrap
Figure 2 shows the relationship between shredded and #1 busheling both priced in Chicago. In March, shredded was $360.00 per gross ton, up from $275.00 in November 2017. Busheling rose from $337.00 in November to $375.00 in January and stayed at that level in February and March. The busheling premium was $15.00 in March, down from $77.50 in September last year.
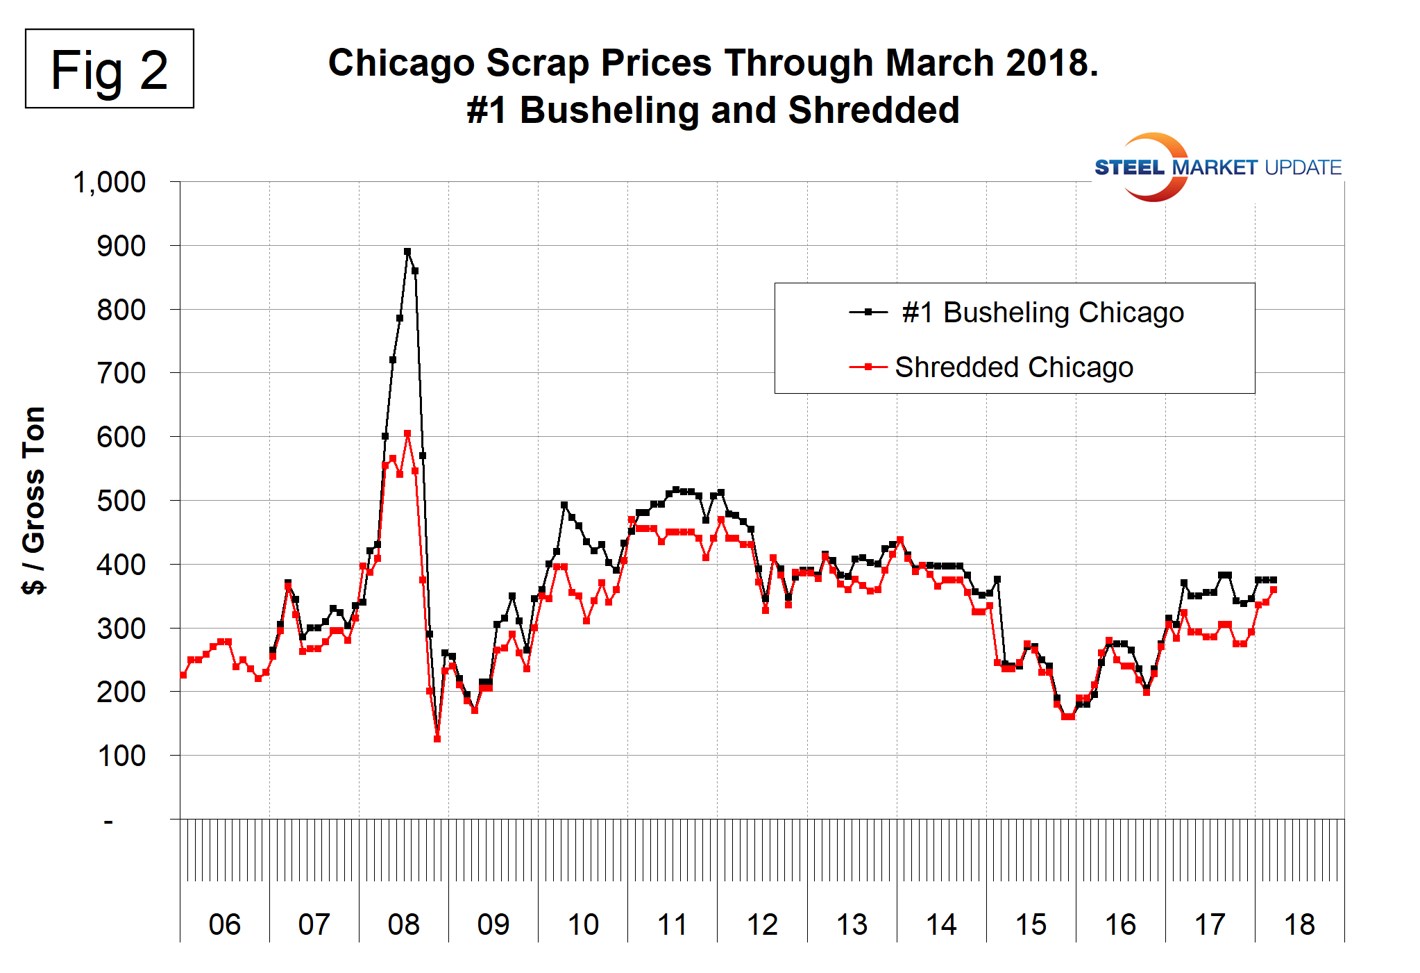
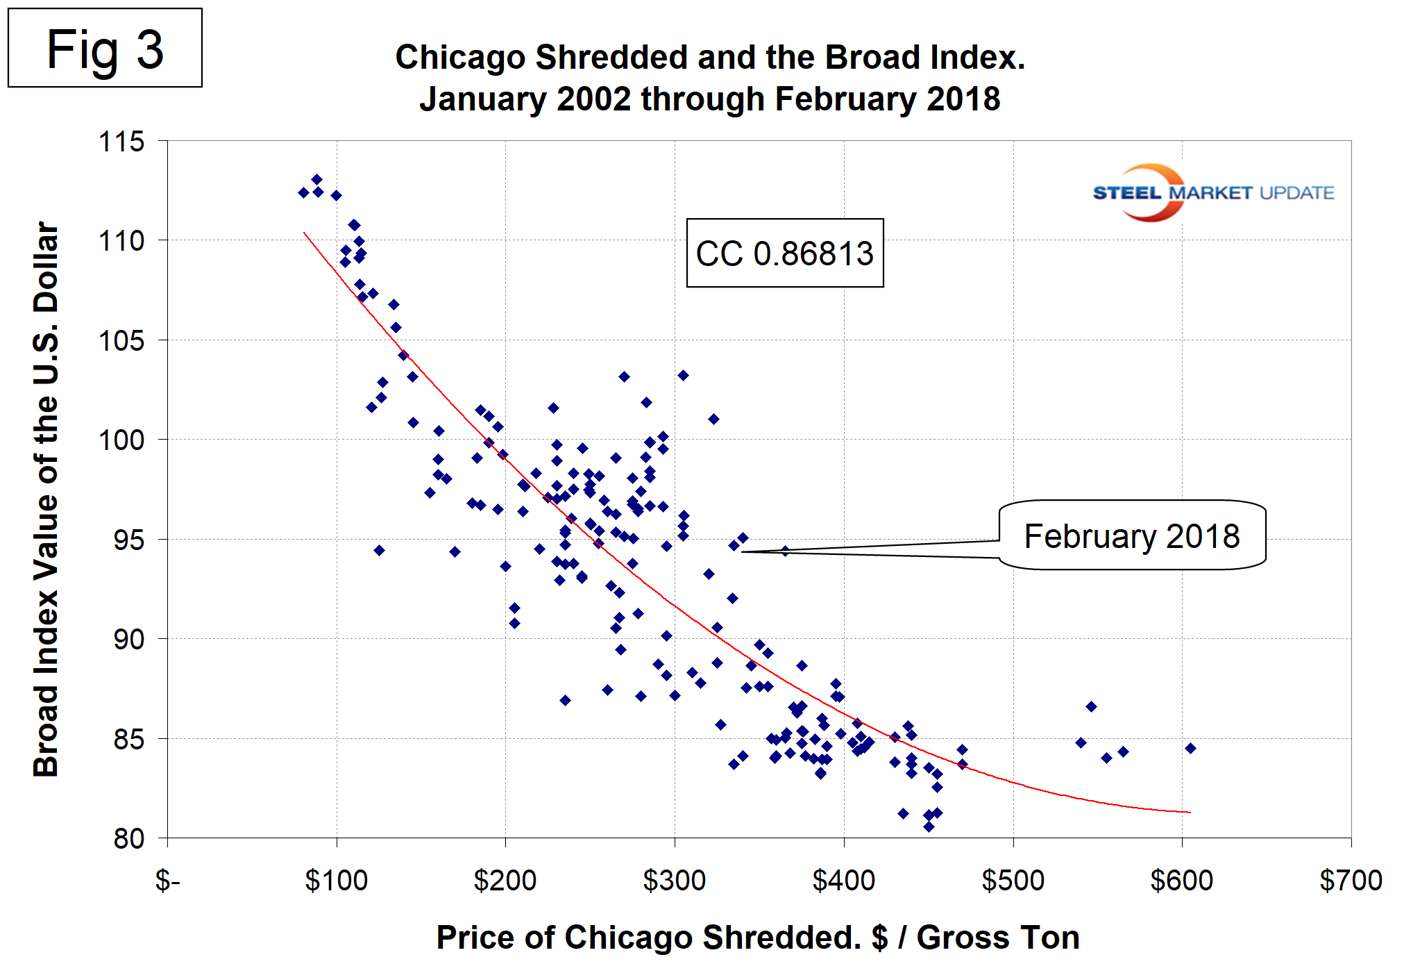
Figure 3 is a scatter gram of the price of Chicago shredded and the Broad Index value of the U.S. dollar as reported by the Federal Reserve. The latest data for the Broad Index was February. This is a causal relationship with a correlation of over 86 percent.
Iron Ore
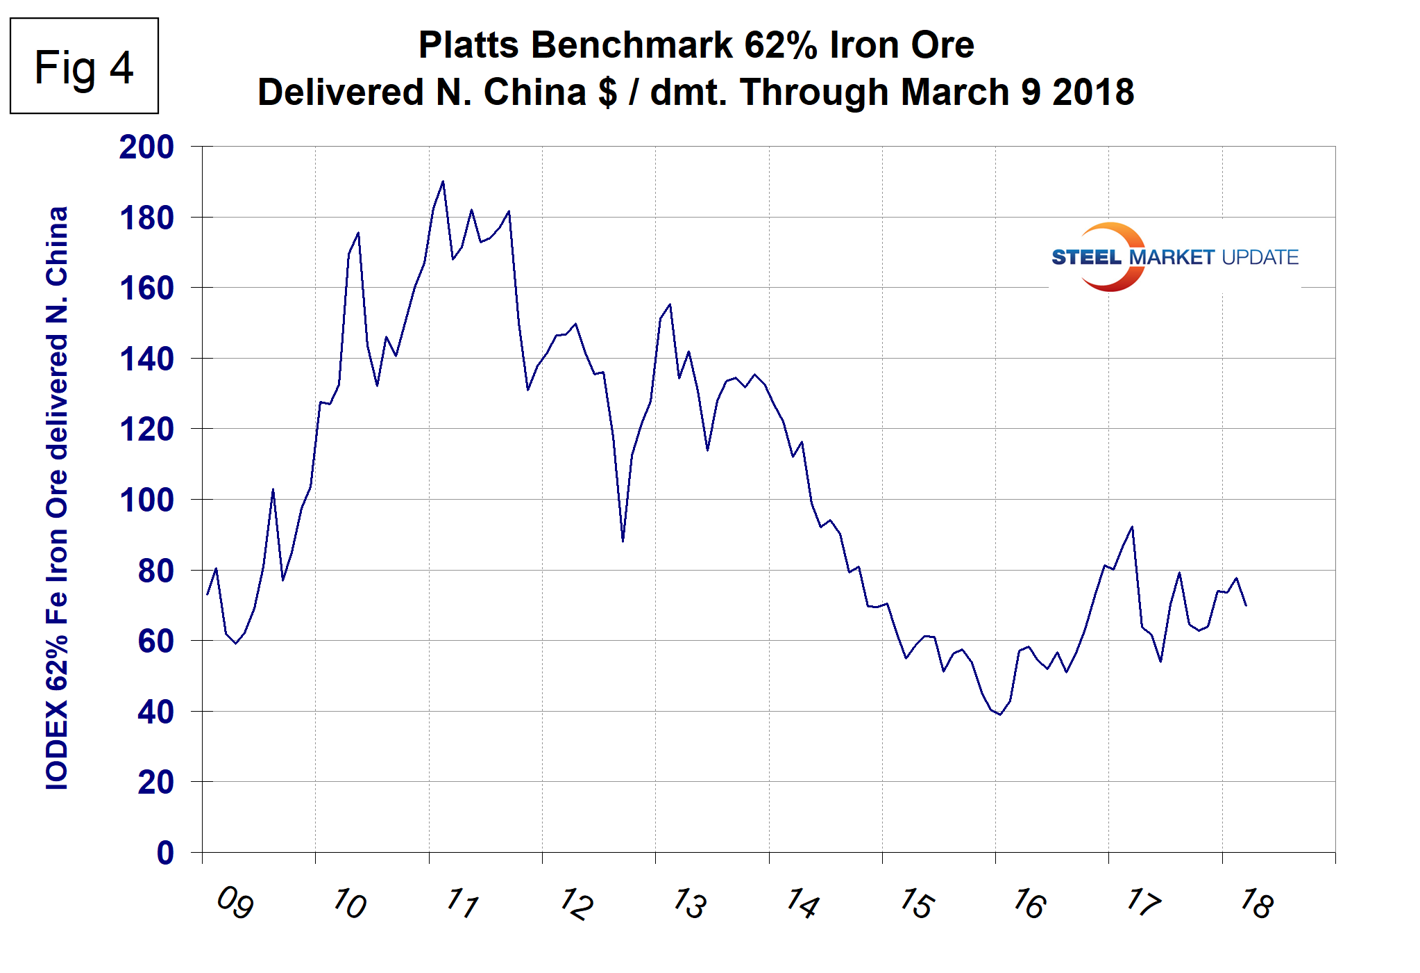
Beijing’s policies to clean up and consolidate the domestic steel industry are playing into the hands of iron ore exporting countries, reported Mining.com on March 8. High grade imported ore is preferable to China’s domestic, which requires beneficiation and sintering processes, both of which are polluters. Figure 4 shows the Platts IODEX of 62% Fe delivered North China since January 2009. The Index recovered to $92.30 on March 17, 2017, but had declined to $69.95 on March 9, 2018.
There is a long-term relationship between the prices of iron ore and scrap. Figure 5 shows the IODEX and the price of Chicago shredded through March 9.
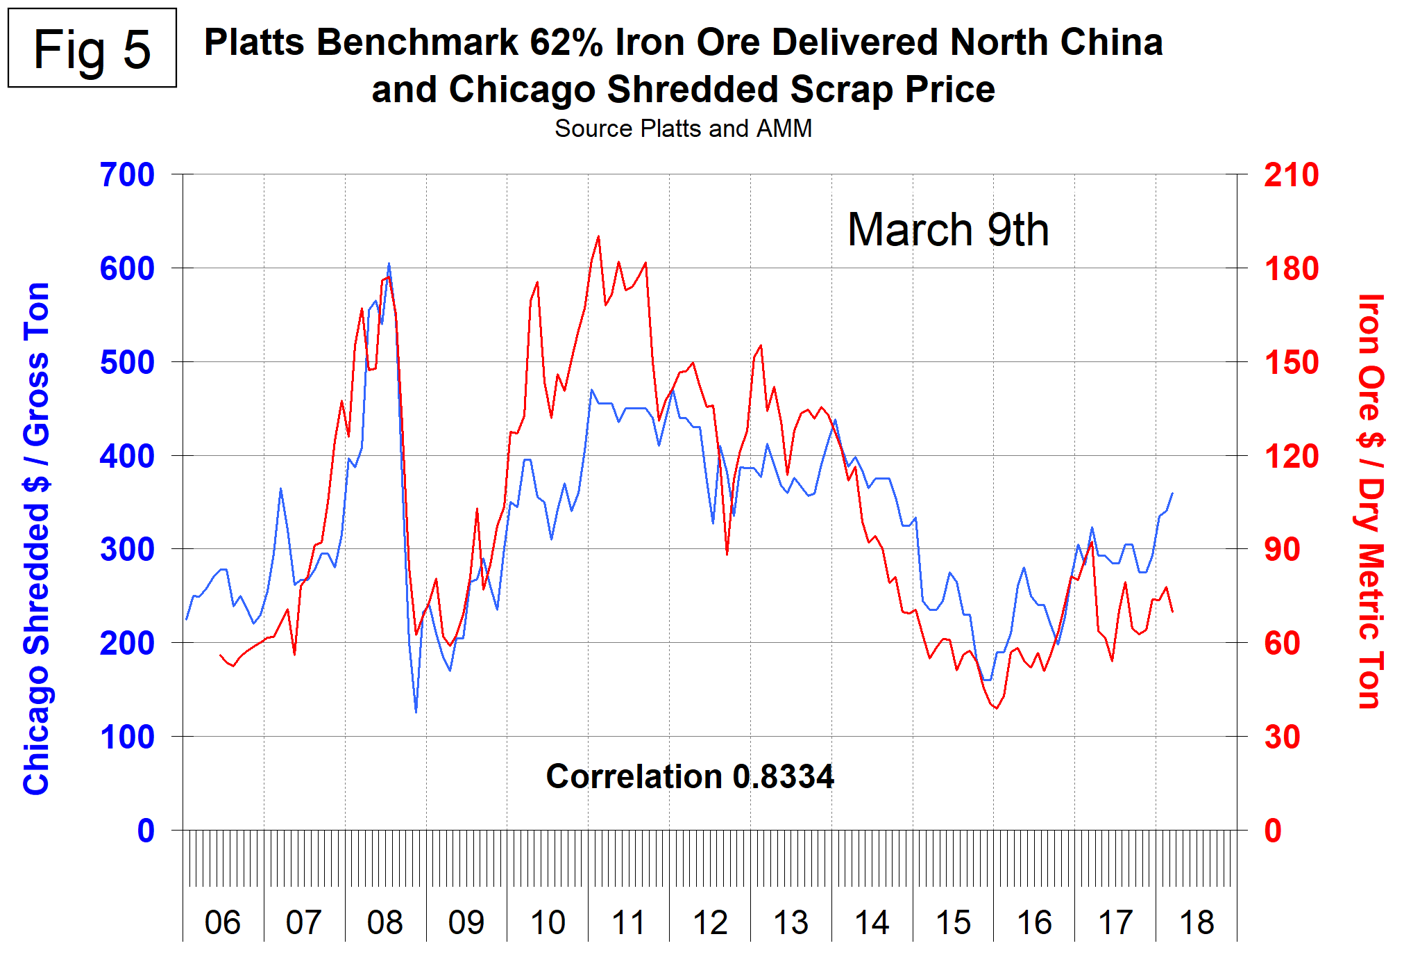
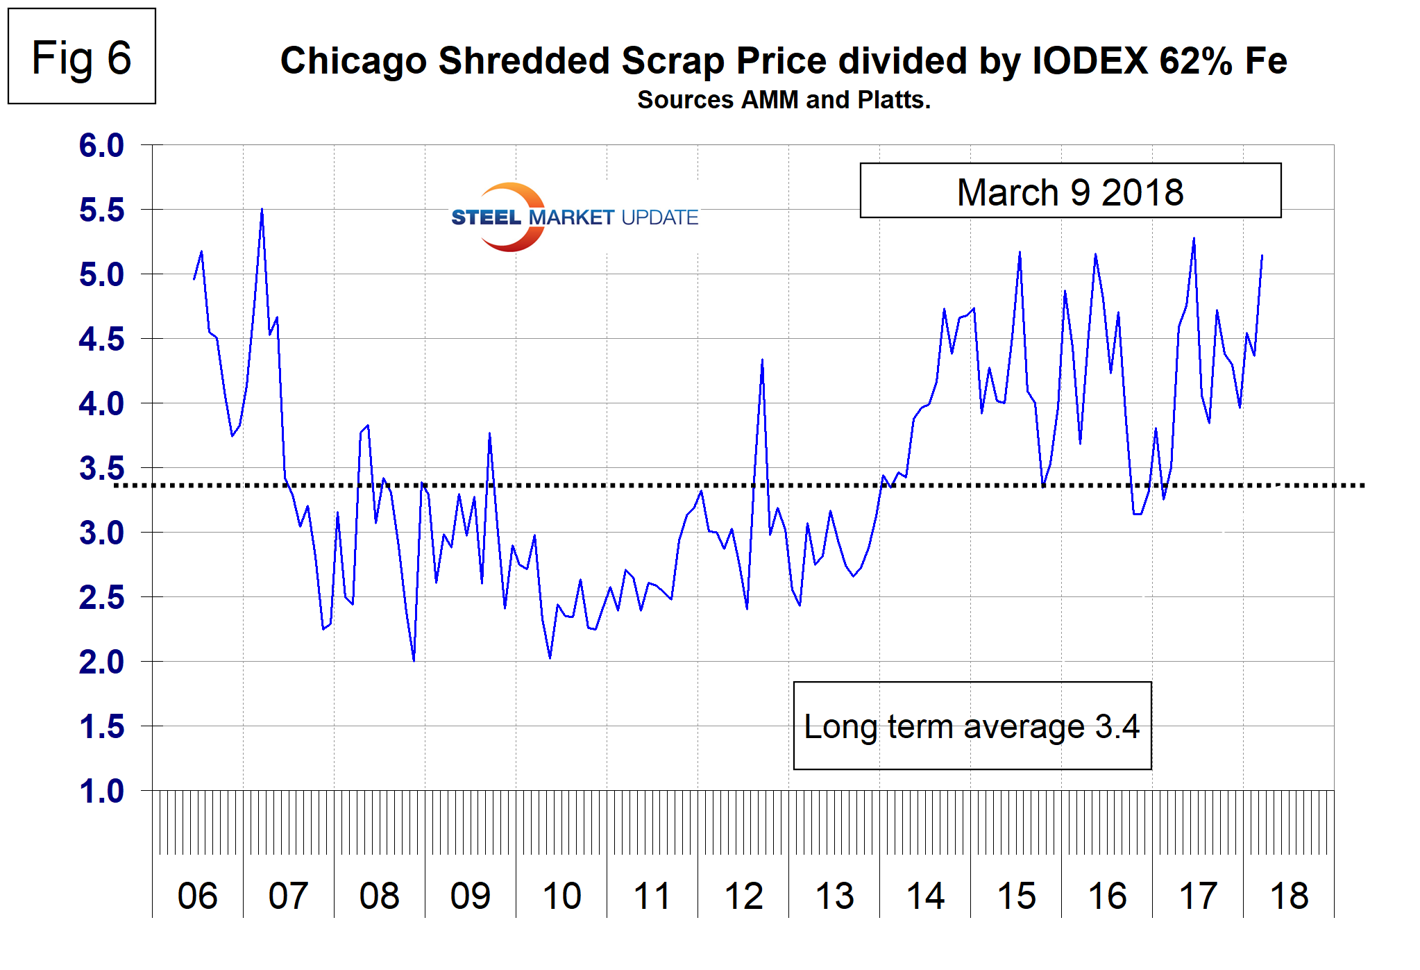
The correlation since January 2006 has been 83.34 percent. In the last 10 years, scrap in dollars per gross ton has been on average 3.4 times as expensive as ore in dollars per dry metric ton (dmt). The ratio has been erratic since mid-2014, but overall since then has benefited the integrated producers, and that is particularly true today. There was a six-month respite for the EAF operators in Q4 ‘16 and Q1 ‘17, but now the ratio is once again high with a value of 5.15 on March 9. The June 2017 ratio of 5.28 was the highest in over 10 years (Figure 6). Since Chinese steel manufacture is 95 percent BOF, this ratio has allowed them to be more competitive on the global steel market. In the last four years, there have been times when China could supply semi-finished to the global market at prices competitive with scrap.
Coking Coal
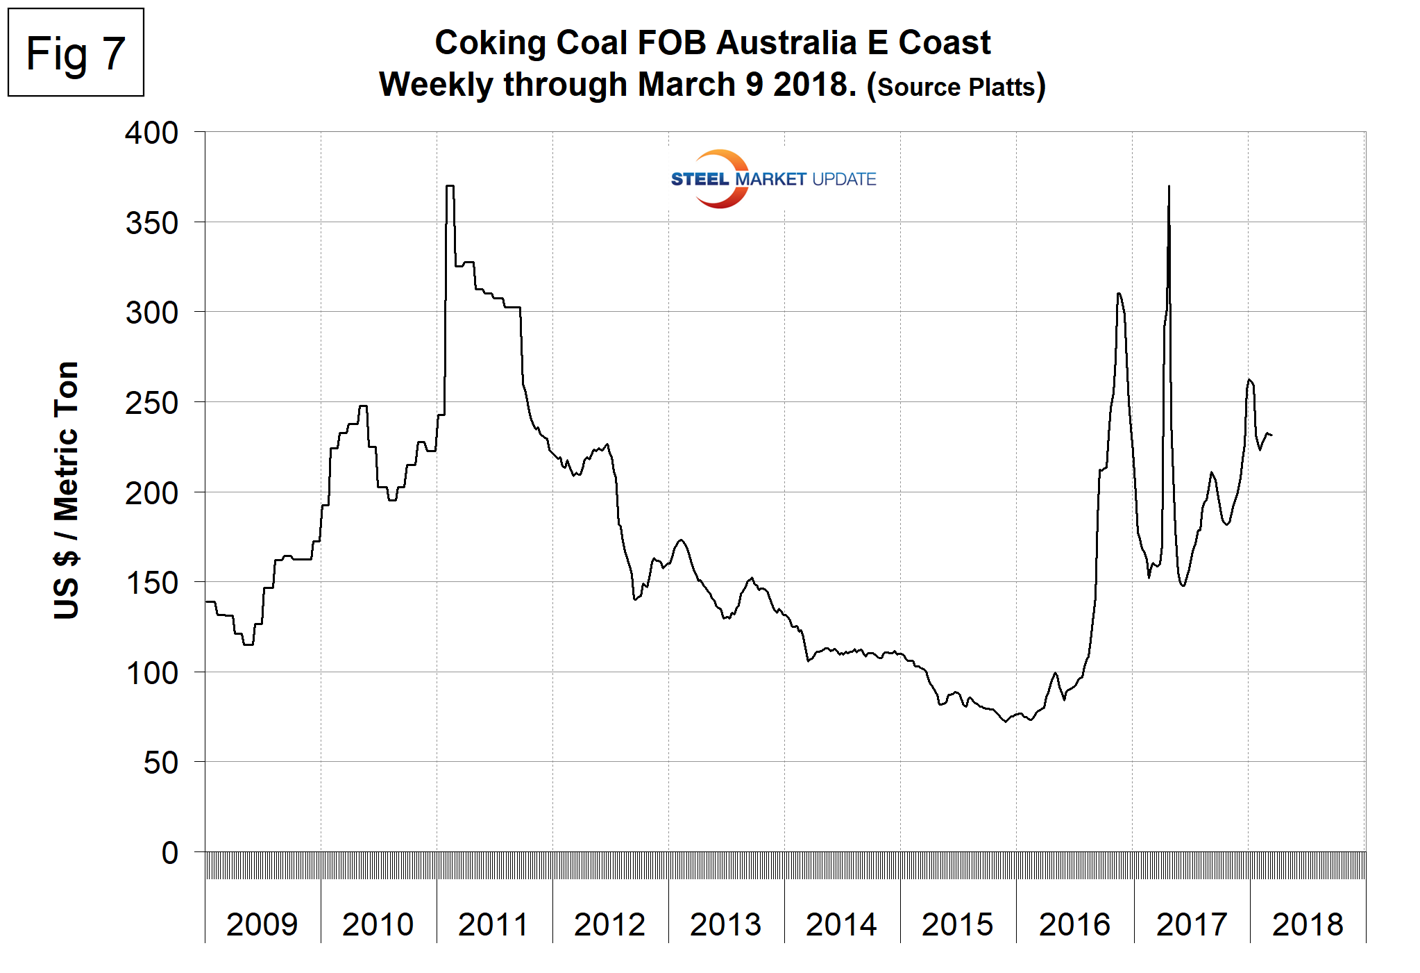
Coking coal prices have been highly erratic in the last 18 months. From mid-October 2017 to the end of December 2017, premium hard low volatile coking coal prices rose from $181.50 per metric ton to $262.25 FOB Australia’s East Coast (Figure 7). Since then the price has declined to $231.50 on March 9.
Zinc
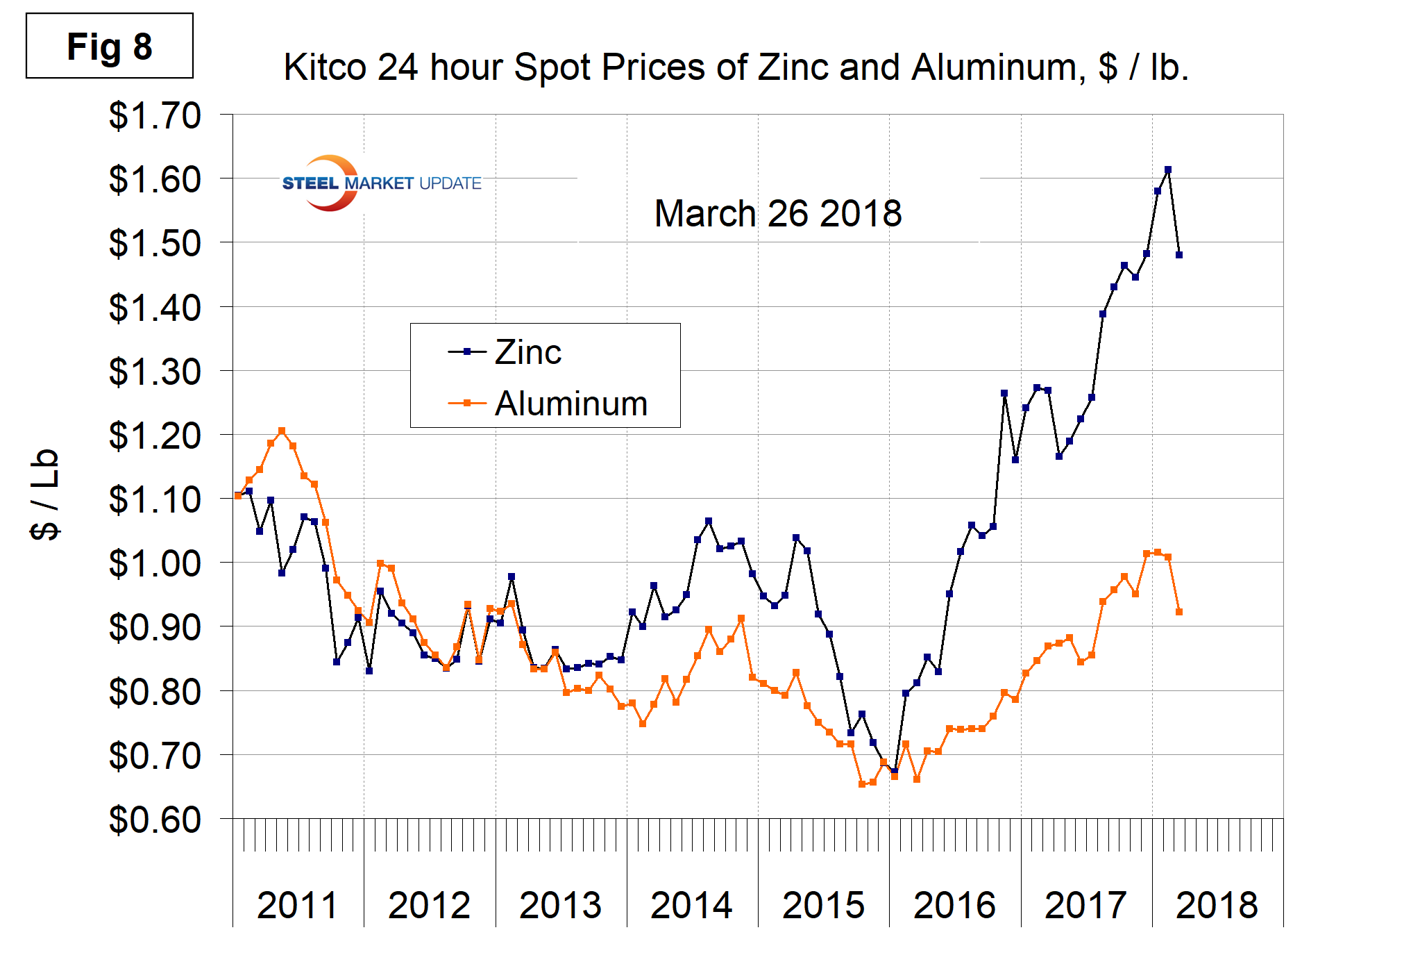
Zinc is the fourth most widely used metal in the world after iron, aluminum and copper. Its primary uses are 60 percent for galvanizing steel, 15 percent for zinc-based die castings and about 14 percent in the production of brass and bronze alloys. This month, we came across an in-depth analysis of supply, demand and inventories in the global zinc market, which is linked here for those readers who want to dig deeper. Kitco publishes a daily spot price of zinc, which we have transcribed to Figure 8. Just as a point of reference, we have included aluminum in the same graph. In April 2017, the price of zinc resumed its upward trend reaching another all-time high of $1.6134 per pound on Feb. 21, 2018. In the last month, the price declined to $1.4793 on March 26. The International Zinc Association meeting took place in Carlsbad, Calif., last month. A speaker from Wood McKenzie projected that the shortfall in production would continue through 2022. A cyclical price peak of $2.15 per pound was forecast for 2019.
SMU Comment: There is an inverse relationship between commodity prices and the value of the U.S. dollar on the global currency markets. From Jan. 1 through March 16, the dollar was down by 8.1 percent, but since Feb. 1 has been trending back up again (Figure 9). A weakening dollar puts upward pressure on the price of those global commodities that are priced in dollars, as is clearly shown by the relationship between scrap and the dollar index described above.