Prices

February 1, 2018
HRC Futures Consolidating Gains After Record Volumes in January
Written by David Feldstein
The following article on the hot rolled coil (HRC) futures market was written by David Feldstein. As the Flack Global Metals Director of Risk Management, Dave is an active participant in the hot rolled futures market, and we believe he provides insightful commentary and trading ideas to our readers. Besides writing futures articles for Steel Market Update, Dave produces articles that our readers may find interesting under the heading “The Feldstein” on the Flack Global Metals website, www.FlackGlobalMetals.com. Note that Steel Market Update does not take any positions on HRC or scrap trading and any recommendations made by David Feldstein are his opinions and not those of SMU. We recommend that anyone interested in trading HRC or scrap futures enlist the help of a licensed broker or bank.
CME Midwest HRC futures have been consolidating since last Thursday with February futures trading between $720 and $730/st. January futures expired yesterday settling at $677/st.
Below are HRC and CRC international differentials using pricing from SBB Platts.
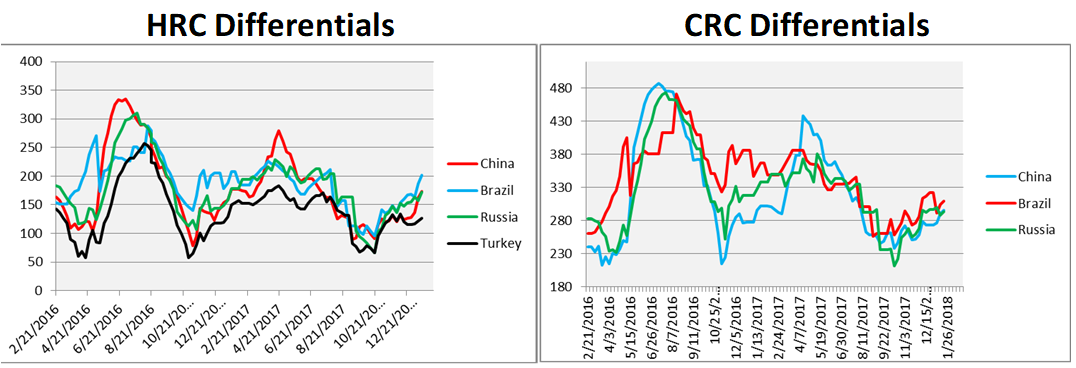
Notice in the charts above the last two times the differentials bottomed; first in March 2016 and second at the end of October 2016. Now look at the chart below and notice the massive rally in the Midwest HRC price that followed in both instances. The rally that started in March 2016 gained $231 or 58 percent from low to high. The rally that started in October 2016 gained $192 or 41 percent from low to high.
Platts TSI Daily HRC Price
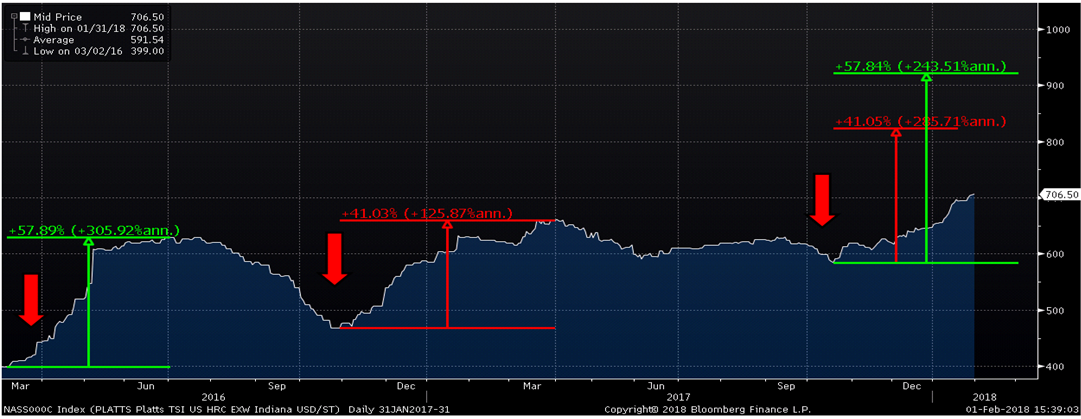
There is no question that Midwest HRC is in rally mode, so now the question naturally turns to how high the rally will take us. The HRC price is now in somewhat uncharted territory with the index last trading this high in early 2012. If this rally, which is up 21 percent from the low set at $583.75 on Oct. 18, 2017, produces percentage gains similar to either of these last two rallies, then that would be the equivalent of the HRC price somewhere between $820 to $920/st.
For some of you, those figures may seem ludicrous, but the fundamentals remain strong, the great OEM restocking looks to be in its early stages, and the most important development this week has been that steel mill lead times look to have aggressively pushed out. I have been paying close attention to these lead times, anxiously awaiting a sharp move higher. That looks to be happening, and as the buying collective recognizes this, they will also realize they don’t have enough inventory. This creates a bottleneck and positive feedback loop as AVAILABILITY trumps price. More buying pushes out lead times perpetuating the short squeeze.
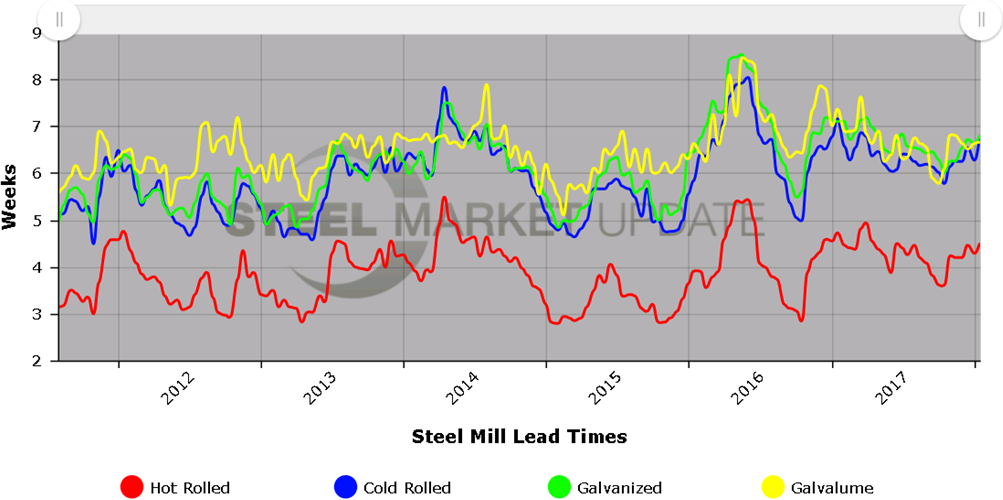
This is the Steel Market Update lead time chart. Expect lead times to spike weeks higher when this chart is updated next Thursday.
The HRC futures market has been very active since the year started with plenty of market participants willing to sell into the rally. It will be interesting to see if a short squeeze also develops in the futures market if prices get into the high $700s as margin calls start pressuring those with big short positions.
Hey, check out these curves!
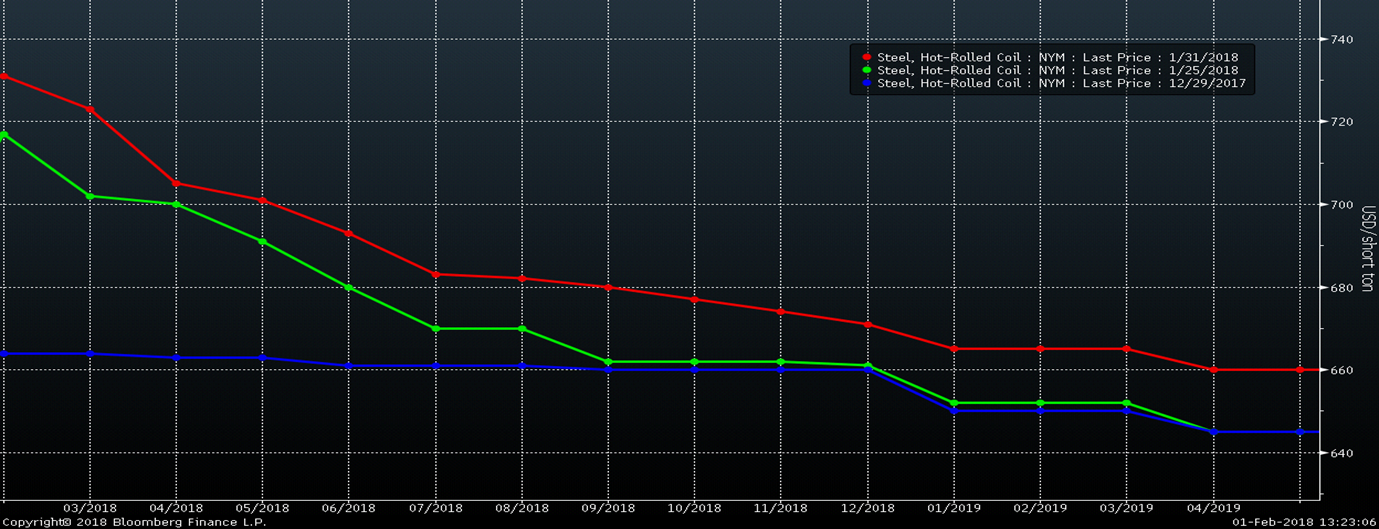
HRC futures continue to move higher and the curve’s backwardation got a bit steeper.
CME Midwest HRC Future Curve
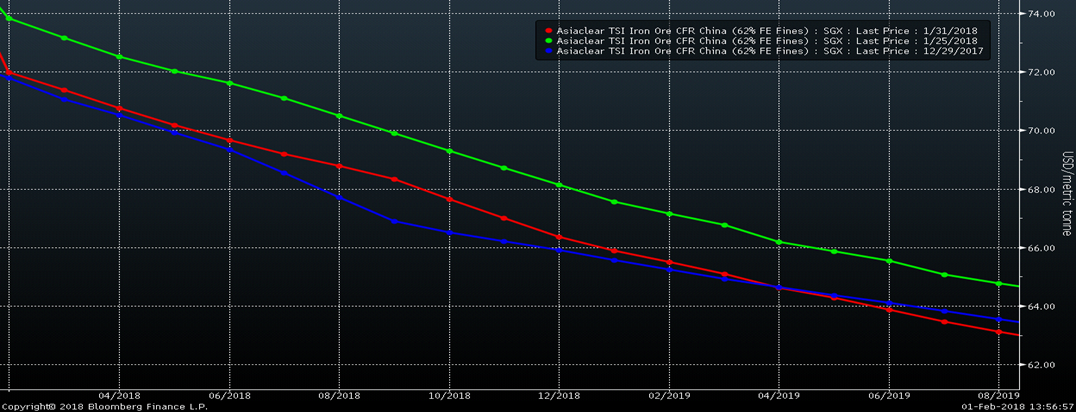
The iron ore curve remains backwardated. Ore prices have been under a little pressure as the Chinese New Year approaches. Economic activity in China grinds to a halt during this time. One very interesting rumor bouncing around this week is a call to extend the winter production curbs in some or all provinces through May or even the rest of 2018.
SGX Iron Ore Future Curve
Here are some more ferrous products with more backwardation. Below are the curves for busheling and Turkish scrap, which are mostly unchanged over the past week.
CME No. 1 Busheling & LME Turkish Scrap Futures Curves
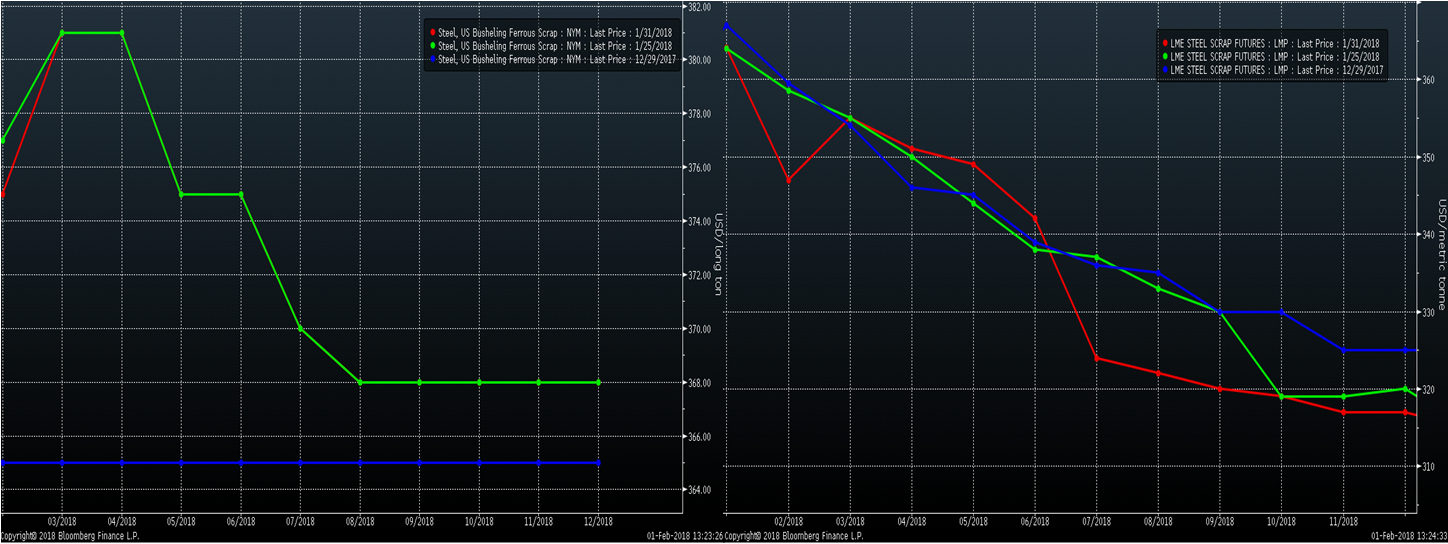
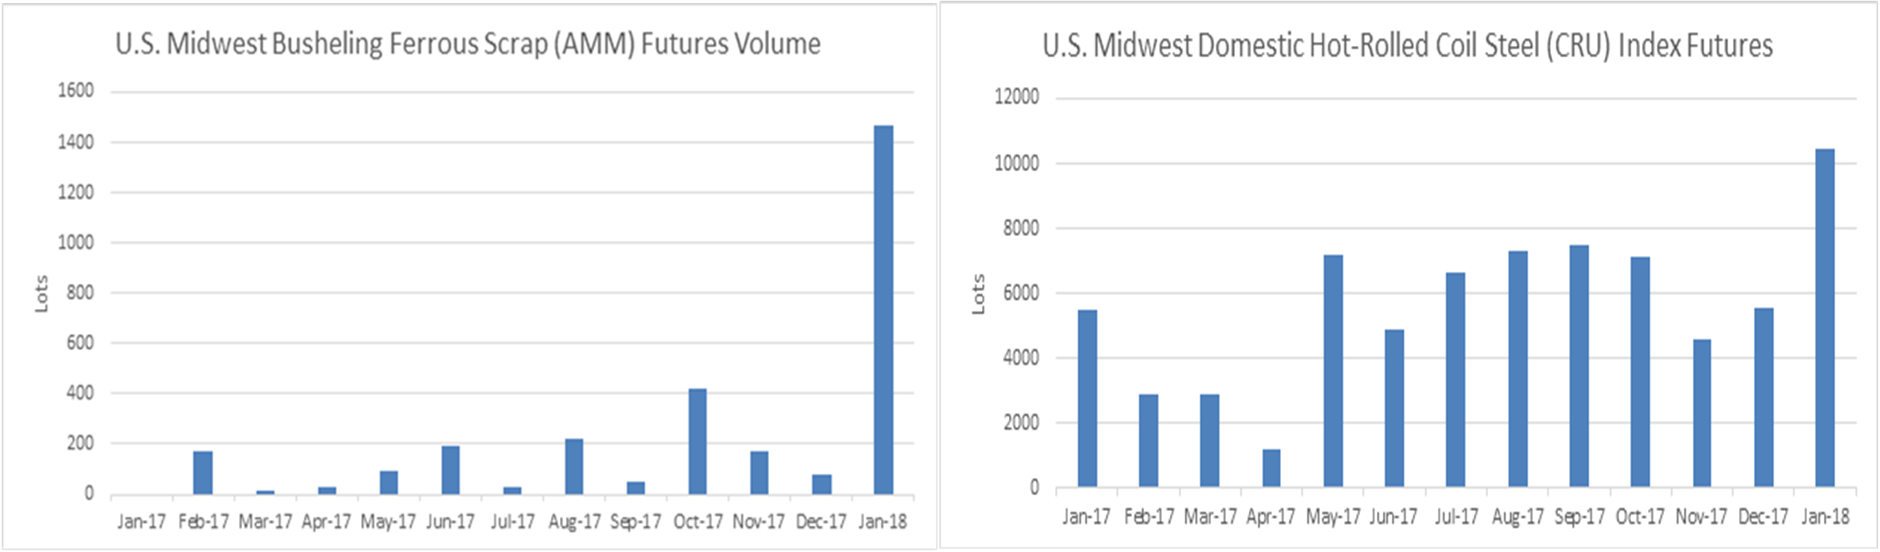
CME Busheling futures traded record volumes in January. A number of market participants have helped boost volume in busheling futures, which has also boosted HRC futures liquidity as some are trading the metal spread by buying scrap and selling HRC or vice versa.
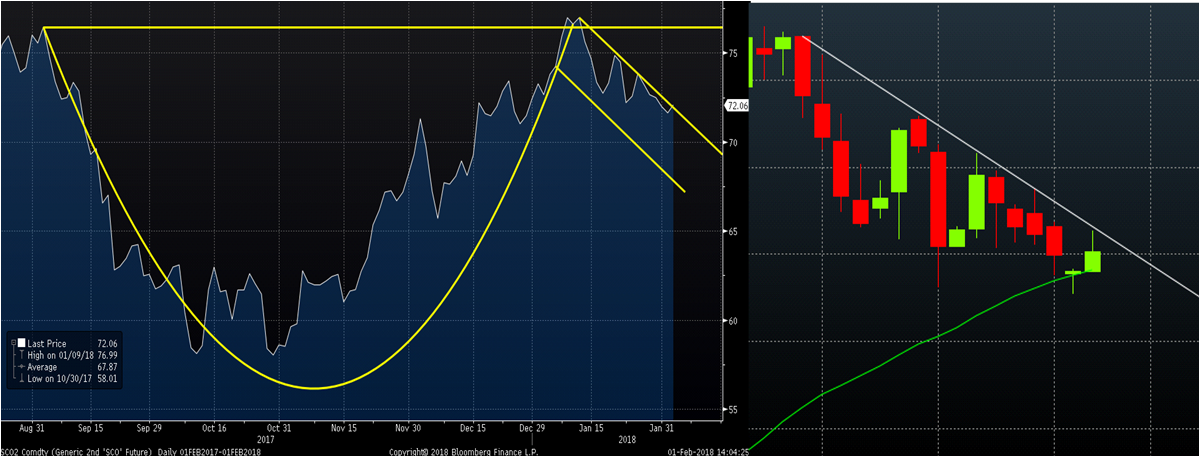
The cup and handle pattern in iron ore discussed two weeks ago is still alive, but it better get going or the pattern will begin to fall apart. The chart on the right zooms in on the handle part of the left chart. Two days ago, a hammer pattern was formed and then was confirmed by a nice move higher in the final hour of trading. A confirmed hammer can indicate the reversal of a downtrend. Keep your eye on iron ore because if it starts to rally, it will break through this very short-term down trend and the next stop would be the resistance at the top of the cup.
SGX 2nd Month Iron Ore Future