Market Data

January 18, 2018
New SMU Research: Cold Rolled Sheet Imports with Product Detail
Written by Tim Triplett
Premium subscribers to Steel Market Update receive reports on imports with macro data broken down by product at the national level. SMU also provides reports that detail the import tonnage received by district of entry and source nation, available here on our website. This new report from SMU takes the analysis even further.
Using U.S. International Trade Commission (USITC) data, SMU has taken the tonnage of cold rolled sheet that arrives in each district monthly and year-to-date and has broken it down into four gauge ranges and whether it was coil or leveled. It then identifies how much was high strength and how much was annealed.
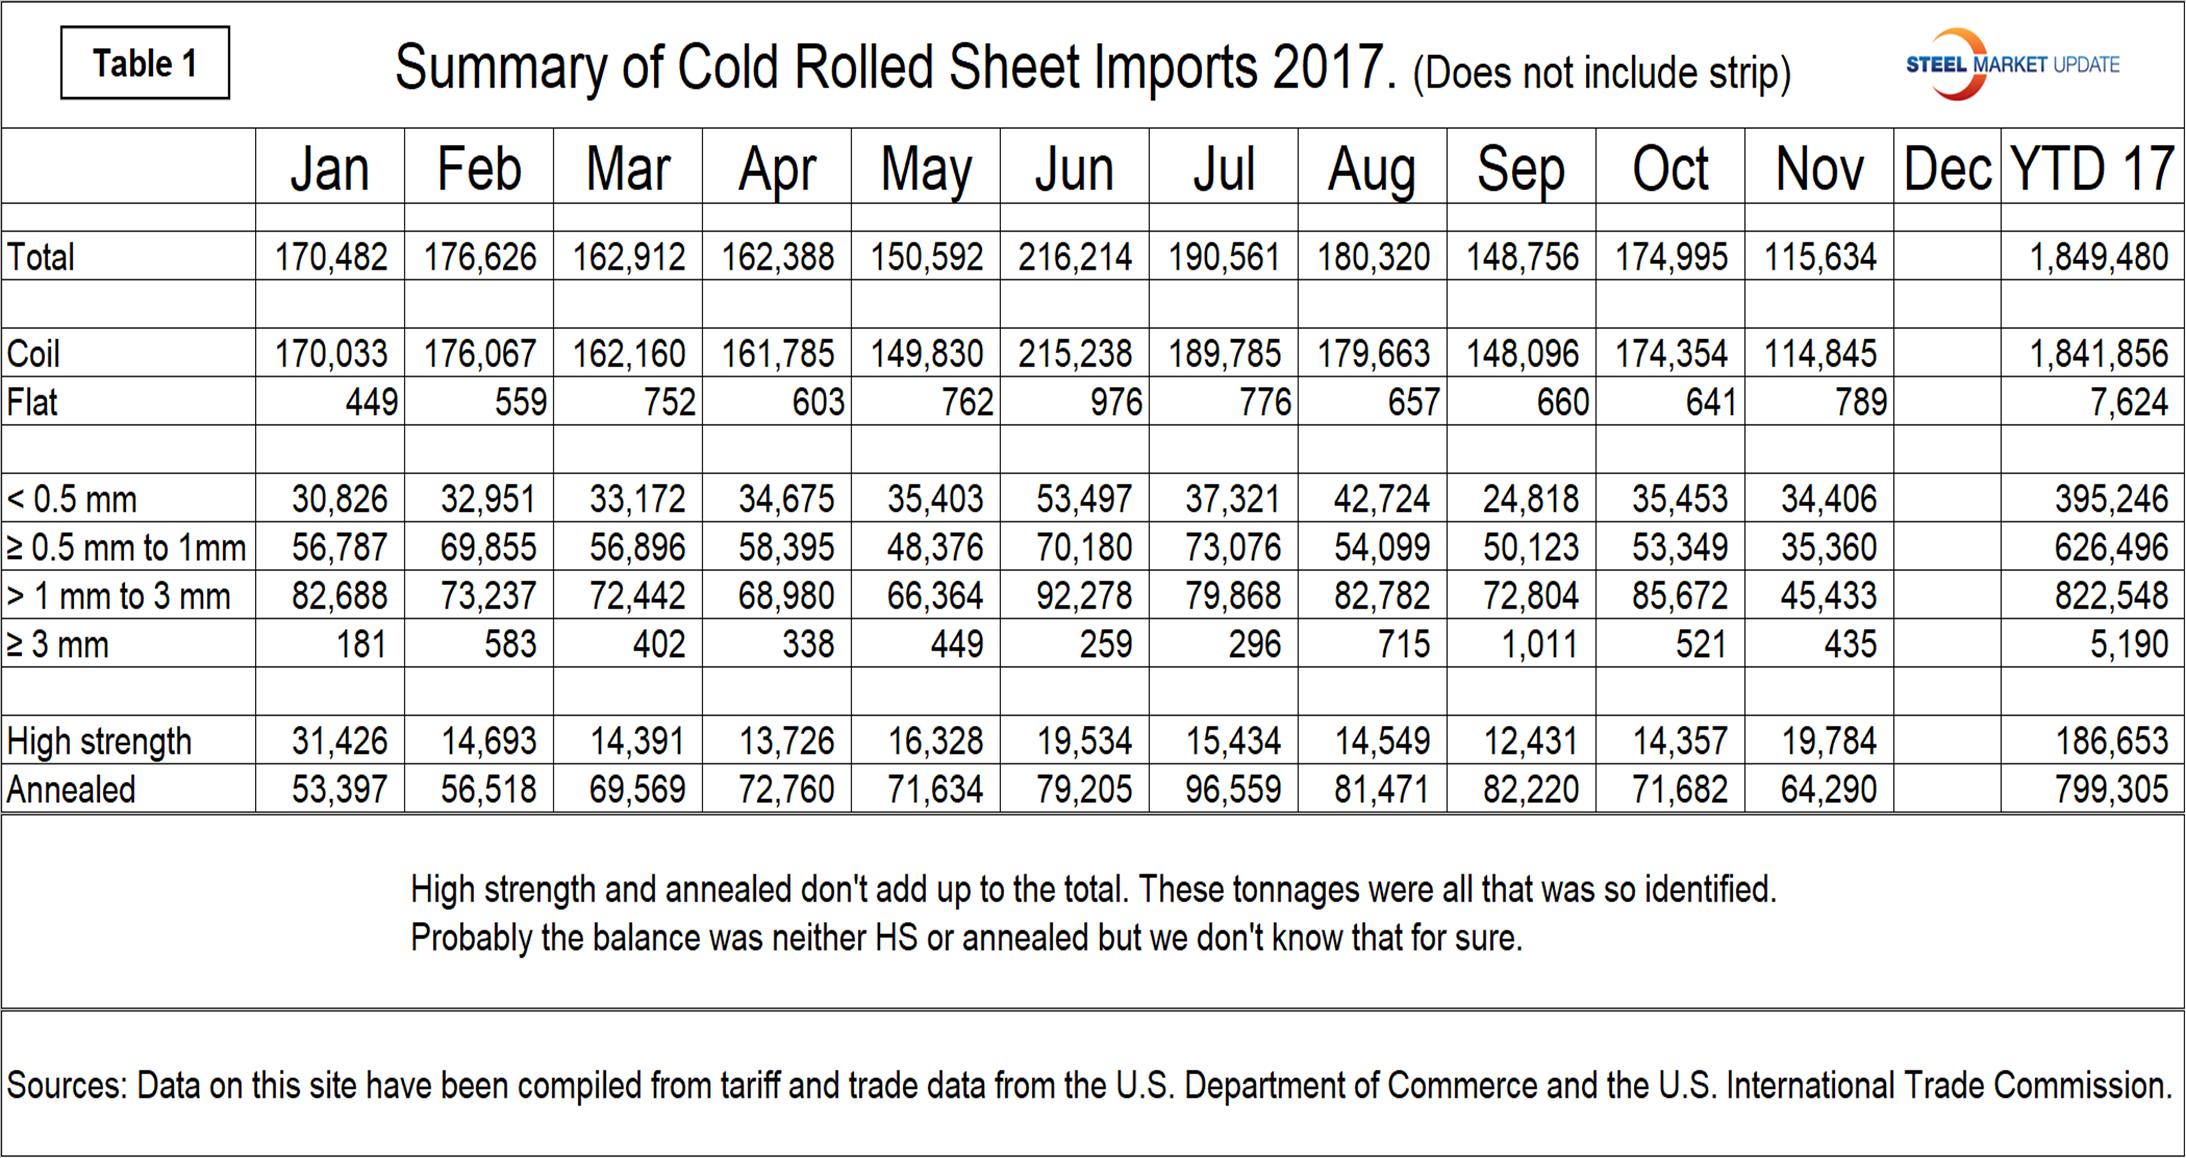
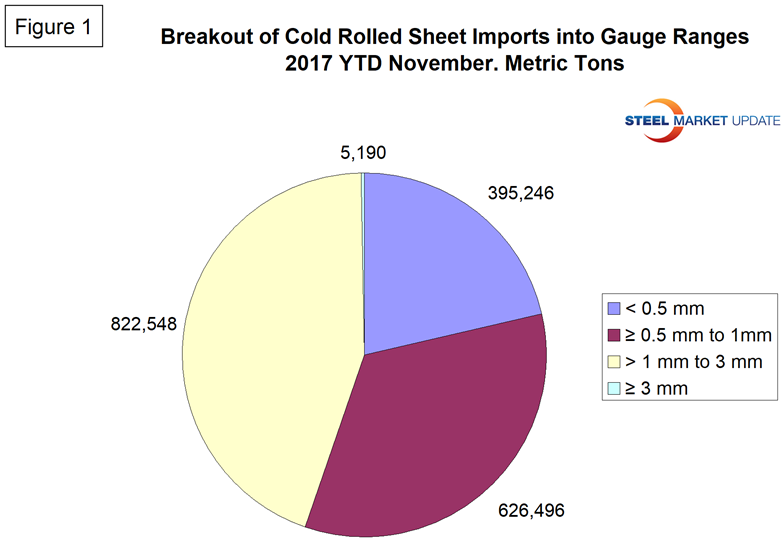
Table 1 (click to enlarge) shows a summary of the data. The split between coil and flat was 99.6 percent to 0.4 percent. The four gauge ranges identified in the USITC database and in increasing thickness broke out to 21.4 percent, 33.9 percent, 44.5 percent and by 0.3 percent. See Table 1 and pie chart Figure 1 for details. Import data is classified as high strength and annealed, and we have reported on the tonnage of these two conditions. Some material was both high strength and annealed. Over half the tonnage year to date was neither of these and therefore was presumably full hard commercial quality sheet.
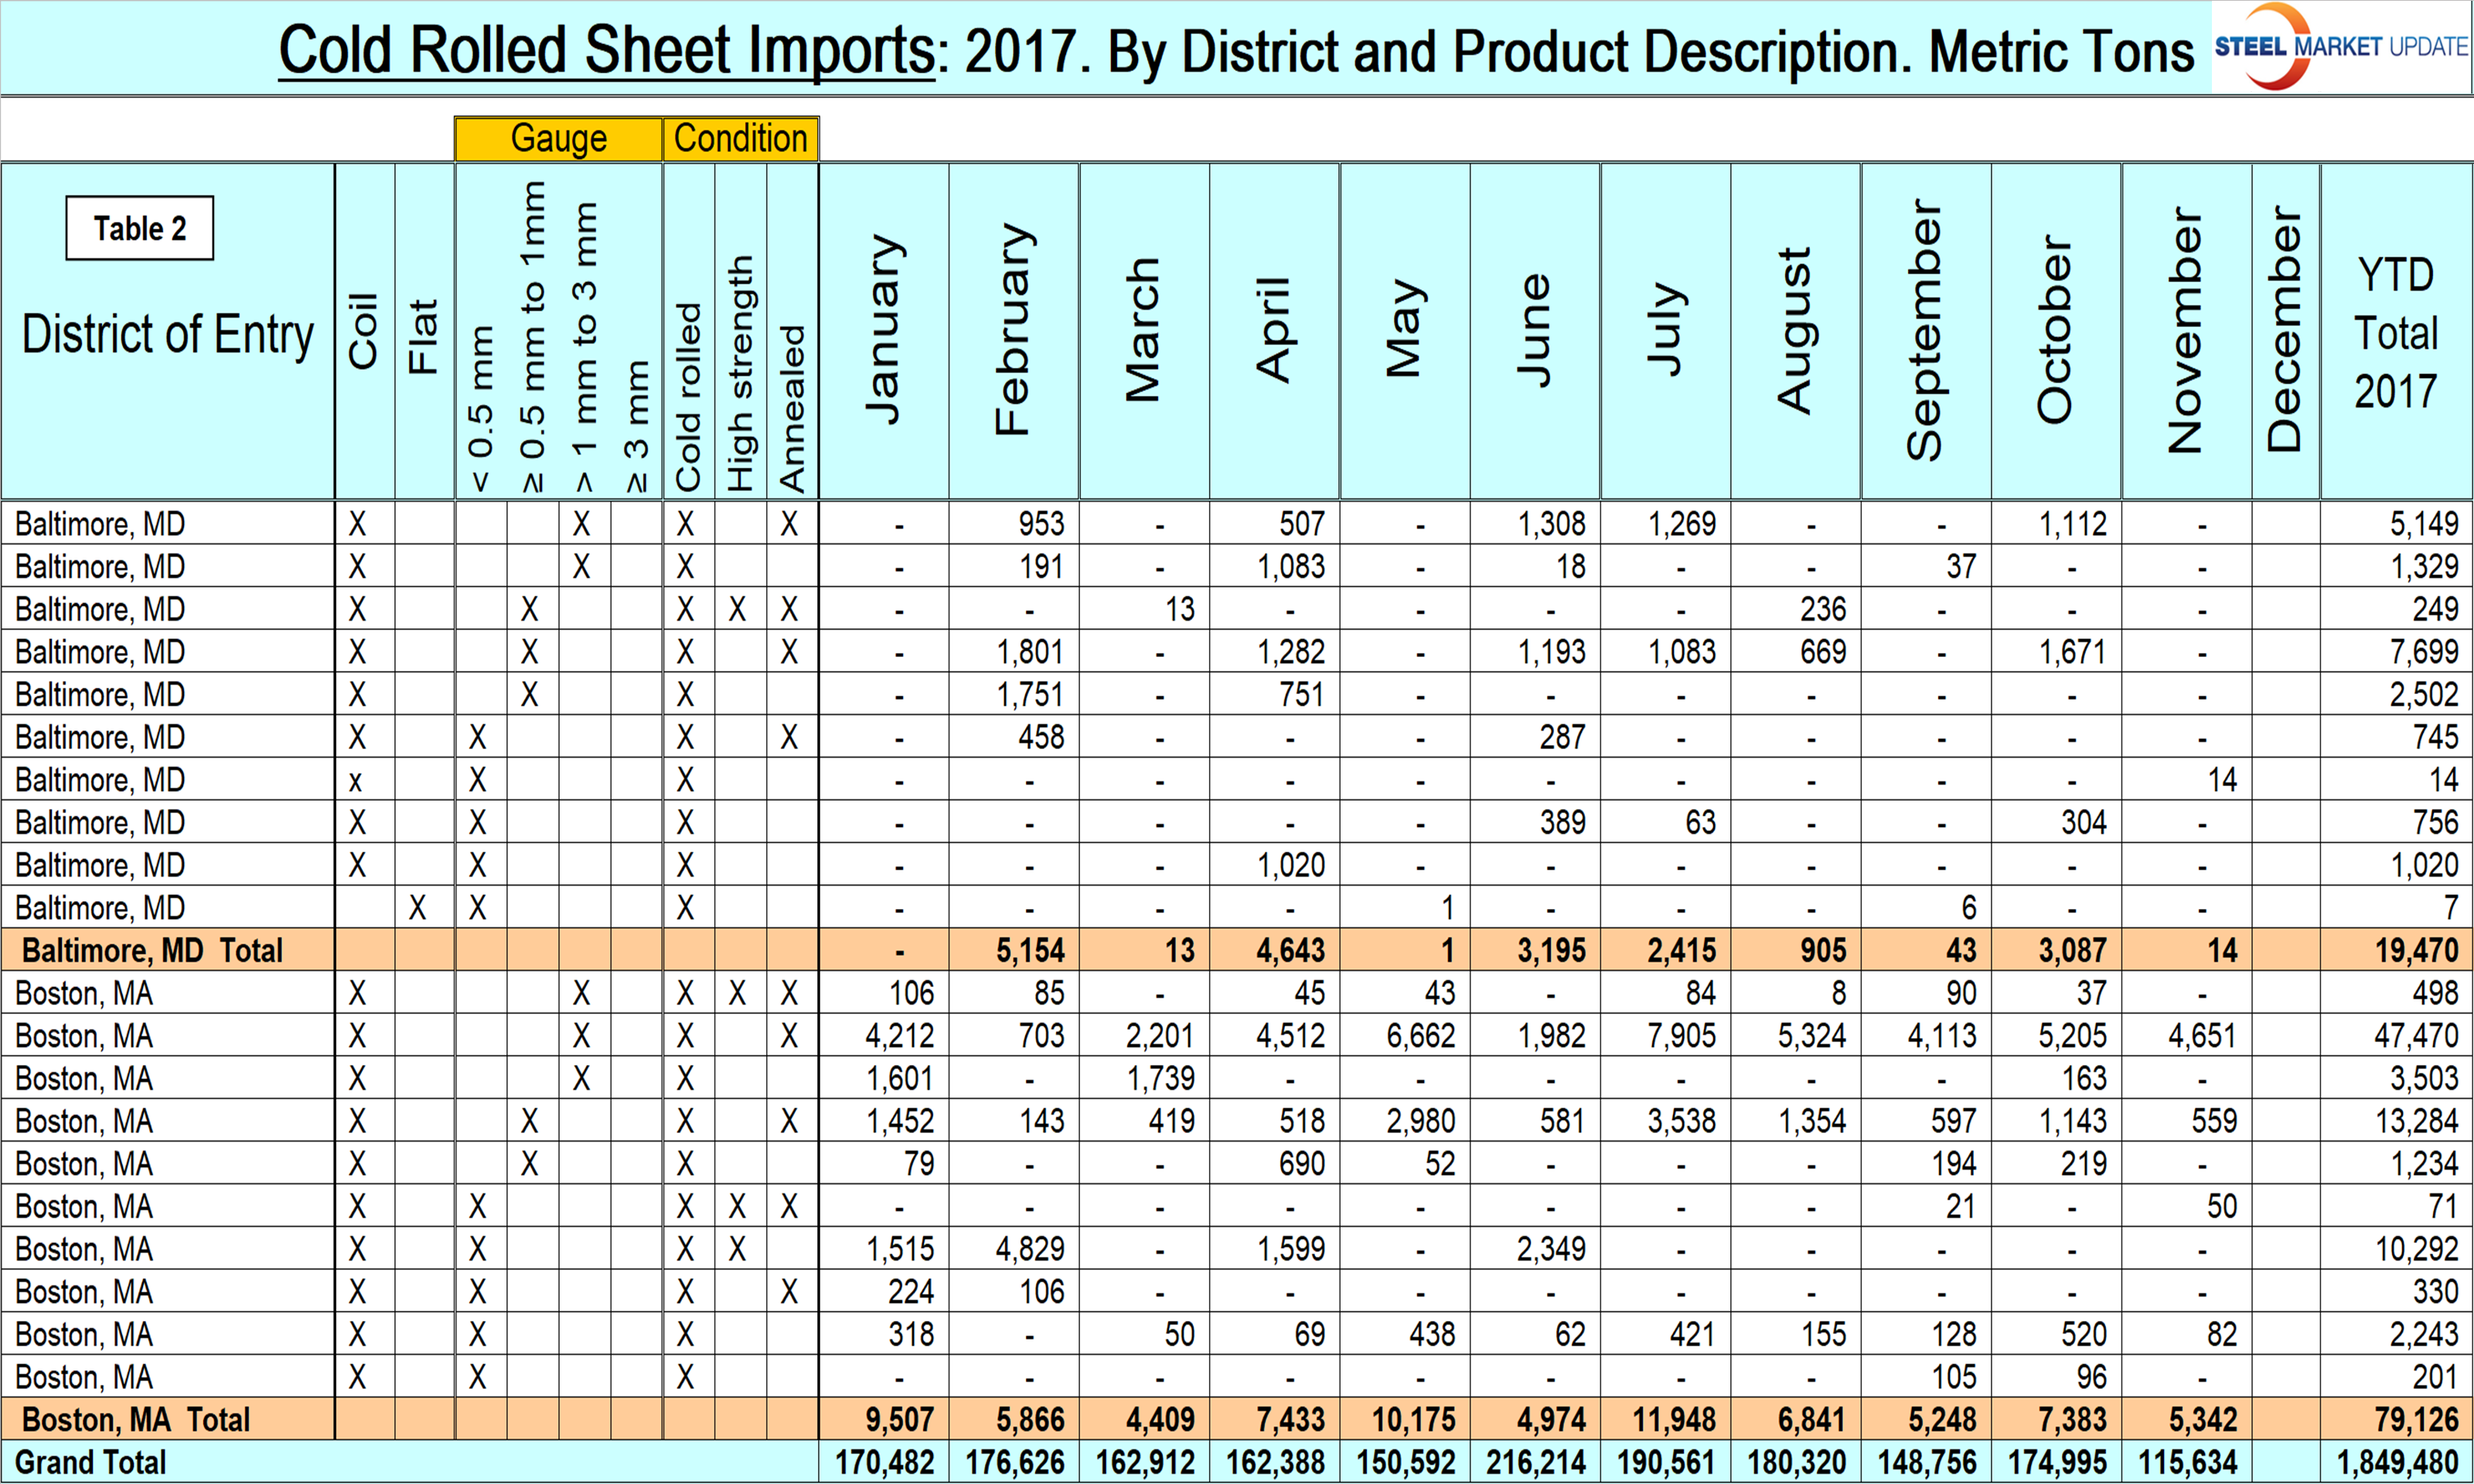
Table 2 (click to enlarge) is an extract from the analysis and describes the imports that came into Baltimore and Boston monthly and year-to-date through November 2017. Premium subscribers can access the whole data series on our website.
Examples of what the data shows are as follows:
- In 2017 year-to-date, the highest volume item entering Baltimore was in the thickness range 0.5 to 1 mm annealed.
- The largest volume item entering Boston was 1.0 to 3.0 mm thick, annealed.
SMU Comment: It’s one thing to know the volume of CR sheet that entered your district from offshore, but it’s entirely another to know the characteristics of that material and whether it competed with your business. Also, knowing what the material was not could provide valuable information about the volume of imports that do compete with your business. For example, it could be that 80 percent of the material that entered your district was irrelevant in terms of your business. We hope you find this type of analysis useful in managing your company and in negotiating with your suppliers. We welcome your comments before going too far down this road with a similar analysis of coated sheet and plate products.
An excel file associated with this data can be accessed by clicking here.
Note: This data was accessed through the USITC database. All steel traded globally is classified by the Harmonized Tariff System (HTS). The HTS code has 10 digits. The first six are globally universal. The last four are at the discretion of the nations involved in a particular transaction. For example, the U.S. has used the last four digits to define the product in a specific way. The EU uses the last four digits for its own ideas of product classification.
Cold Rolled Strip vs. Sheet Imports
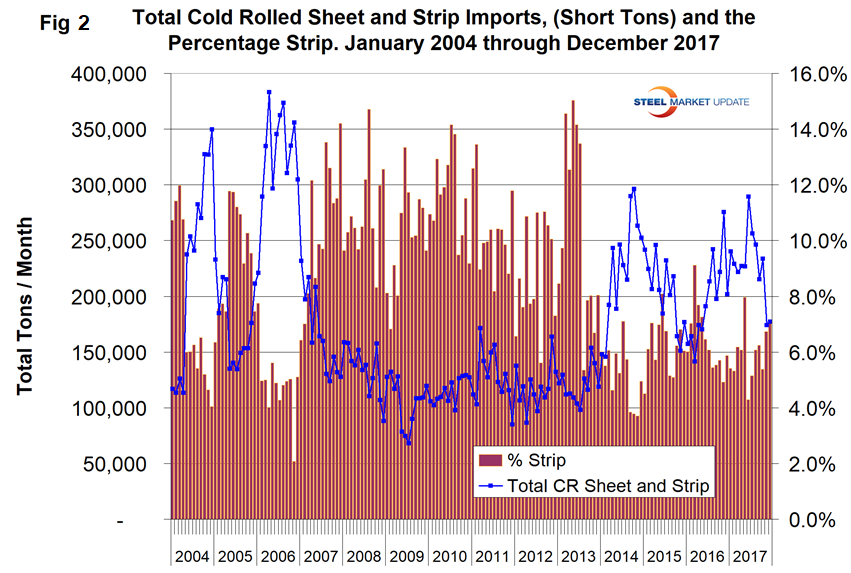
Cold rolled data is more complex to analyze because of the plethora of widths and gauges. Since cold rolled strip (slit coils) is a value-added derivative of cold rolled sheet (master coils), we examined whether strip imports were replacing sheet imports over time. In fact, the opposite has occurred (Figure 2). Between 2007 and mid-2013, cold rolled strip accounted for about 10 percent of total cold rolled imports. Since mid-2013, strip’s percentage has declined to less than 6 percent.
SMU Comment: In the wire rod business, the tonnage of drawn wire imports is now more than half the tonnage of hot rolled rod imports, which has severely eaten into the U.S. wiredrawer’s business. Should the same change occur in the cold rolled market, coil processors would find their market shrinking. We are happy to report that at present coil processing is not under threat.


