

Market Data

January 11, 2018
Shipments and Supply of Sheet Products through November
Written by Peter Wright
U.S. demand for steel sheet products continued to expand through November, according to Steel Market Update’s analysis of data from the American Iron and Steel Institute (AISI) and the U.S. Department of Commerce.
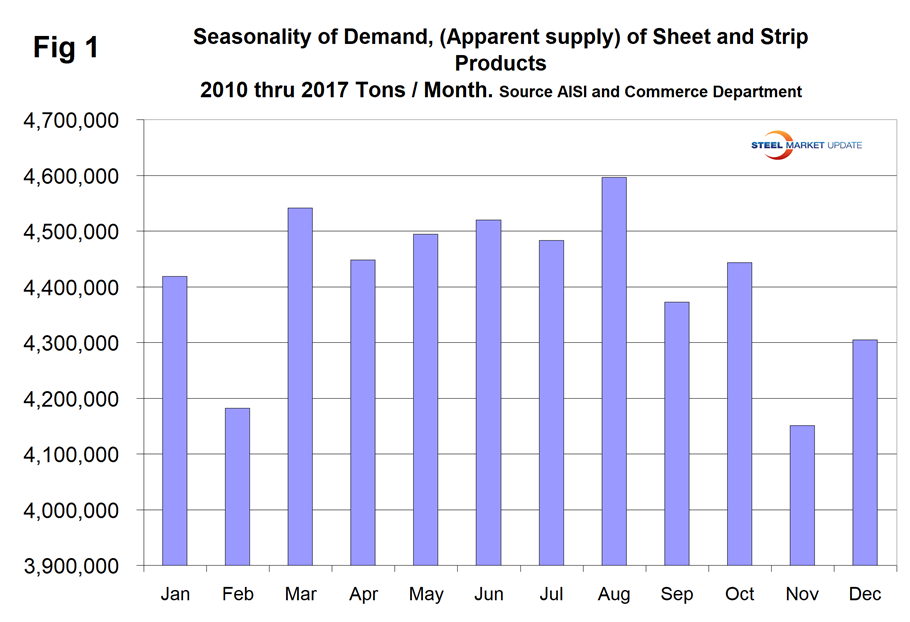
Apparent supply is a proxy for market demand. Demand momentum for sheet products in total was negative in the three months through November, but individual products varied. The overall negativity was partly a seasonal effect; on average since and including 2010 sheet supply in November has been down by 6.6 percent. This year the decline was 5.2 percent, therefore better than normal.
Figure 1 shows the seasonality that has existed since January 2010. Hot dipped and electrogalvanized had positive momentum in November. HR and CR had negative momentum. Other metallic coated (mainly Galvalume) continued the dramatic slowdown that began in October after three months of very strong growth. Note, negative momentum means that growth is slowing, not that growth is contracting.
This report summarizes total steel supply by product from 2003 through November 2017 and year-on-year changes. It then compares domestic mill shipments with total supply to the market. It quantifies market direction by product and enables a side-by-side comparison of the degree to which imports have absorbed demand.
Table 1 describes both apparent supply and mill shipments of sheet products (shipments includes exports) side by side as three-month averages through November with year-over-year growth rates for each. Comparing the year-over-year time periods, total supply to the market increased by 3.2 percent and mill shipments were up by 5.6 percent.
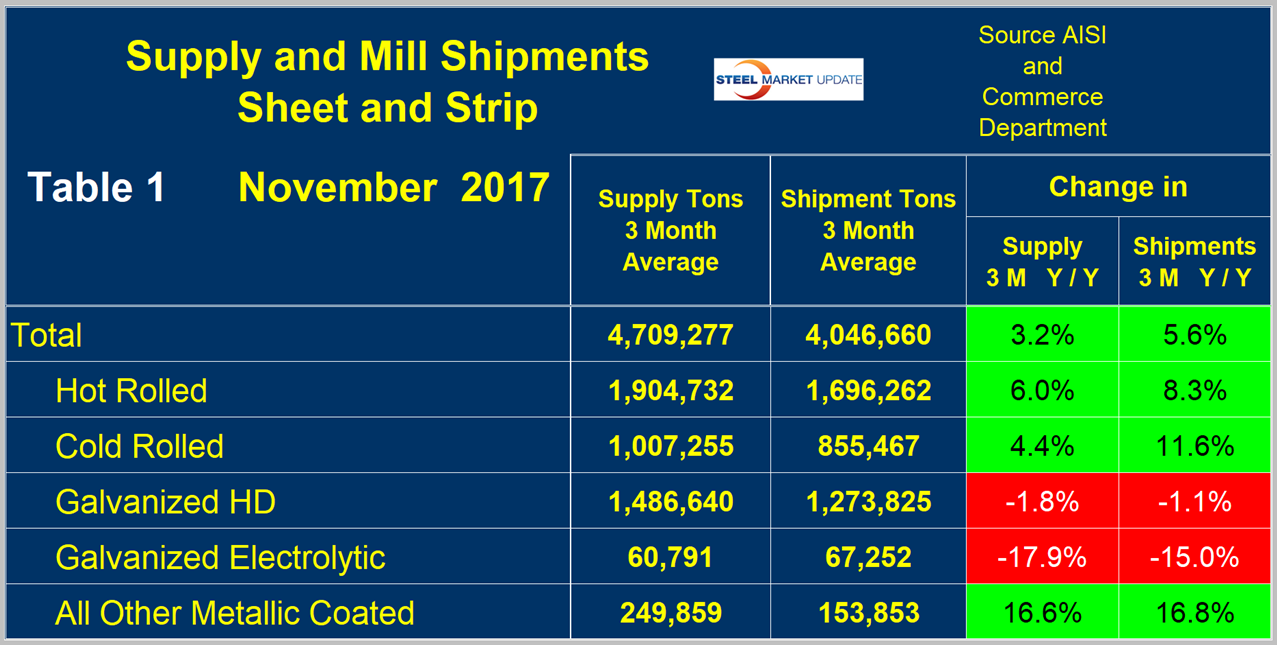
The fact that mill shipments were up by more than supply means that imports were less of a factor in the market compared to the same three months last year. Table 1 breaks down the total into product detail and shows that the effect of less import pressure was particularly strong for cold rolled. This was a reversal of what we saw for cold rolled in our October update. A review of supply and shipments separately for individual sheet products is given below.
Apparent Supply
Apparent supply is defined as domestic mill shipments to domestic locations plus imports. In the three months through November 2017, the average monthly supply of sheet and strip was 4.709 million tons, up by 2.8 percent year to date but down by 2.4 percent in the three months through November compared to three months through August. There is no seasonal manipulation of any of these numbers. By definition, year-over-year comparisons have seasonality removed, but 3M/3M comparisons do not. Table 2 shows the change in supply by product on this basis through November.
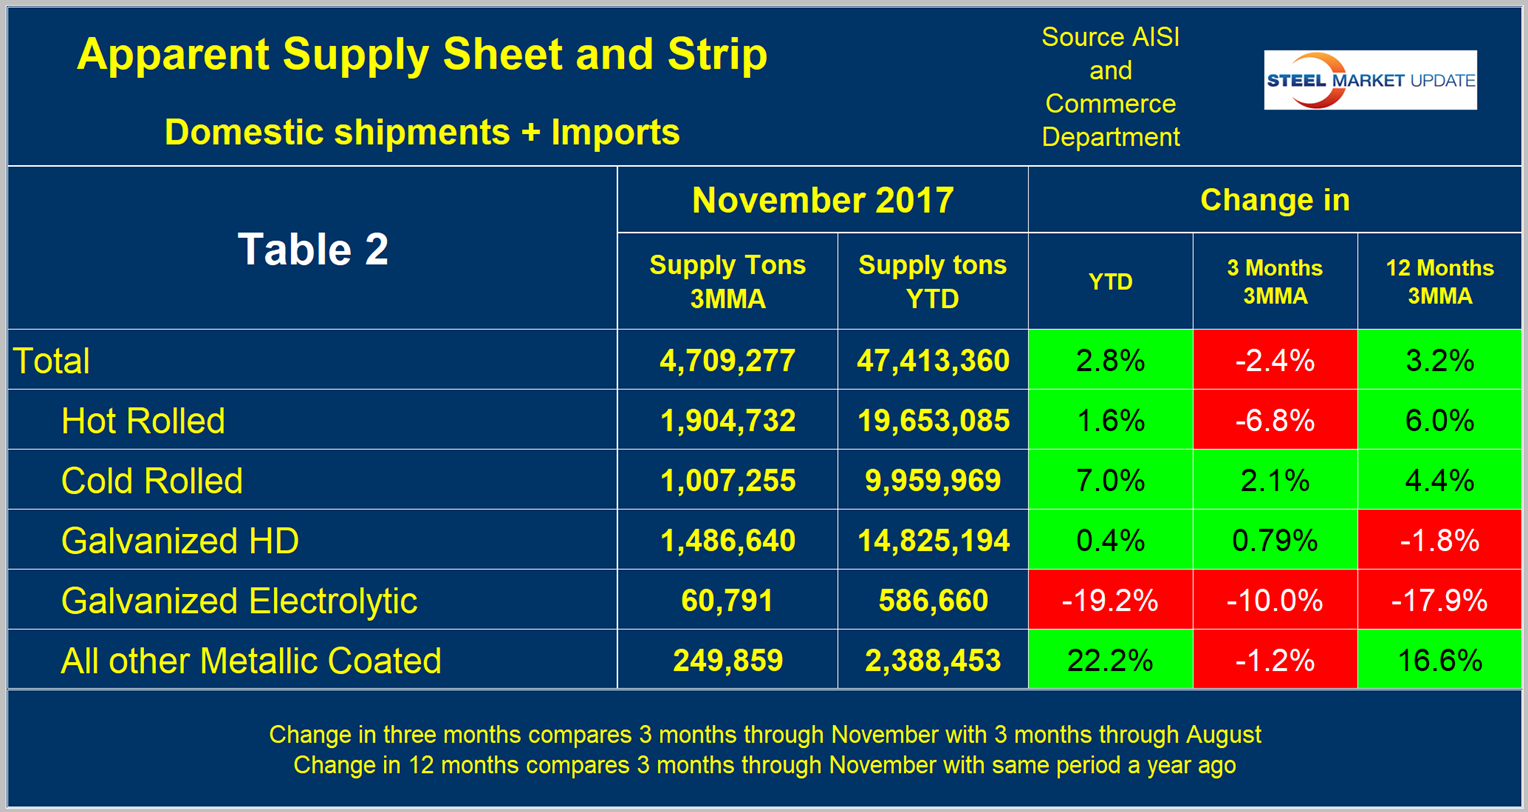
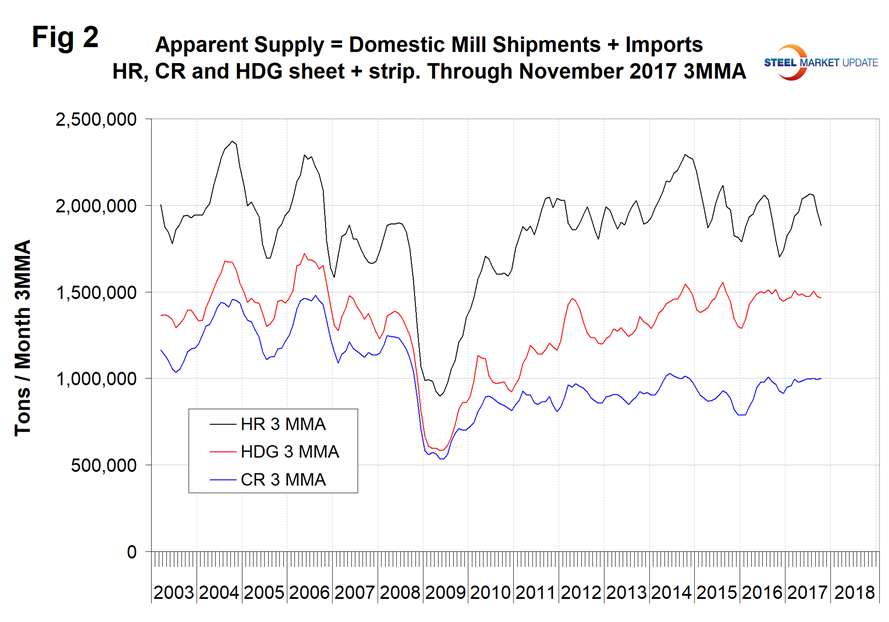
Figure 2 shows the long-term supply picture for the three major sheet and strip products, HRC, CRC and HDG, since January 2003 as three-month moving averages.
Mill Shipments
Table 3 shows that total shipments of sheet and strip products including hot rolled, cold rolled and all coated products increased by 3.2 percent year to date, but were down by 5.4 percent in three months through November compared to three months through August. The negative growth in three months through November compared to three months through August is largely a seasonal effect as described above. Other metallic coated has had very strong shipment growth year to date.
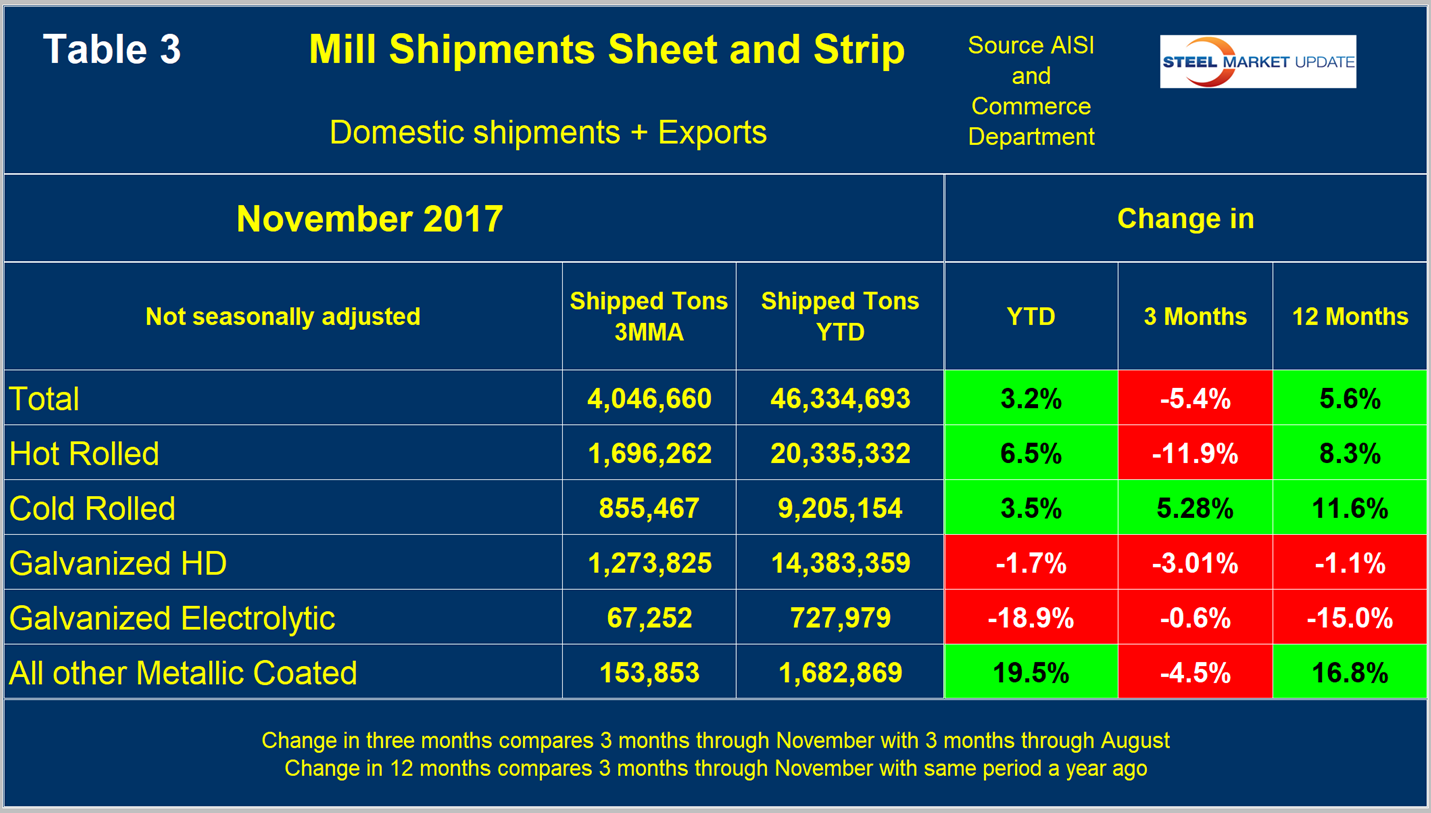
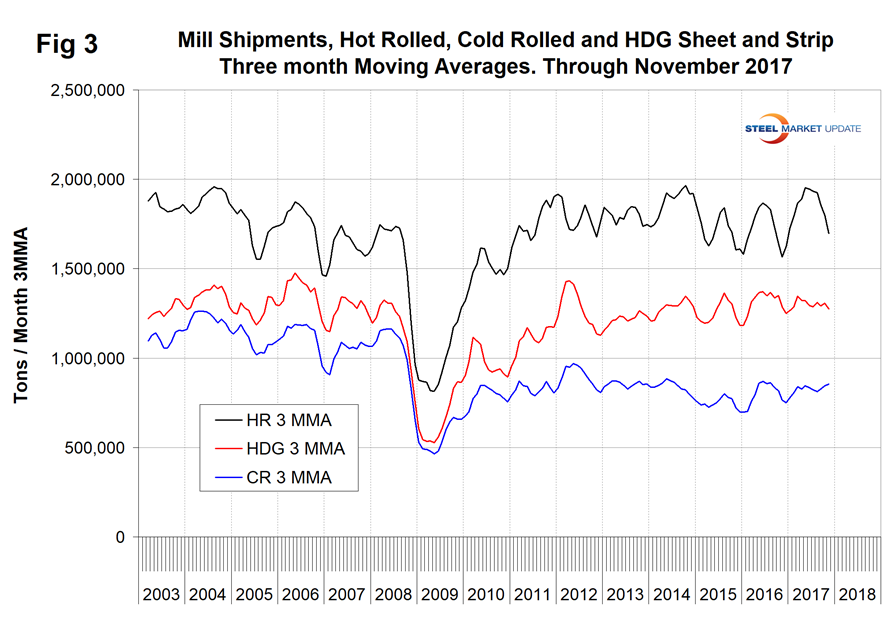
Figure 3 puts the shipment results for the three main products into the long-term context since January 2003.
SMU Comment: One problem with this data is that it’s now well into January and the latest information we have for shipments and supply is for November. AISI puts out weekly data for crude steel production, the latest for which was the week ending Jan. 6. This provides the most current data for steel mill activity. Figure 4 shows the year-over-year change in weekly crude output on a four-week moving average basis.
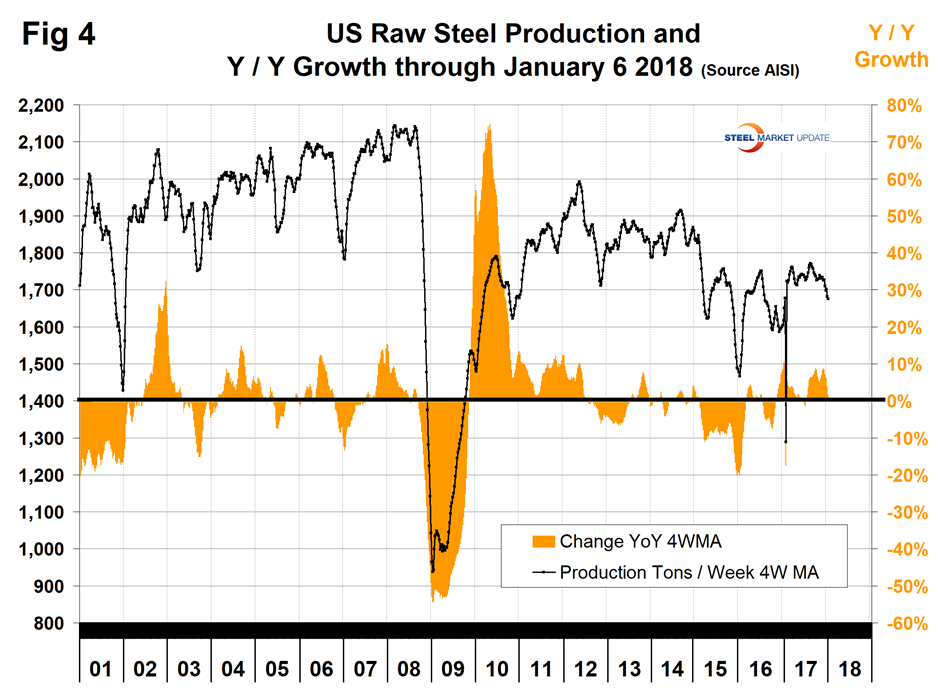
Growth became positive year-over-year in the week ending July 15 and was greater than 5.0 percent every week from July 29 through Dec 23. Growth slowed to 1.5 percent year-over-year in the week ending Jan.6. Imports of sheet products surged to over a million tons in June, July and August, but fell back to 879,000 tons in November. Licensed volume in December continued to decline and fell to 701,000 tons. Based on the strength of the economic indicators analysis that SMU performs and our proprietary measure of buyer sentiment, we are expecting demand for sheet products to continue to increase in the first quarter of 2018.


