

Prices

December 21, 2017
Hot Rolled Futures: Ferrous Futures in Rally Mode
Written by David Feldstein
The following article on the hot rolled coil (HRC) futures markets was written by David Feldstein. As the Flack Global Metals Director of Risk Management, Dave is an active participant in the hot rolled futures market, and we believe he provides insightful commentary and trading ideas to our readers. Besides writing futures articles for Steel Market Update, Dave produces articles that our readers may find interesting under the heading “The Feldstein” on the Flack Global Metals website, www.FlackGlobalMetals.com. Note that Steel Market Update does not take any positions on HRC or scrap trading and any recommendations made by David Feldstein are his opinions and not those of SMU. We recommend that anyone interested in trading HRC or scrap futures enlist the help of a licensed broker or bank.
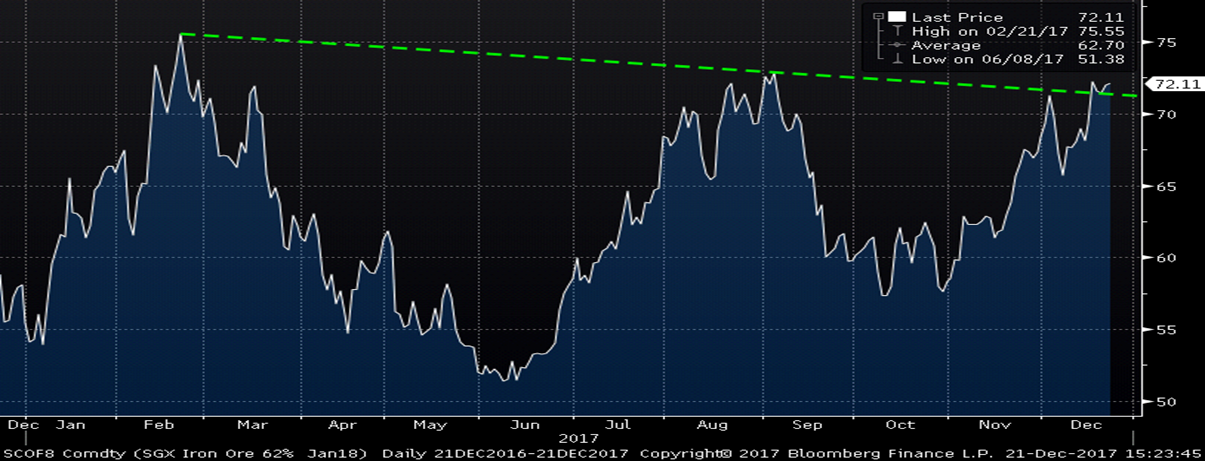
Since we last met two Thursday’s ago, activity in the ferrous futures markets has continued to be fast and furious. The January SGX iron ore future has rallied another $6.39/t or 9.7 percent to $72.11/t in that time. The January SGX ore future’s price has now broken above the downtrend (green line) that began after peaking in late February.
SGX January Iron Ore Future
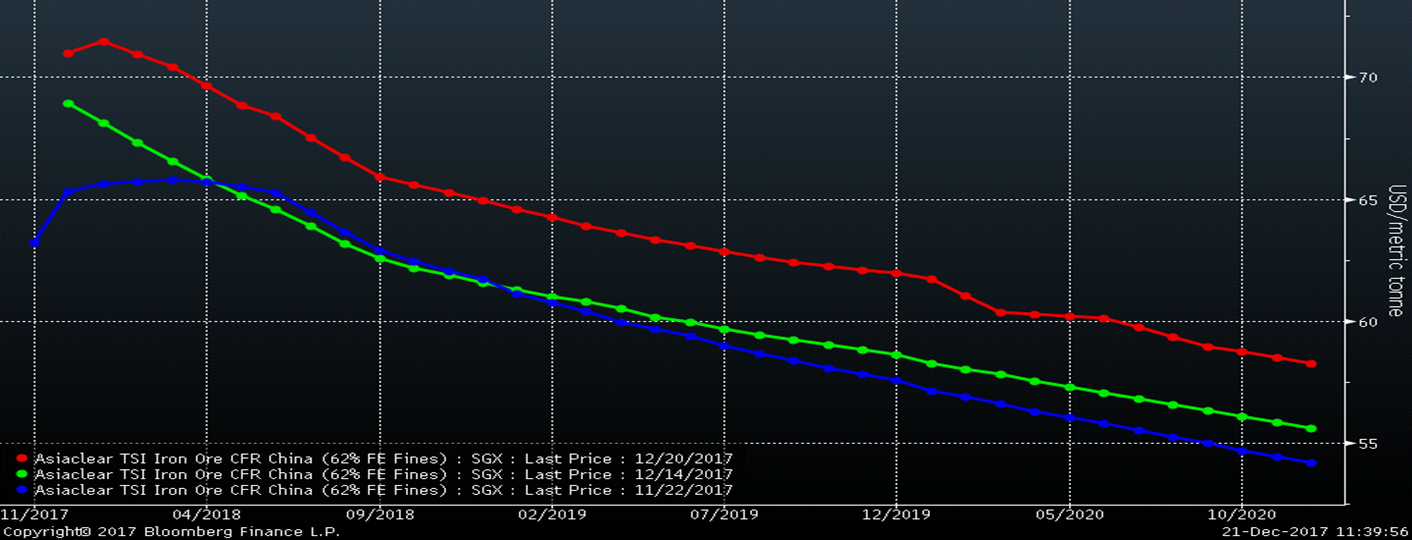
The rally in SGX iron ore futures has also shifted the curve from the unusual flat shape seen a month ago back into the backwardation seen over the past few years.
SGX Iron Ore Futures Curve
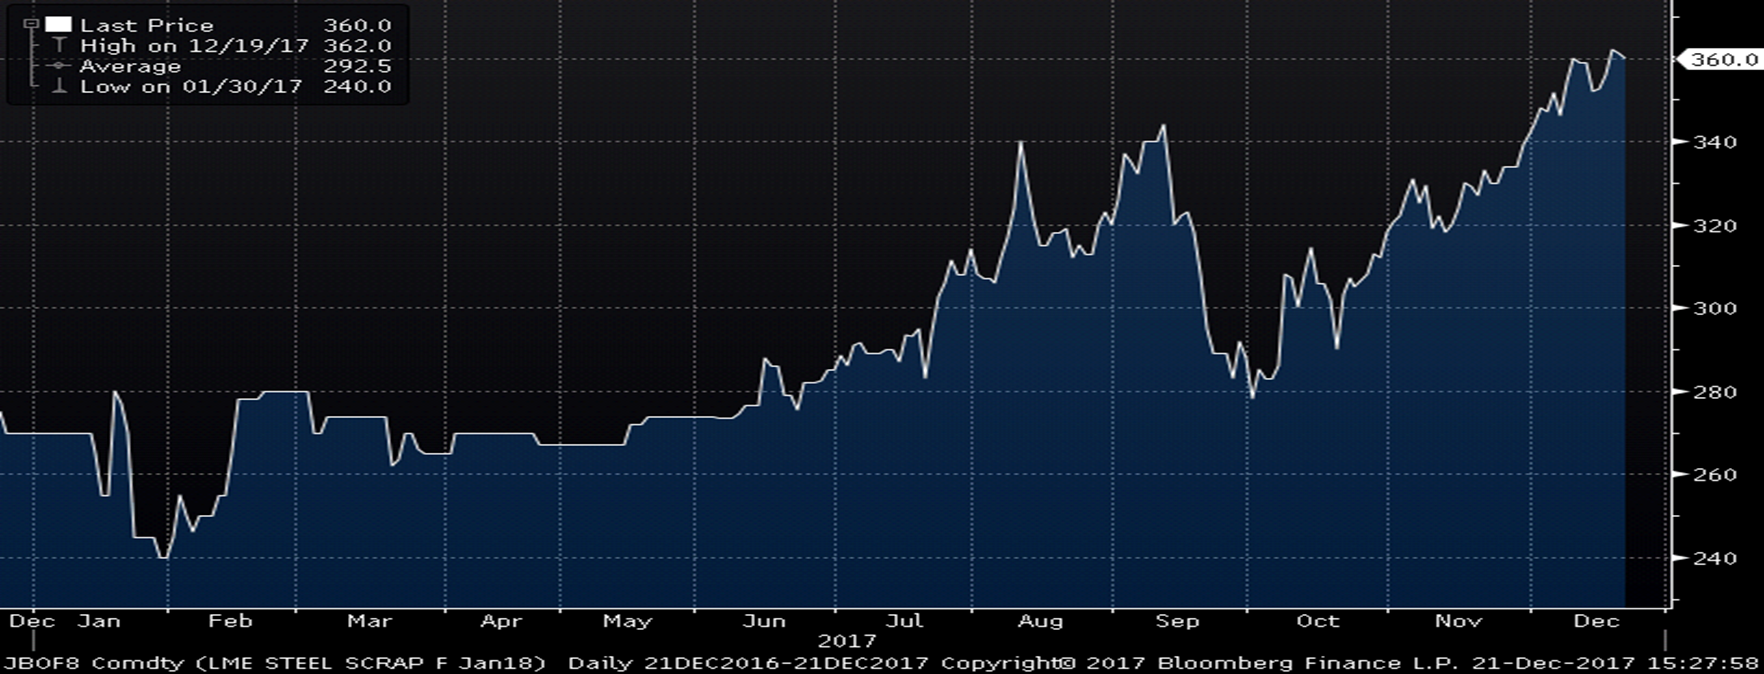
Scrap has also participated in the rally, gaining $14 or 4.05 percent over the past two weeks, settling today at $360/t.
LME January Turkish Scrap Future
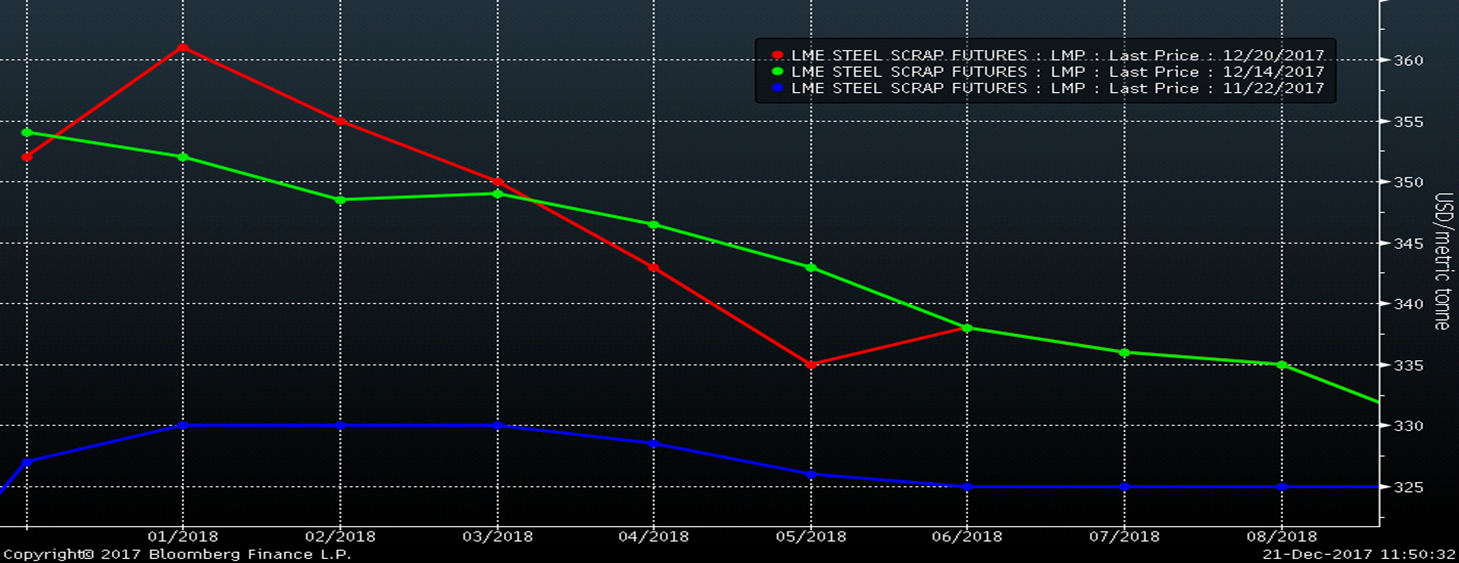
LME Turkish Scrap Futures Curve
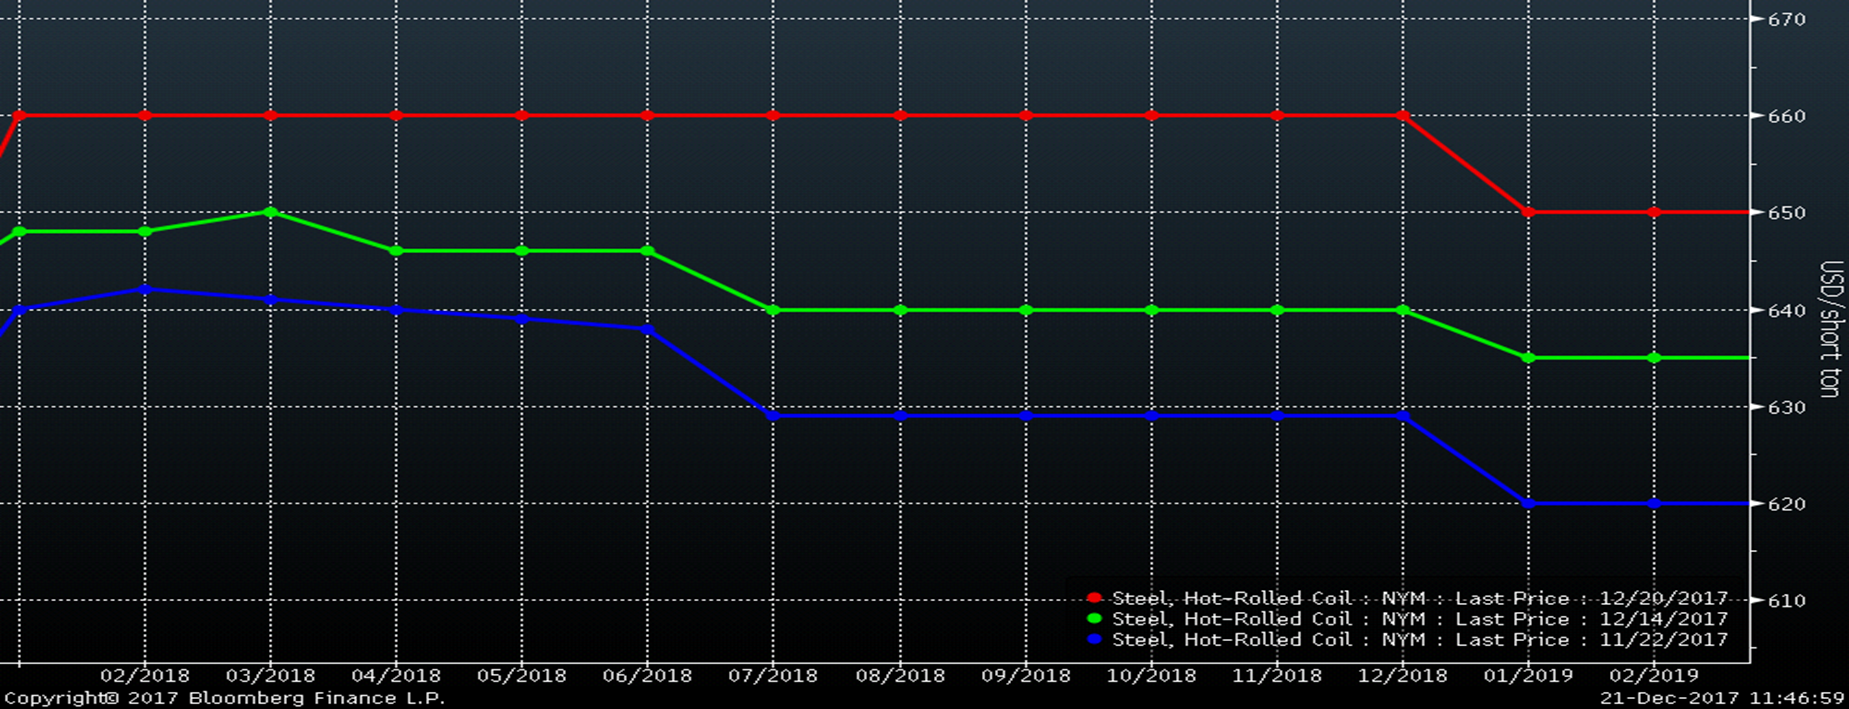
Over the last two weeks, the CME January Midwest HRC future has rallied $15/st or 2.3 percent to $660 and traded as high as $667 a week ago Monday following the $680 price increase announcement from ArcelorMittal. The entire curve has traded higher and is flat with a number of trades at $660 for time periods throughout 2018 and as far out as November.
CME Midwest HRC Futures Curve

In the last couple articles, we’ve been monitoring the development of an “inverse head and shoulders” pattern in the chart of the rolling 2nd month HRC futures. An “inverse head and shoulders” pattern is a bullish breakout pattern. If it develops and then the price breaks through the neck line, it could indicate a big rally to follow.
Here is an example:
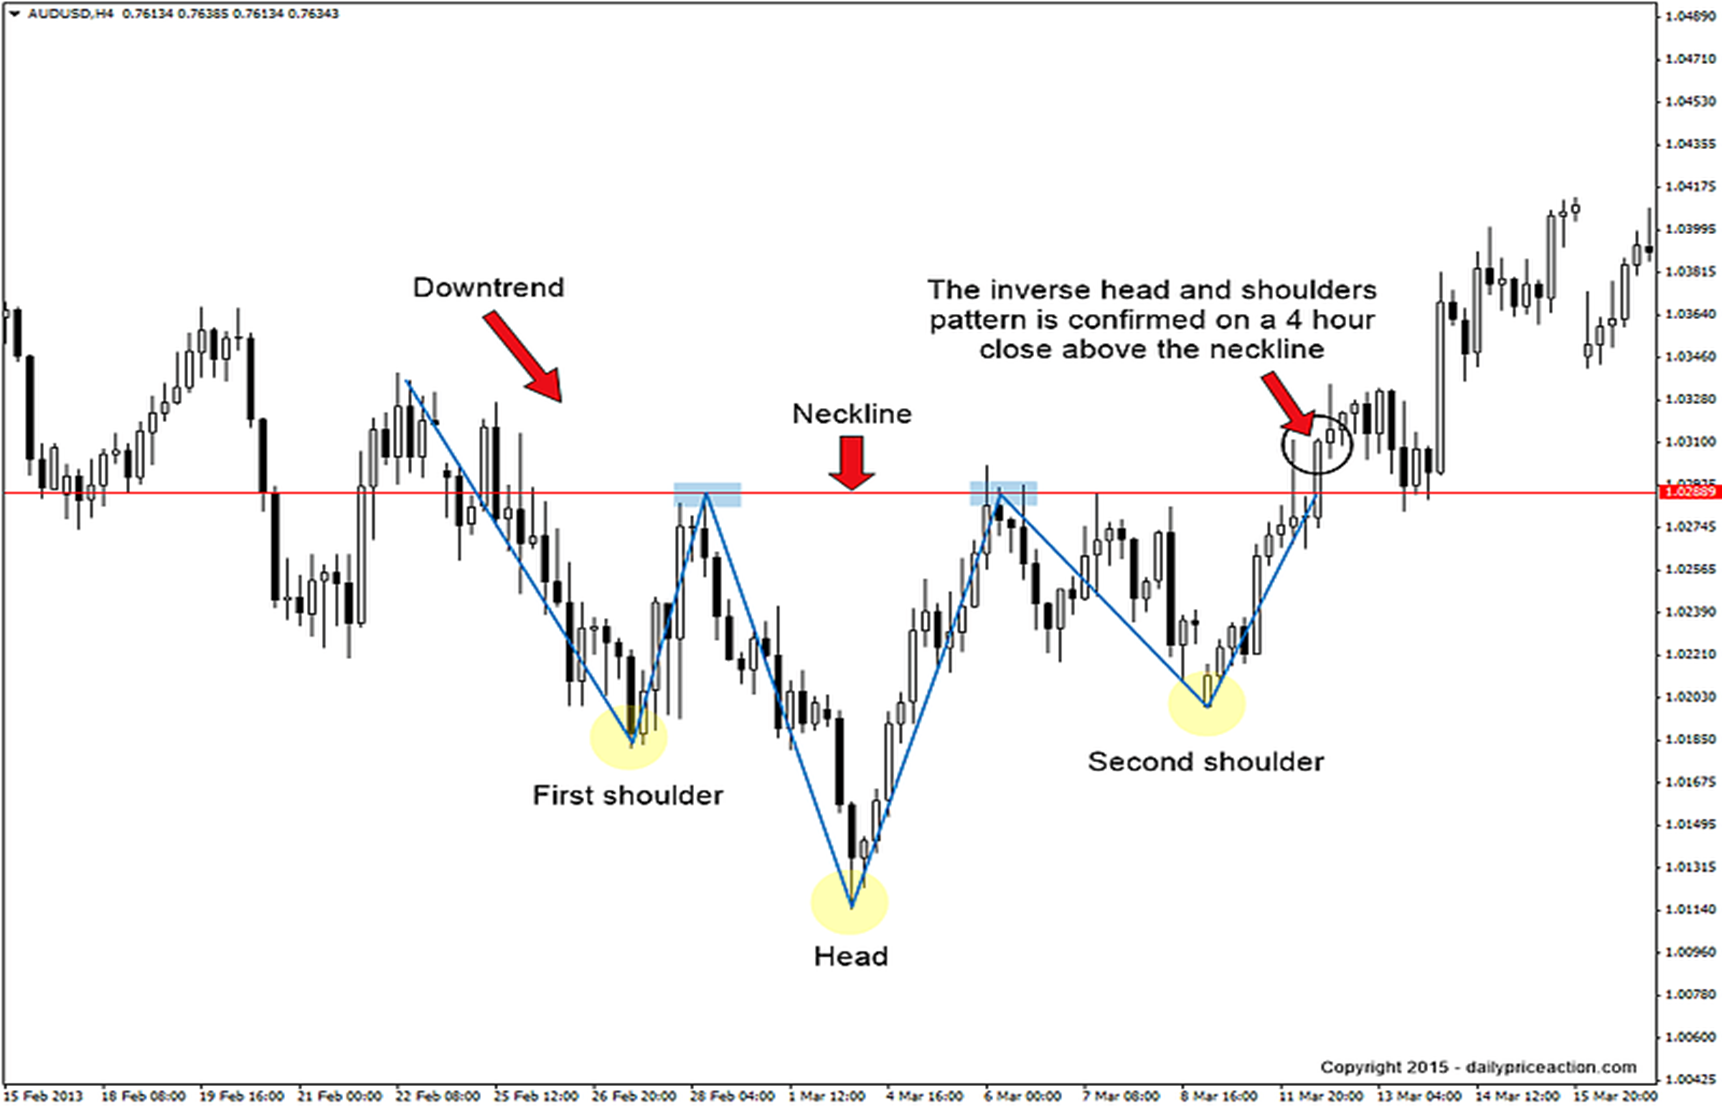
For more info about the pattern: http://www.investopedia.com/terms/i/inverseheadandshoulders.asp
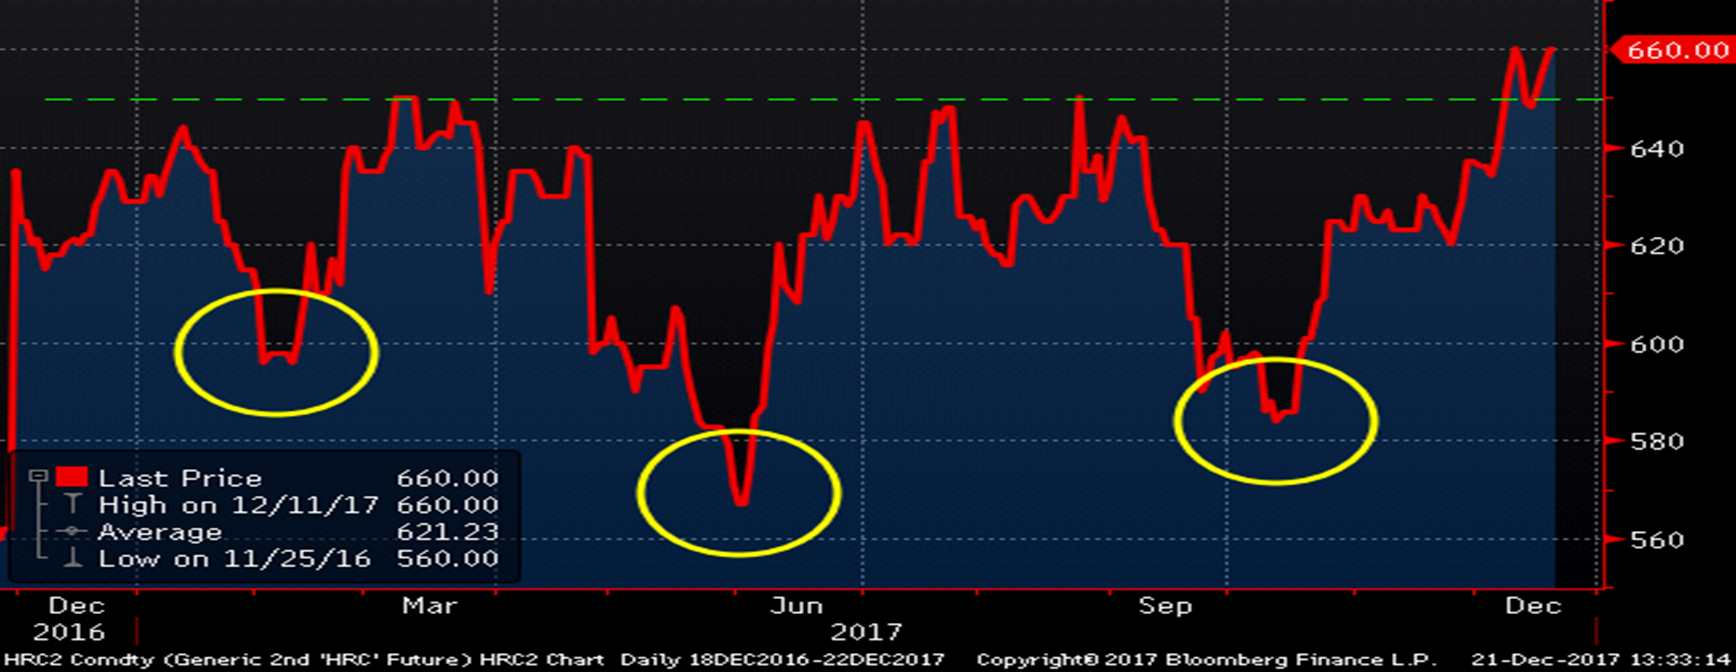
The two charts below are of the rolling 2nd month HRC futures price. The 2nd month “rolling” futures is created by combining each of the 2nd month futures contracts through time. For instance, during the month of November, it is the December future. If the rolling 2nd month HRC future price breaks above the $650 “neckline,” this chart pattern indicates a significant rally to follow.
As indicated above, the ArcelorMittal price increase announcement resulted in the January future trading as high as $667, almost $20 above the $650 neckline. Since then, prices have traded and settled above $650 multiple times. The neckline has undoubtedly been breached. Stay tuned to see if there will be a big first-quarter rally in HRC. The fundamentals have been strong all year and now the technicals are indicating it’s time for a big rally.
CME Midwest 2nd Month Rolling HRC Future
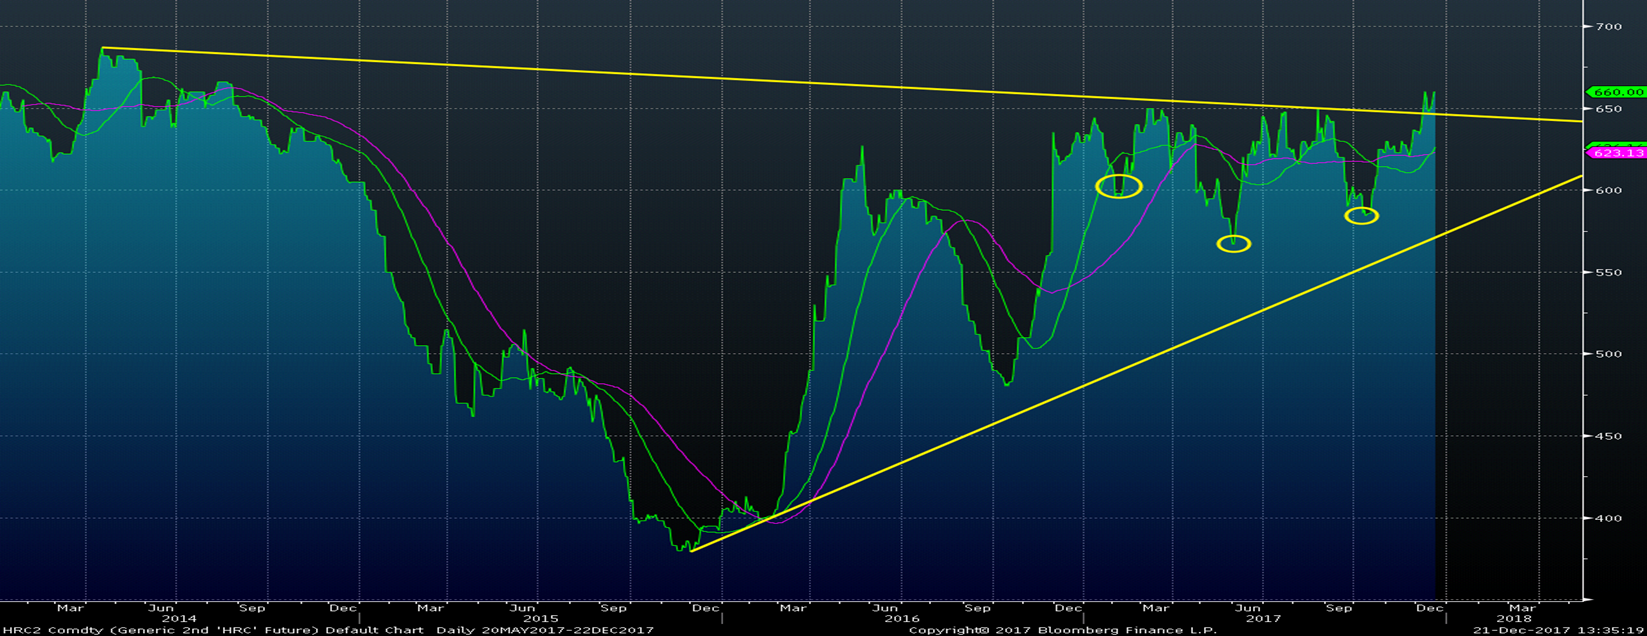
The chart below provides a second and longer-term bullish signal in a pattern called a triangle. This pattern is created when both a downtrend and uptrend line can be drawn forming a triangle. As the price pushes into the apex, price action consolidates and volatility compresses like a coiled spring. According to the pattern, once the price breaks through one of the trends, it should be followed with strong momentum. The 2nd month future has now broken above the downtrend line providing another bullish indication.
CME Midwest 2nd Month Rolling HRC Future
The opportunity might present itself in HRC futures at any time, so pay close attention to the rally in the CME Midwest HRC futures, keep your local broker on speed dial and remember Ferrous Bueller’s philosophy…
“Life moves pretty fast. If you don’t stop and take a look around once in a while, you could miss it.”


