Market Data

December 21, 2017
Global Scrap Trade: Will China Resume Exports?
Written by Peter Wright
Since the Chinese government put a stop to all exports of steel scrap, analyzing the global scrap trade has become a bit more complicated.
Steel Market Update performs this analysis of the world scrap market each quarter to help readers understand the gyrations of the domestic scrap market and where the U.S. stands as a global player. Some nations are slow to report, which results in our analysis being a quarter in arrears, but we believe it still gives a valuable perspective of global trends. All tonnages in this report are metric.
China became a net scrap exporter in the third quarter of 2017, according to Chinese trade administration data. In our global scrap trade analysis for Q3 2017, we stated: “By the end of this decade, we expect a huge disruption of the global scrap market as China’s scrap collection industry catches up with the rate of scrap generation. About 93 percent of China’s steel is currently manufactured in basic oxygen furnaces. Therefore, until they evolve an appropriate mix of BOF/EAF capacity, scrap will be exported in huge volumes.” When data was released for Q4 2017 and then for Q1 2018, we were surprised to see that our conclusion seemed to be premature because China’s reported scrap exports declined by 23 percent and then by another 80 percent. We now have data for Q2 2018 when China’s reported scrap exports were zero (Figure 1).
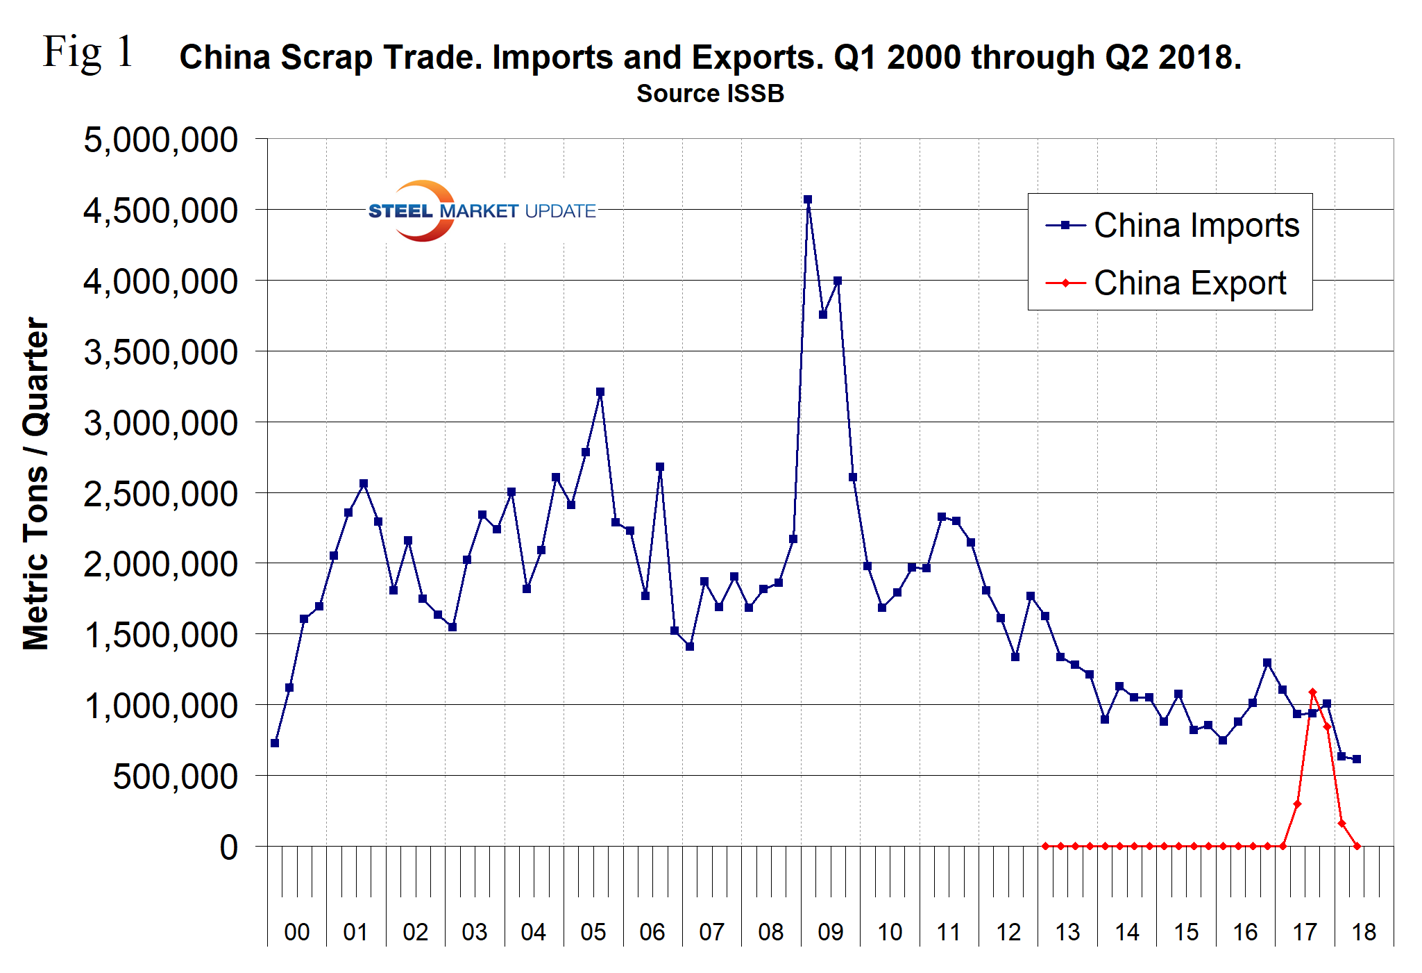
This month, one of our trading contacts in China threw new light on the scrap export situation. He informed us that the Chinese government put a halt to scrap exports this year in response to exporters who were evading taxes on the value of the material. The tax bureau believed that 280,000 metric tons per month or more was flowing out of the country and that taxes were being paid on a much smaller volume. Hence the investigation and punishment of the traders.
We still believe it is inevitable that the red import line in Figure 1 will re-establish its upward trajectory once the bureaucracy gets control of the situation. According to the OECD Steel Committee report on global steel capacity and investments published this month, almost all the new capacity under construction or starting up in China is based on the BOF process. If so, scrap consumption will not catch up with obsolete scrap generation and the balance will flow into the global scrap market.
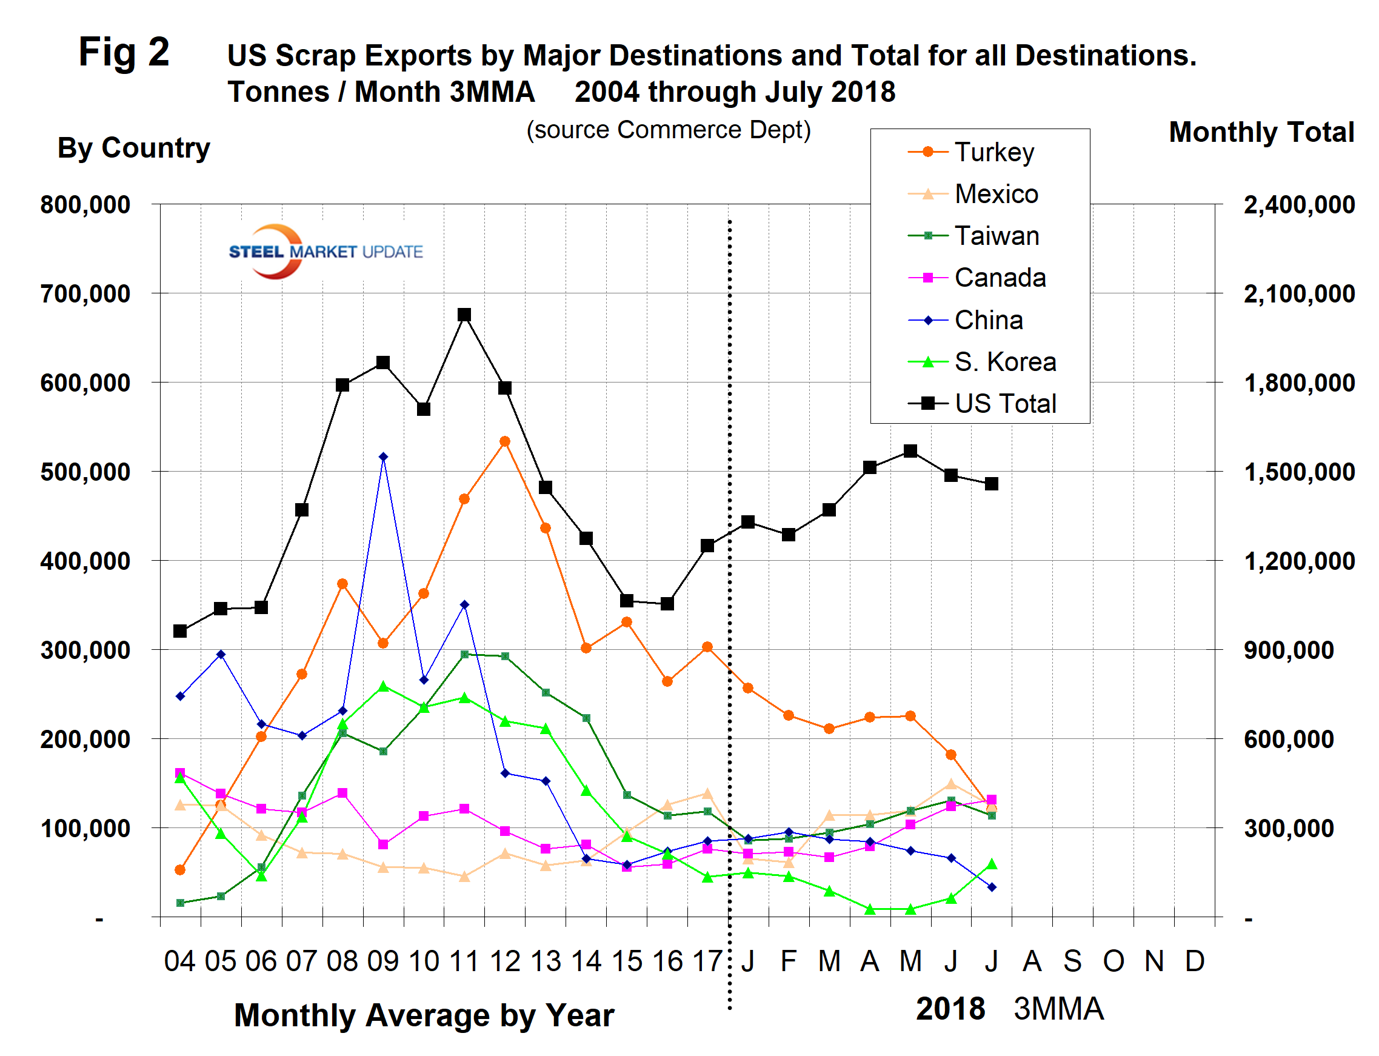
Figure 2 shows total scrap exports from the U.S. as reported by the U.S. Department of Commerce on the right axis together with the major destinations reported on the left axis. It shows the monthly average for the years 2004 through 2017 and the three-month moving average for January through July 2018. In the 12 months of 2017, U.S. scrap exports increased by 18.6 percent from the same period in 2016. In 2018 year to date, July scrap exports were up by 25.7 percent and are now back to where they were in 2013.
In our analysis of global scrap trade, we have excluded scrap that moved within the EU from the global total. Figures 3 and 4 show the total tonnage of global trade since Q1 2000 and the volume of the top five suppliers. These five are the U.S., the EU, the UK, Japan and Russia, and they accounted for 67.1 percent of the total in Q2 2018. Figure 4 is the same as Figure 3 with the total removed.
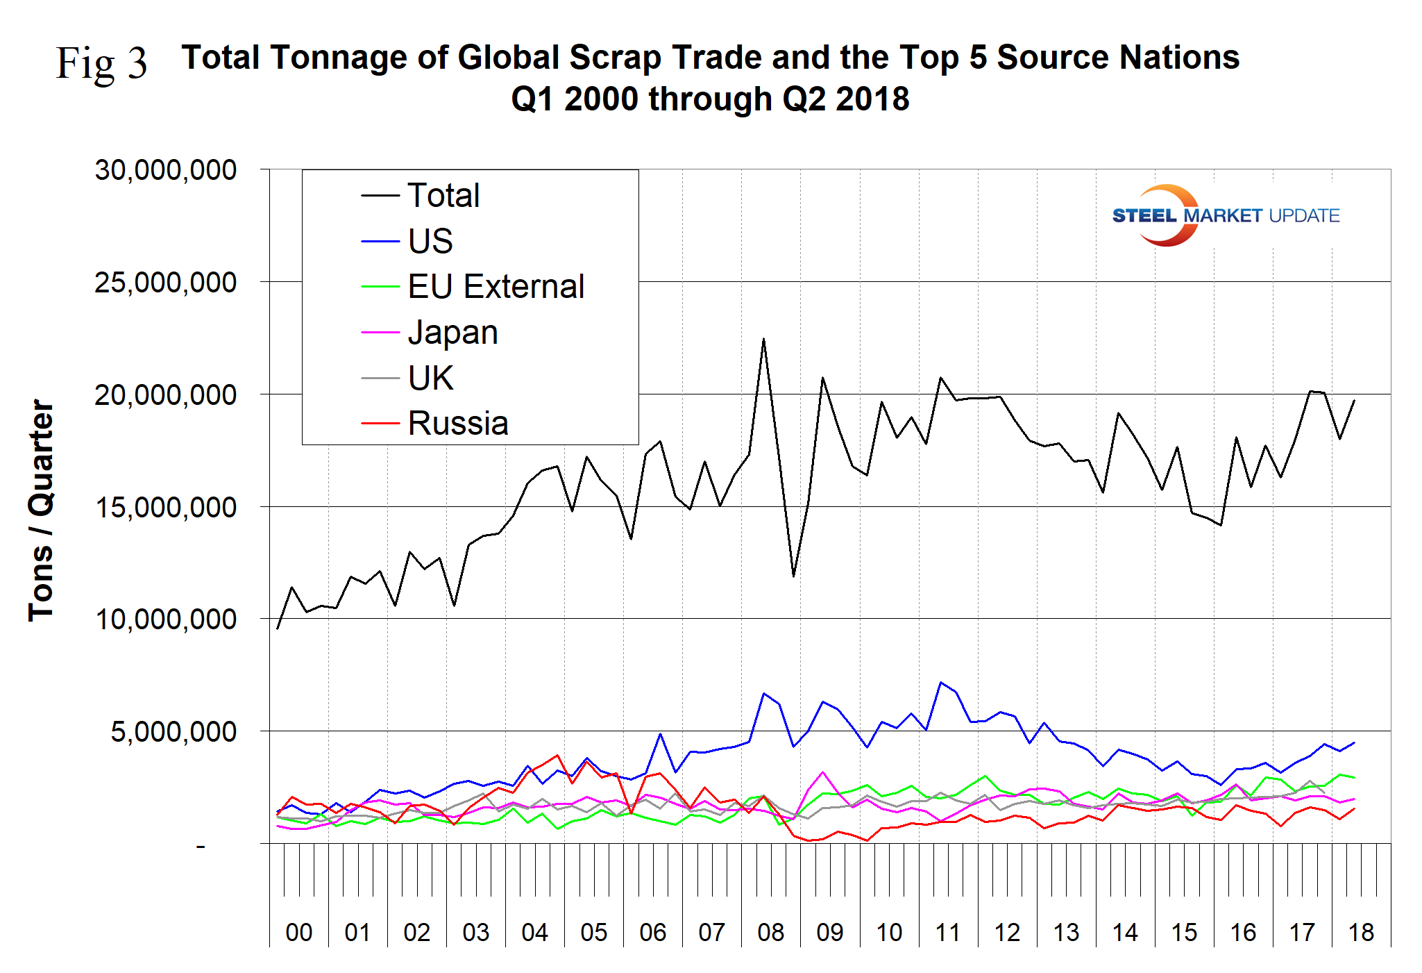
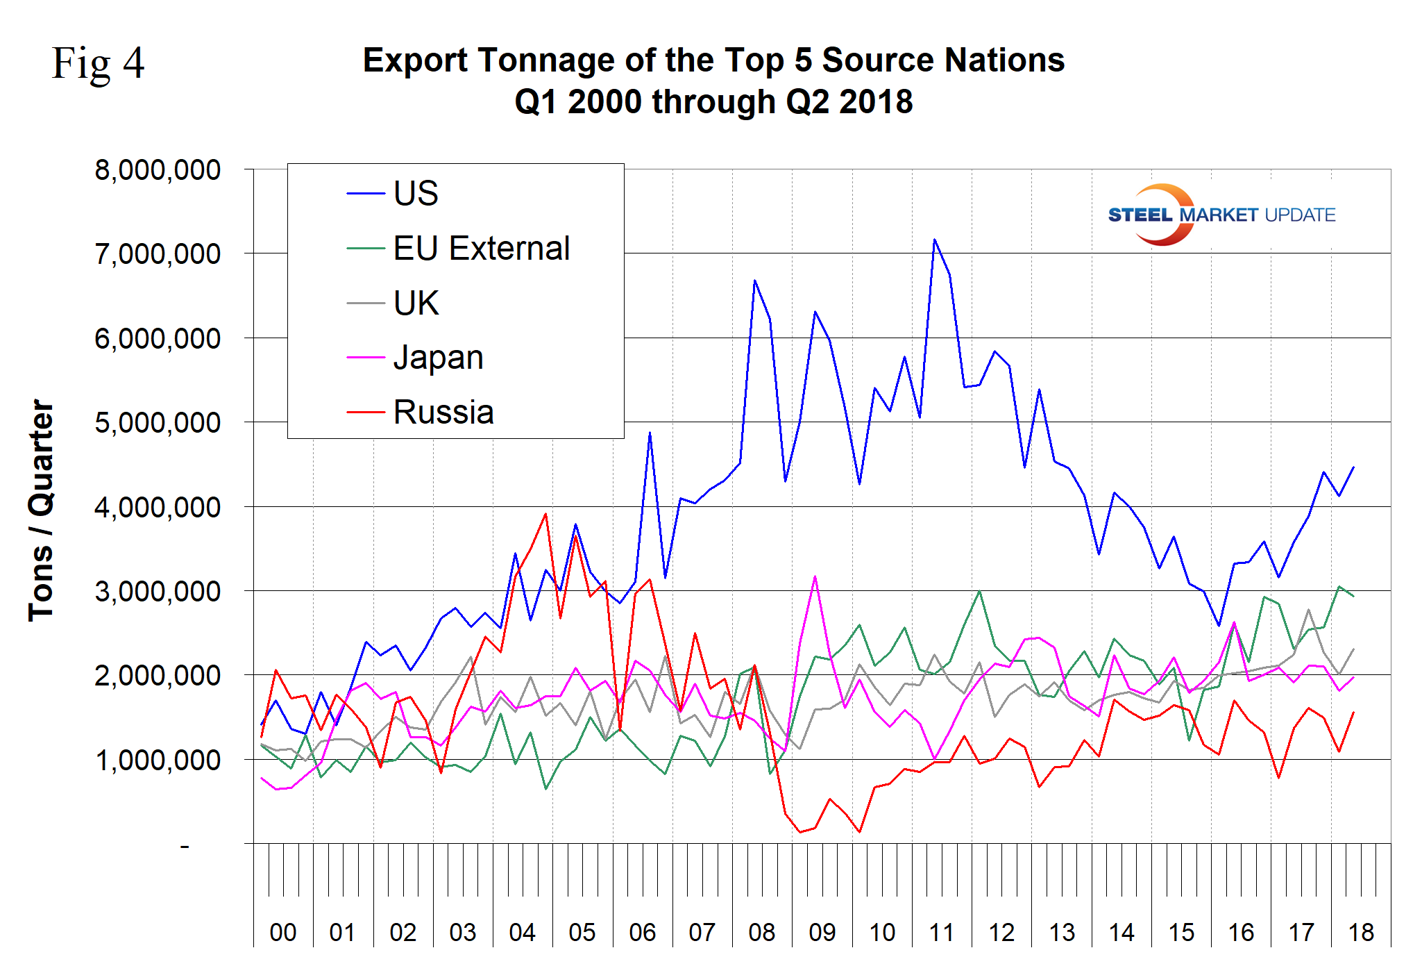
Figure 5 shows the global market share of the top five exporters. The U.S. remains in first place.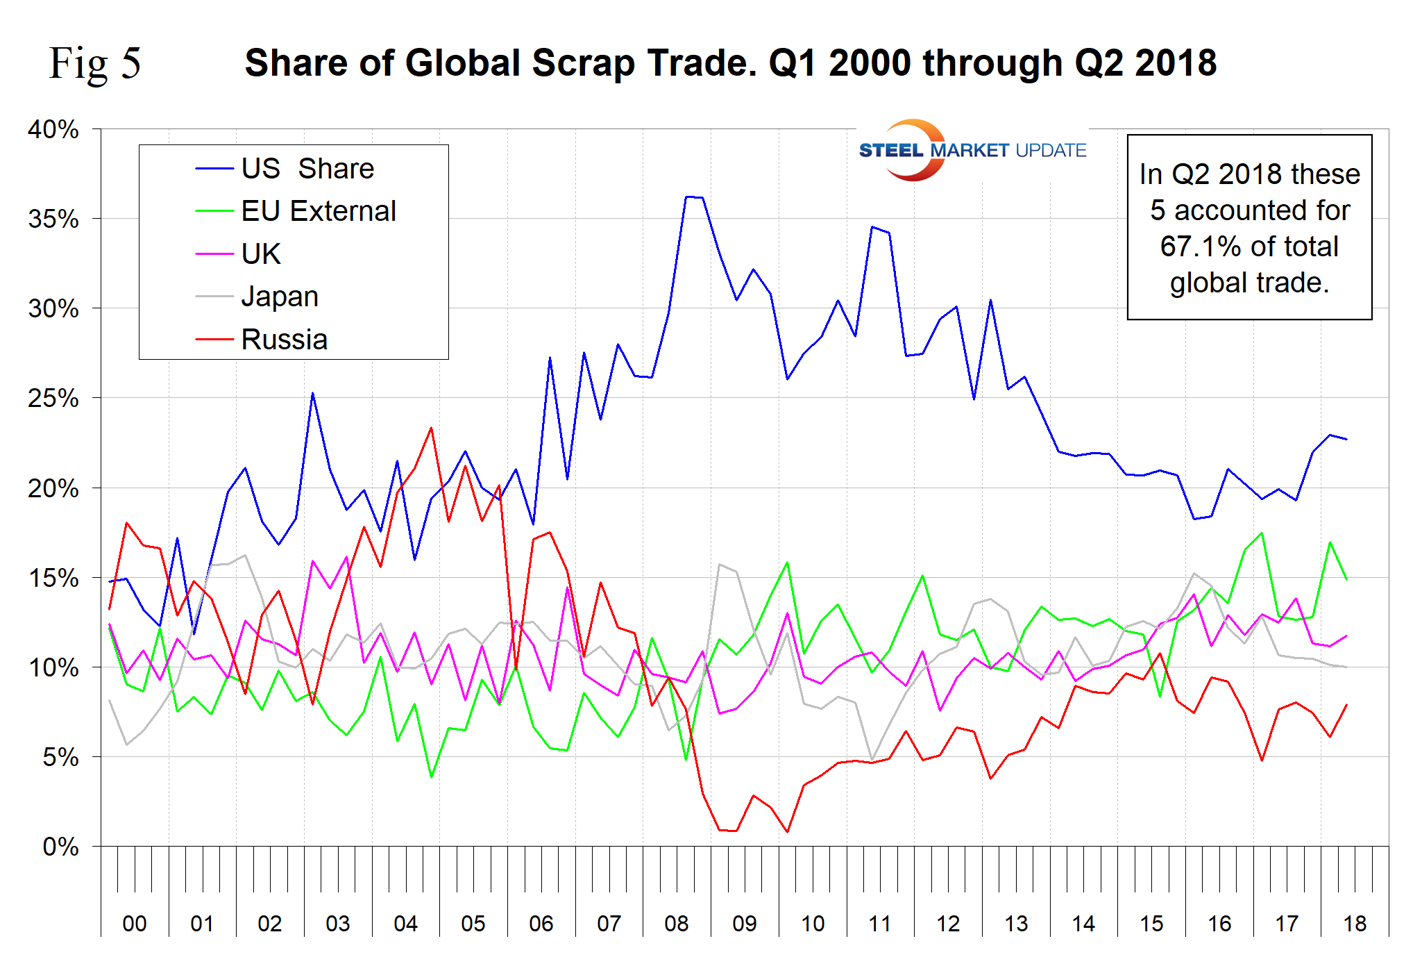
Figure 6 shows the negative correlation of 72.5 percent between the Broad Index value of the U.S. dollar and the U.S. share of global trade. There is also a correlation between the U.S. global share and the U.S. domestic scrap price. The result is shown in Figure 7 with a correlation of 64.5 percent. The fact that our export share increases as our domestic price increases might seem backwards at first glance. However, scrap is a global commodity and this would seem to support the view that the domestic price is driven more by export volume than by domestic demand.
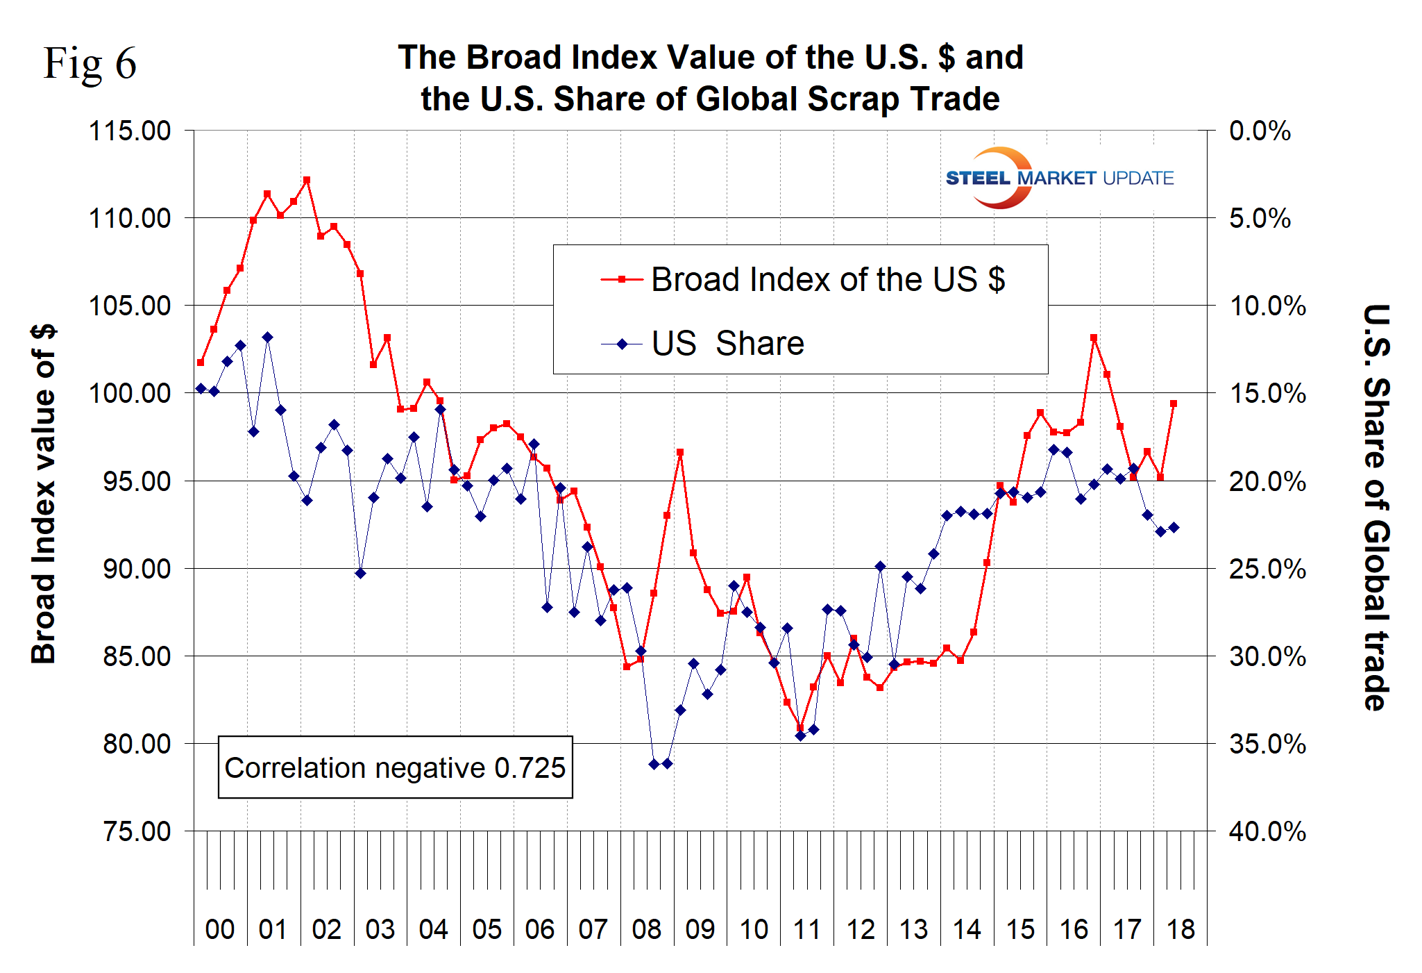
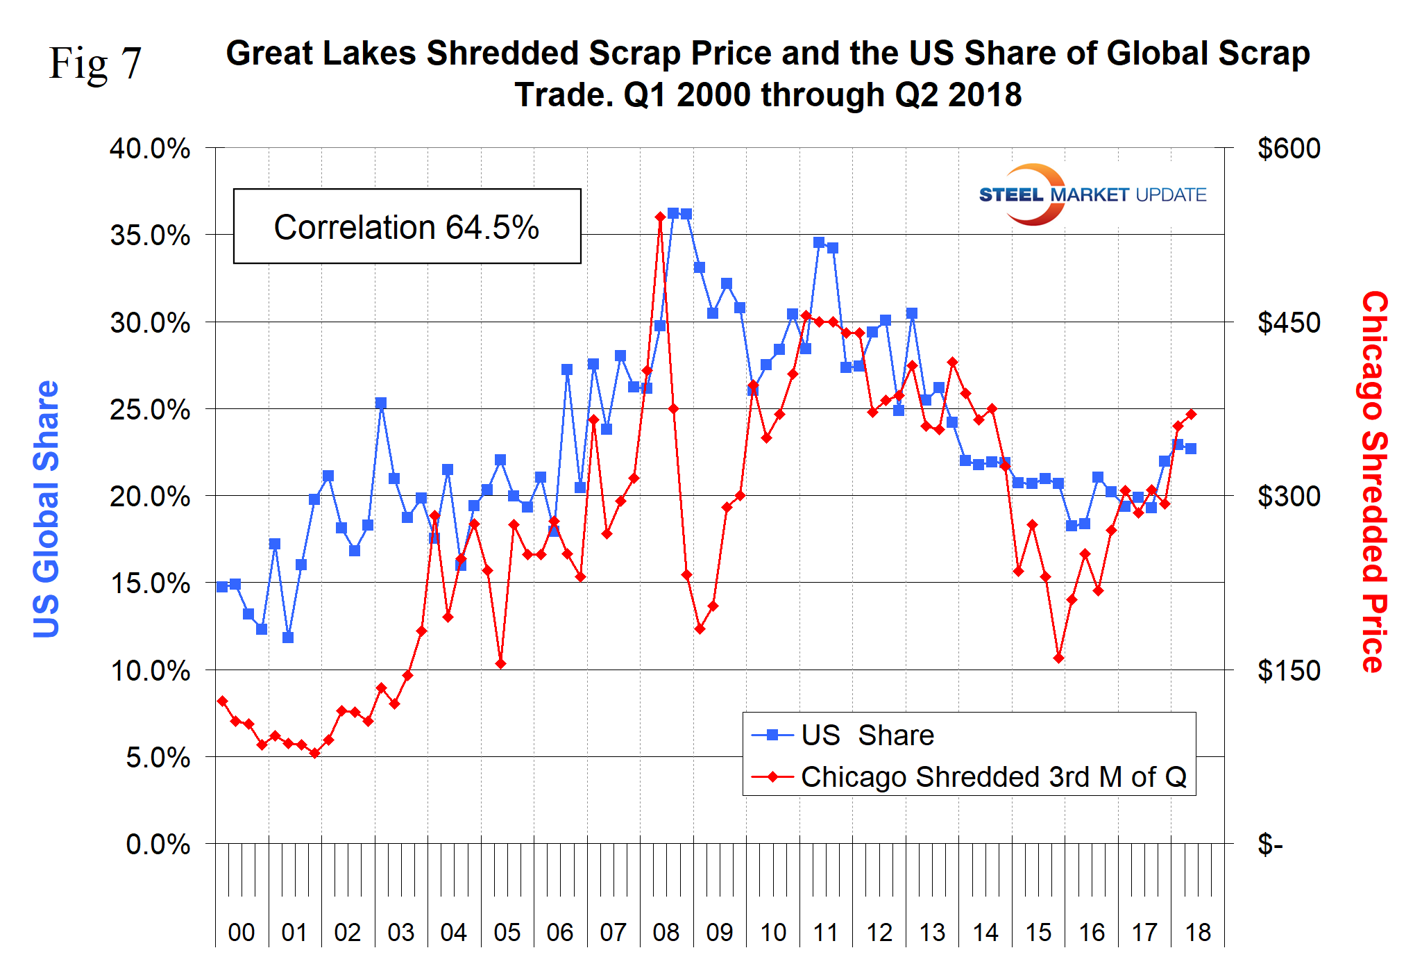
Figure 8 shows the tonnage received by the four major importing nations. Turkey is by far the largest global scrap buyer with a tonnage totaling more than the other three combined. In Q2 2018, Turkey took in 24.6 percent of the global total.
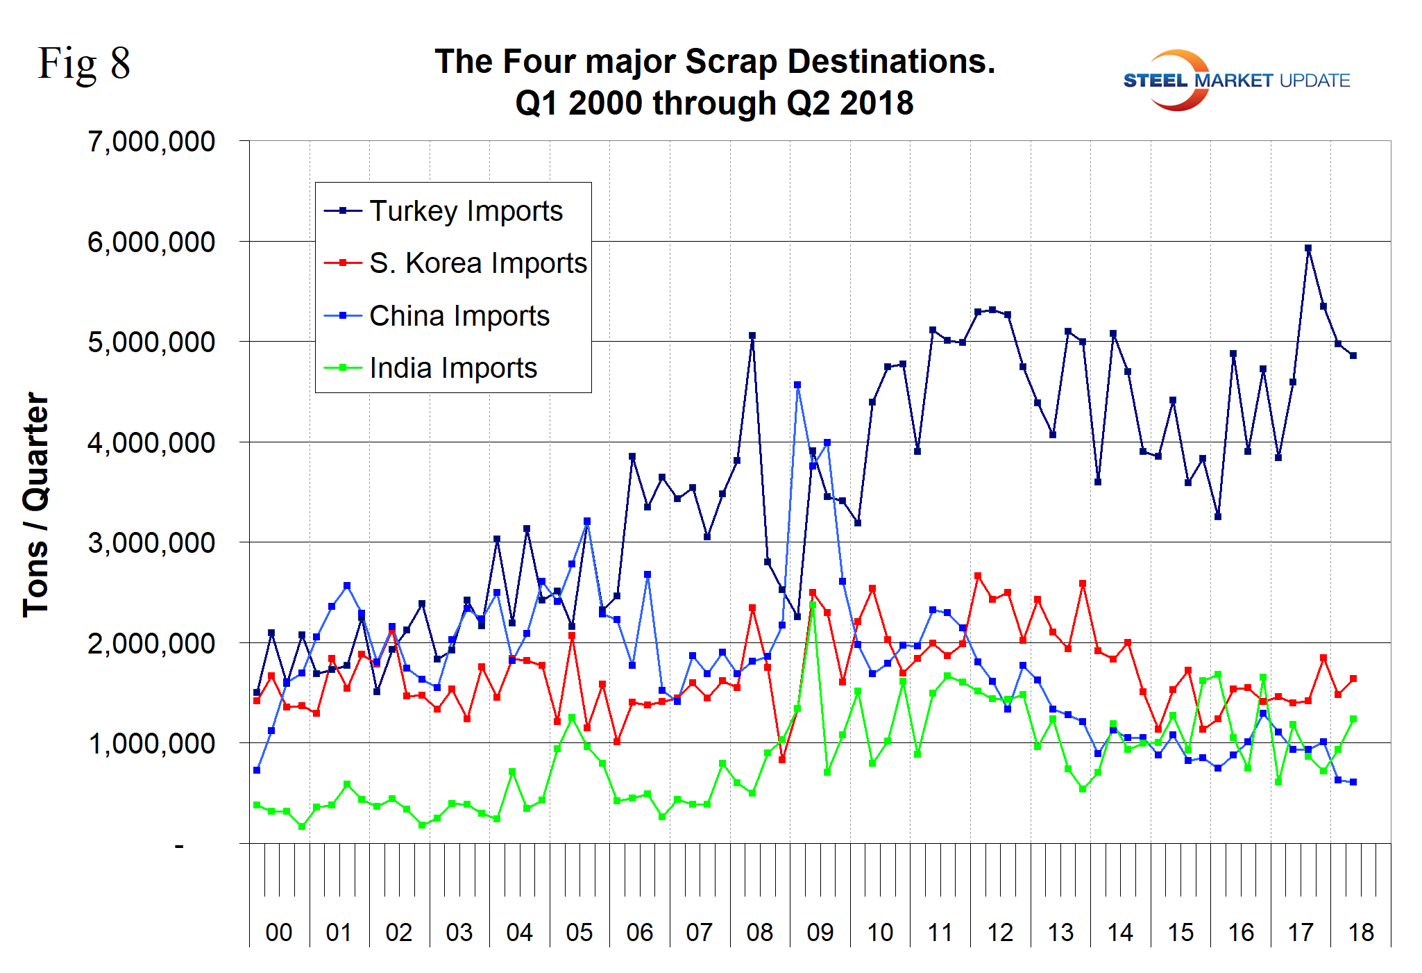
Turkey’s import tonnage declined in 2015 and bounced back strongly in Q3 2017 to an all-time high of 5.9 million tons. In each of the last three quarters, Turkish imports have declined. The EU has increasingly strengthened their position as a supplier to Turkey since mid-2015, and in the latest data Russia replaced the U.S. in second place. This was the first time for Russia’s scrap exports to Turkey to exceed the U.S since Q4 2007 (Figure 9).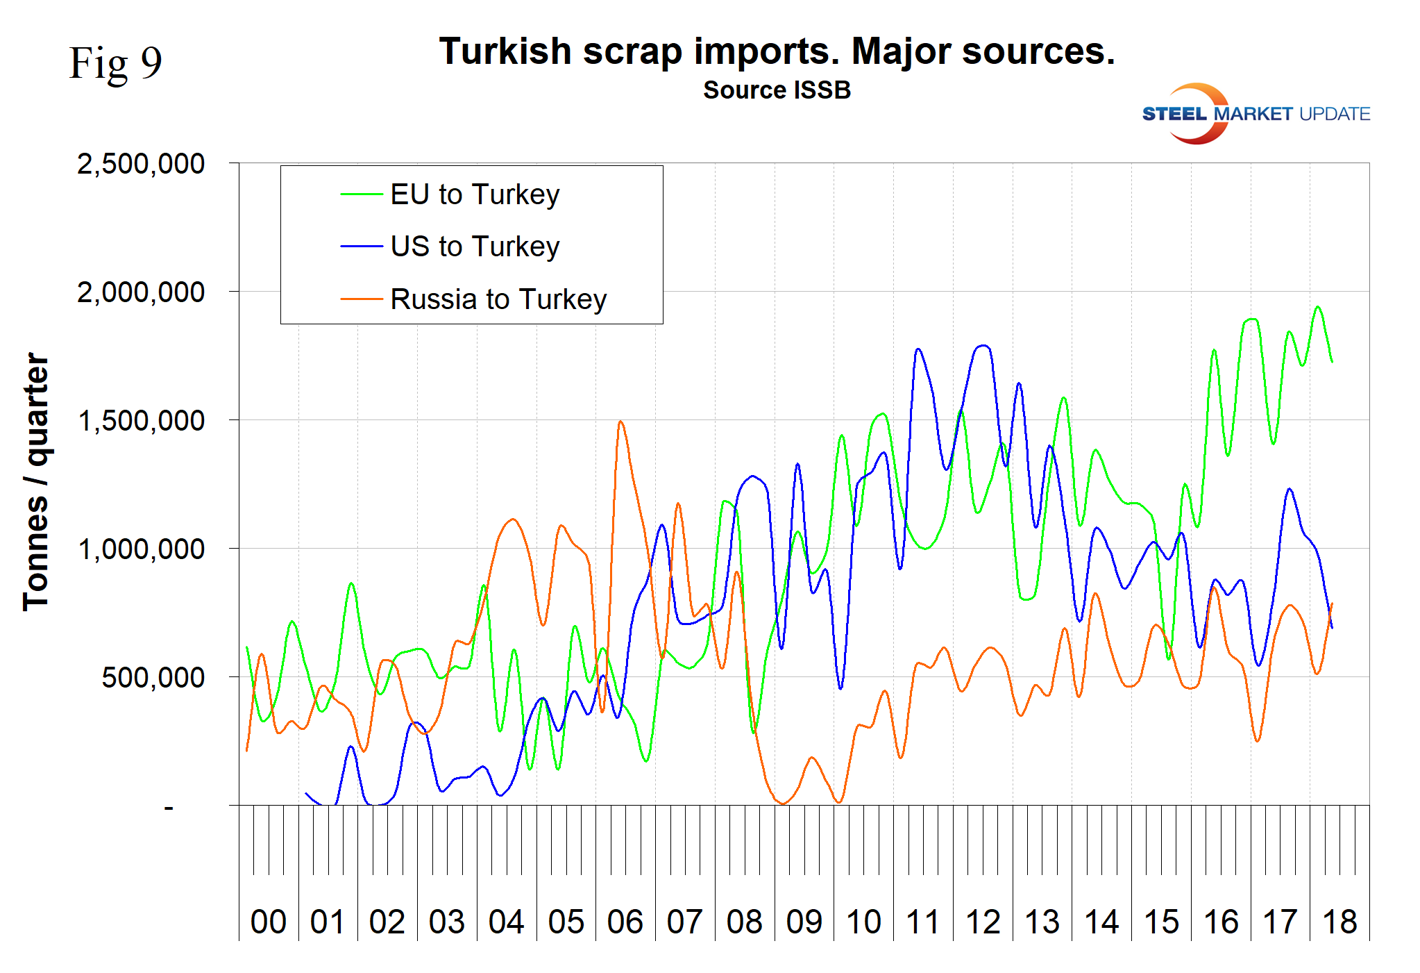
SMU Comment: In many of our reports, including this one, we analyze and report based on the available data. We realize that we often don’t know why the numbers behave as they do. This month, we got a completely fresh and unexpected look at the scrap situation in China from an expert on the ground. We are most grateful to this source and encourage other subscribers to add color to our analyses by commenting on subjects where they have particular knowledge or expertise.


