

Market Data

October 3, 2017
Global Trade of Cold Rolled Coil Through Q2 2017
Written by Peter Wright
We are continuing our analysis to quantify the players in the global trade of both hot rolled coil (HRC) and cold rolled coil (CRC). We now have data through Q2 2017. This information is sourced quarterly from the Iron and Steel Statistics Bureau in the UK. Data is not very current because many countries are slow in reporting, but we feel the history does explain where we are now and shines a light on the relative position of the U.S. in the global picture.
![]() In the four quarters Q3 2016 through Q2 2017, 41,523,000 metric tons of cold rolled coil were traded internationally. Excluding the tonnage traded within the EU, the global total was 31,864,000 metric tons. In the 10 quarters since Q1 2015, the global total excluding inter EU has averaged 7.8 million metric tons, within a range of 7.2 million to 8.4 million, therefore fairly consistent. Figure 1 shows the total global tonnage quarterly since Q1 2006 both with and without the inter EU volume.
In the four quarters Q3 2016 through Q2 2017, 41,523,000 metric tons of cold rolled coil were traded internationally. Excluding the tonnage traded within the EU, the global total was 31,864,000 metric tons. In the 10 quarters since Q1 2015, the global total excluding inter EU has averaged 7.8 million metric tons, within a range of 7.2 million to 8.4 million, therefore fairly consistent. Figure 1 shows the total global tonnage quarterly since Q1 2006 both with and without the inter EU volume.
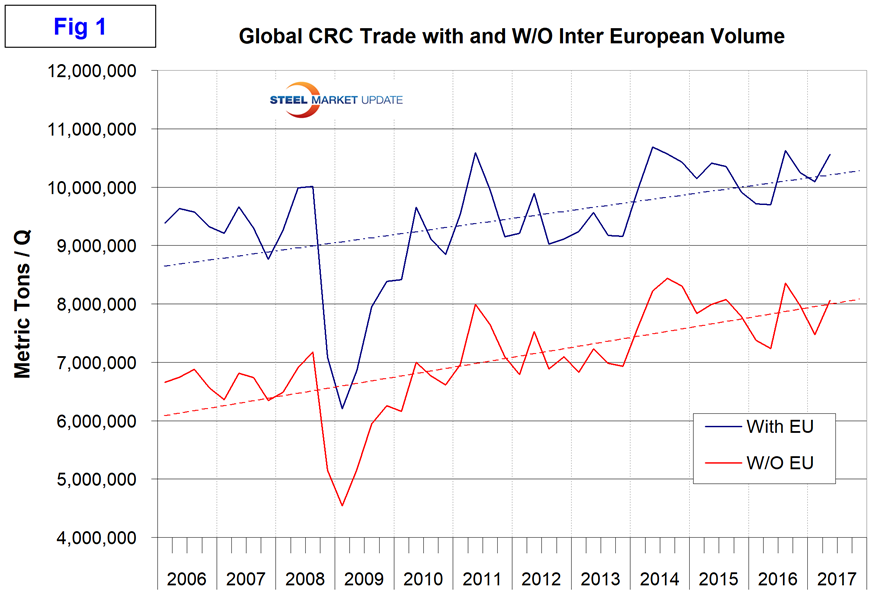
In this analysis, we use only the total excluding the inter EU trade to provide what we think is a more representative base for comparisons. The highest tonnage quarter since our data begins was Q3 2014 with a total of 8,439,000 tons. The seven major exporters in the four quarters Q3 2016 through Q2 2017 in order of volume were China, South Korea, Japan, India, the EU, Taiwan and Russia. The range was China at 10.9 million to Russia at 1.6 million. The U.S. came in a distant eighth with 800,000 metric tons. Together, the top seven accounted for 83.2 percent of total global CRC trade in the last four quarters. The main takeaway is that China lost share between Q2 2015 and Q1 2017, but bounced back in Q2 2017. India has more than doubled its export volume in the last year. Figure 2 shows the relative size of China as an exporter, and that South Korea is in second place and well ahead of the rest of the pack. China exported 11.010 million metric tons of CRC in 2016 and 5.053 million tons in the first half of 2017.
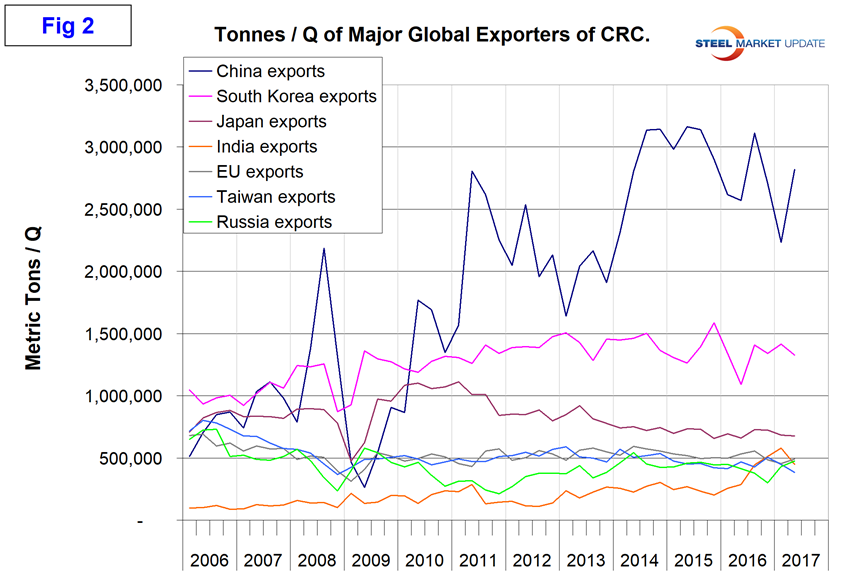
Figure 3 shows the export market share of the top players. China had a market share of 35 percent in Q2 2017.

There have been dramatic changes in the destination mix of Chinese CRC exports in the last six quarters as much of the world plays defense against the Chinese onslaught. South Korea is still the largest volume destination for China’s exports as shown in Figure 4, but the volume has been cut in half in the last year. India, the EU and the U.S. have successfully achieved major reductions in Chinese volume. Vietnam has expanded rapidly and is in second place. China’s exports of CRC to the U.S. declined from 536,000 tons in 2015 to 18,000 in 2016 and to 11,000 tons in the first half of 2017.
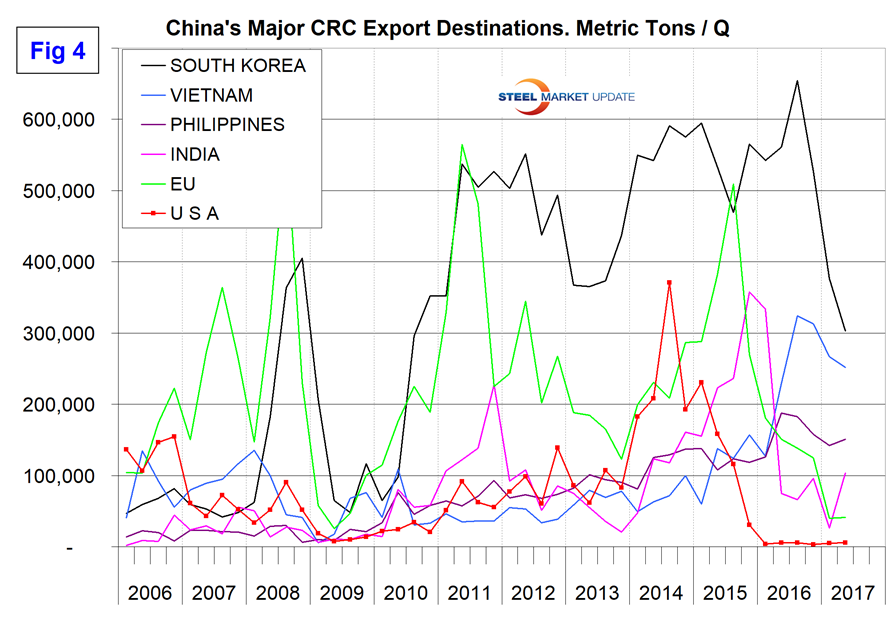
Figure 5 shows the top six importing nations through Q2 2017. In the second quarter, the European Union continued to be in first place and the U.S. moved into second place. China was in third place as an importer. The Chinese imports are almost all alloy steel.
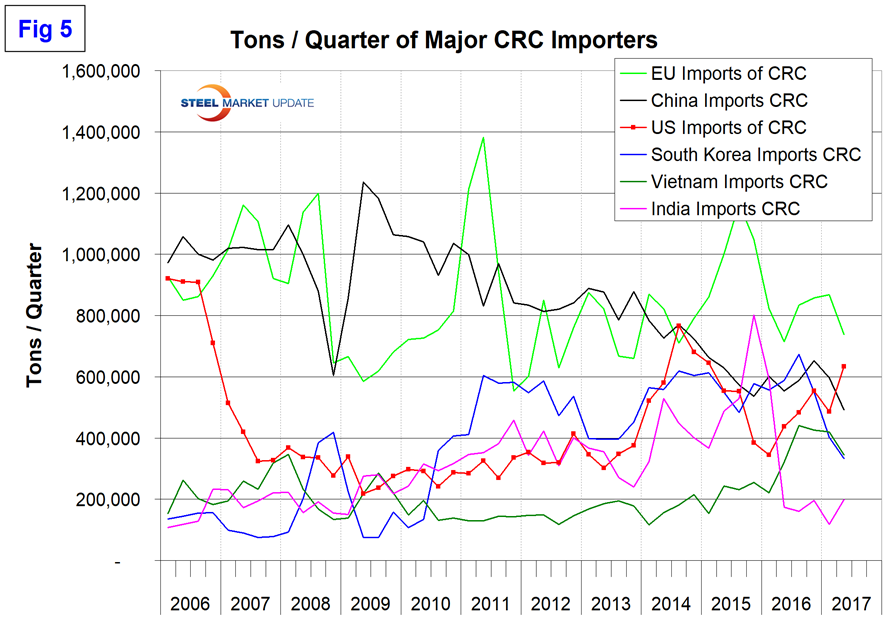
Figure 6 shows the import share of the top six players. The reason for including both tonnage and share charts is that if the base is broadened the share of individual nations drops at the same time as their tonnage could increase.
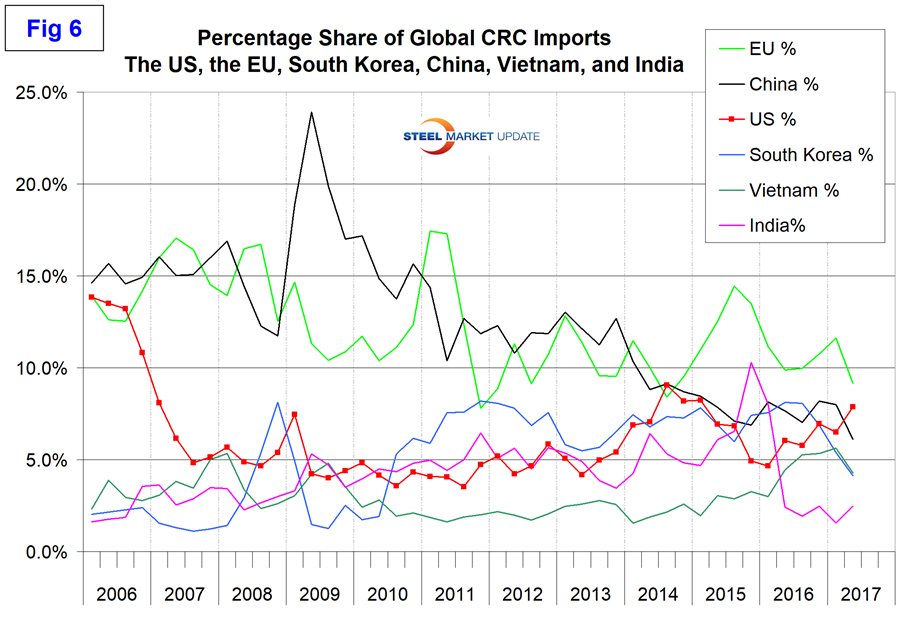
The United States imported 7.9 percent of total global CRC trade in Q2 2017, up from 6.0 percent in Q2 2016 and the highest share since Q1 2015. As China was taken out of the equation, they were replaced by other suppliers.
As readers can imagine, there is a huge amount of data behind this analysis covering most (probably 99 percent) of the tonnage by source and the same by destination. This is a work in progress as we experiment with the best way to distill the data into the most revealing summary. We plan to repeat this exercise quarterly for HRC, CRC and global scrap trade for our premium subscribers.


