Market Data

September 20, 2017
U.S. Dollar Weakens on Foreign Exchange Markets
Written by Peter Wright
The U.S. dollar is continuing to collapse on the international foreign exchange markets.
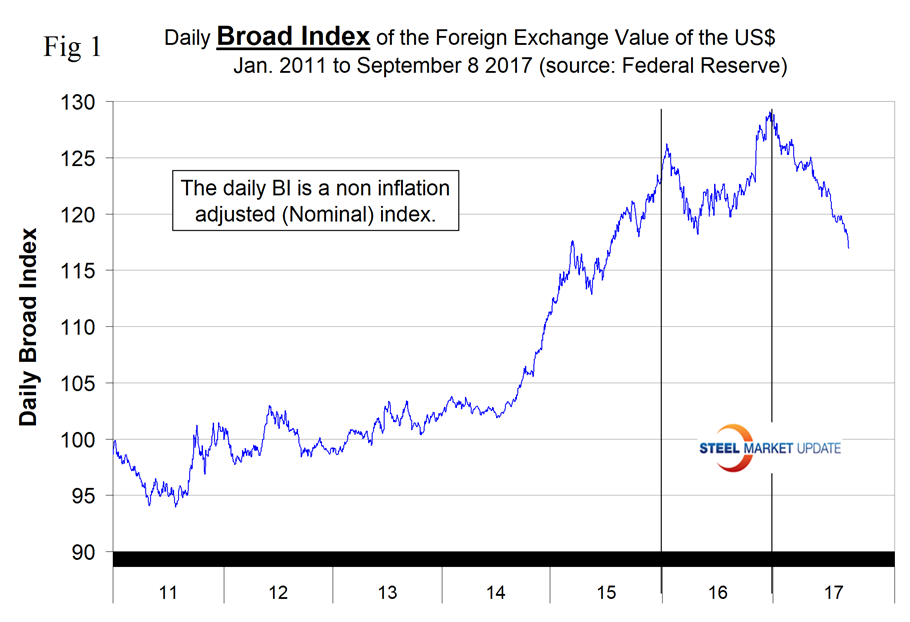
Through Sept. 8, the Broad Index value of the U.S. dollar had depreciated by 9.3 percent since Jan. 3 and the decline is accelerating.
See the end of this report for an explanation of data sources. The analysis of currency trends is a highly technical undertaking; therefore, in this monthly SMU update, we incorporate the opinions of analysts we deem credible to add color to our own data analysis.
Commented Ray Uy, head of Macro Research at Invesco U.S. on Sept. 5: “We expect the U.S. dollar to continue to depreciate over the long term. Synchronized global growth and global policy convergence (toward the U.S. Federal Reserve’s tighter stance) will likely weigh on the U.S. dollar versus developed market currencies. However, short U.S. dollar positioning currently appears stretched. If positions are unwound, this could lead to a dollar bounce in the near term.”
The Broad Index value of the U.S. dollar is reported several days in arrears by the Federal Reserve. The latest value published was for Sept. 8. Figure 1shows the index value since January 2011. In 2017, the dollar declined by 9.3 percent through Sept. 8, was down by 2.1 percent in one month, and dropped by 1.4 percent in seven days. The dollar had a recent peak of 128.963 on Jan. 3, which was the highest value since July 4, 2004. Since then the dollar has weakened to 116.95.
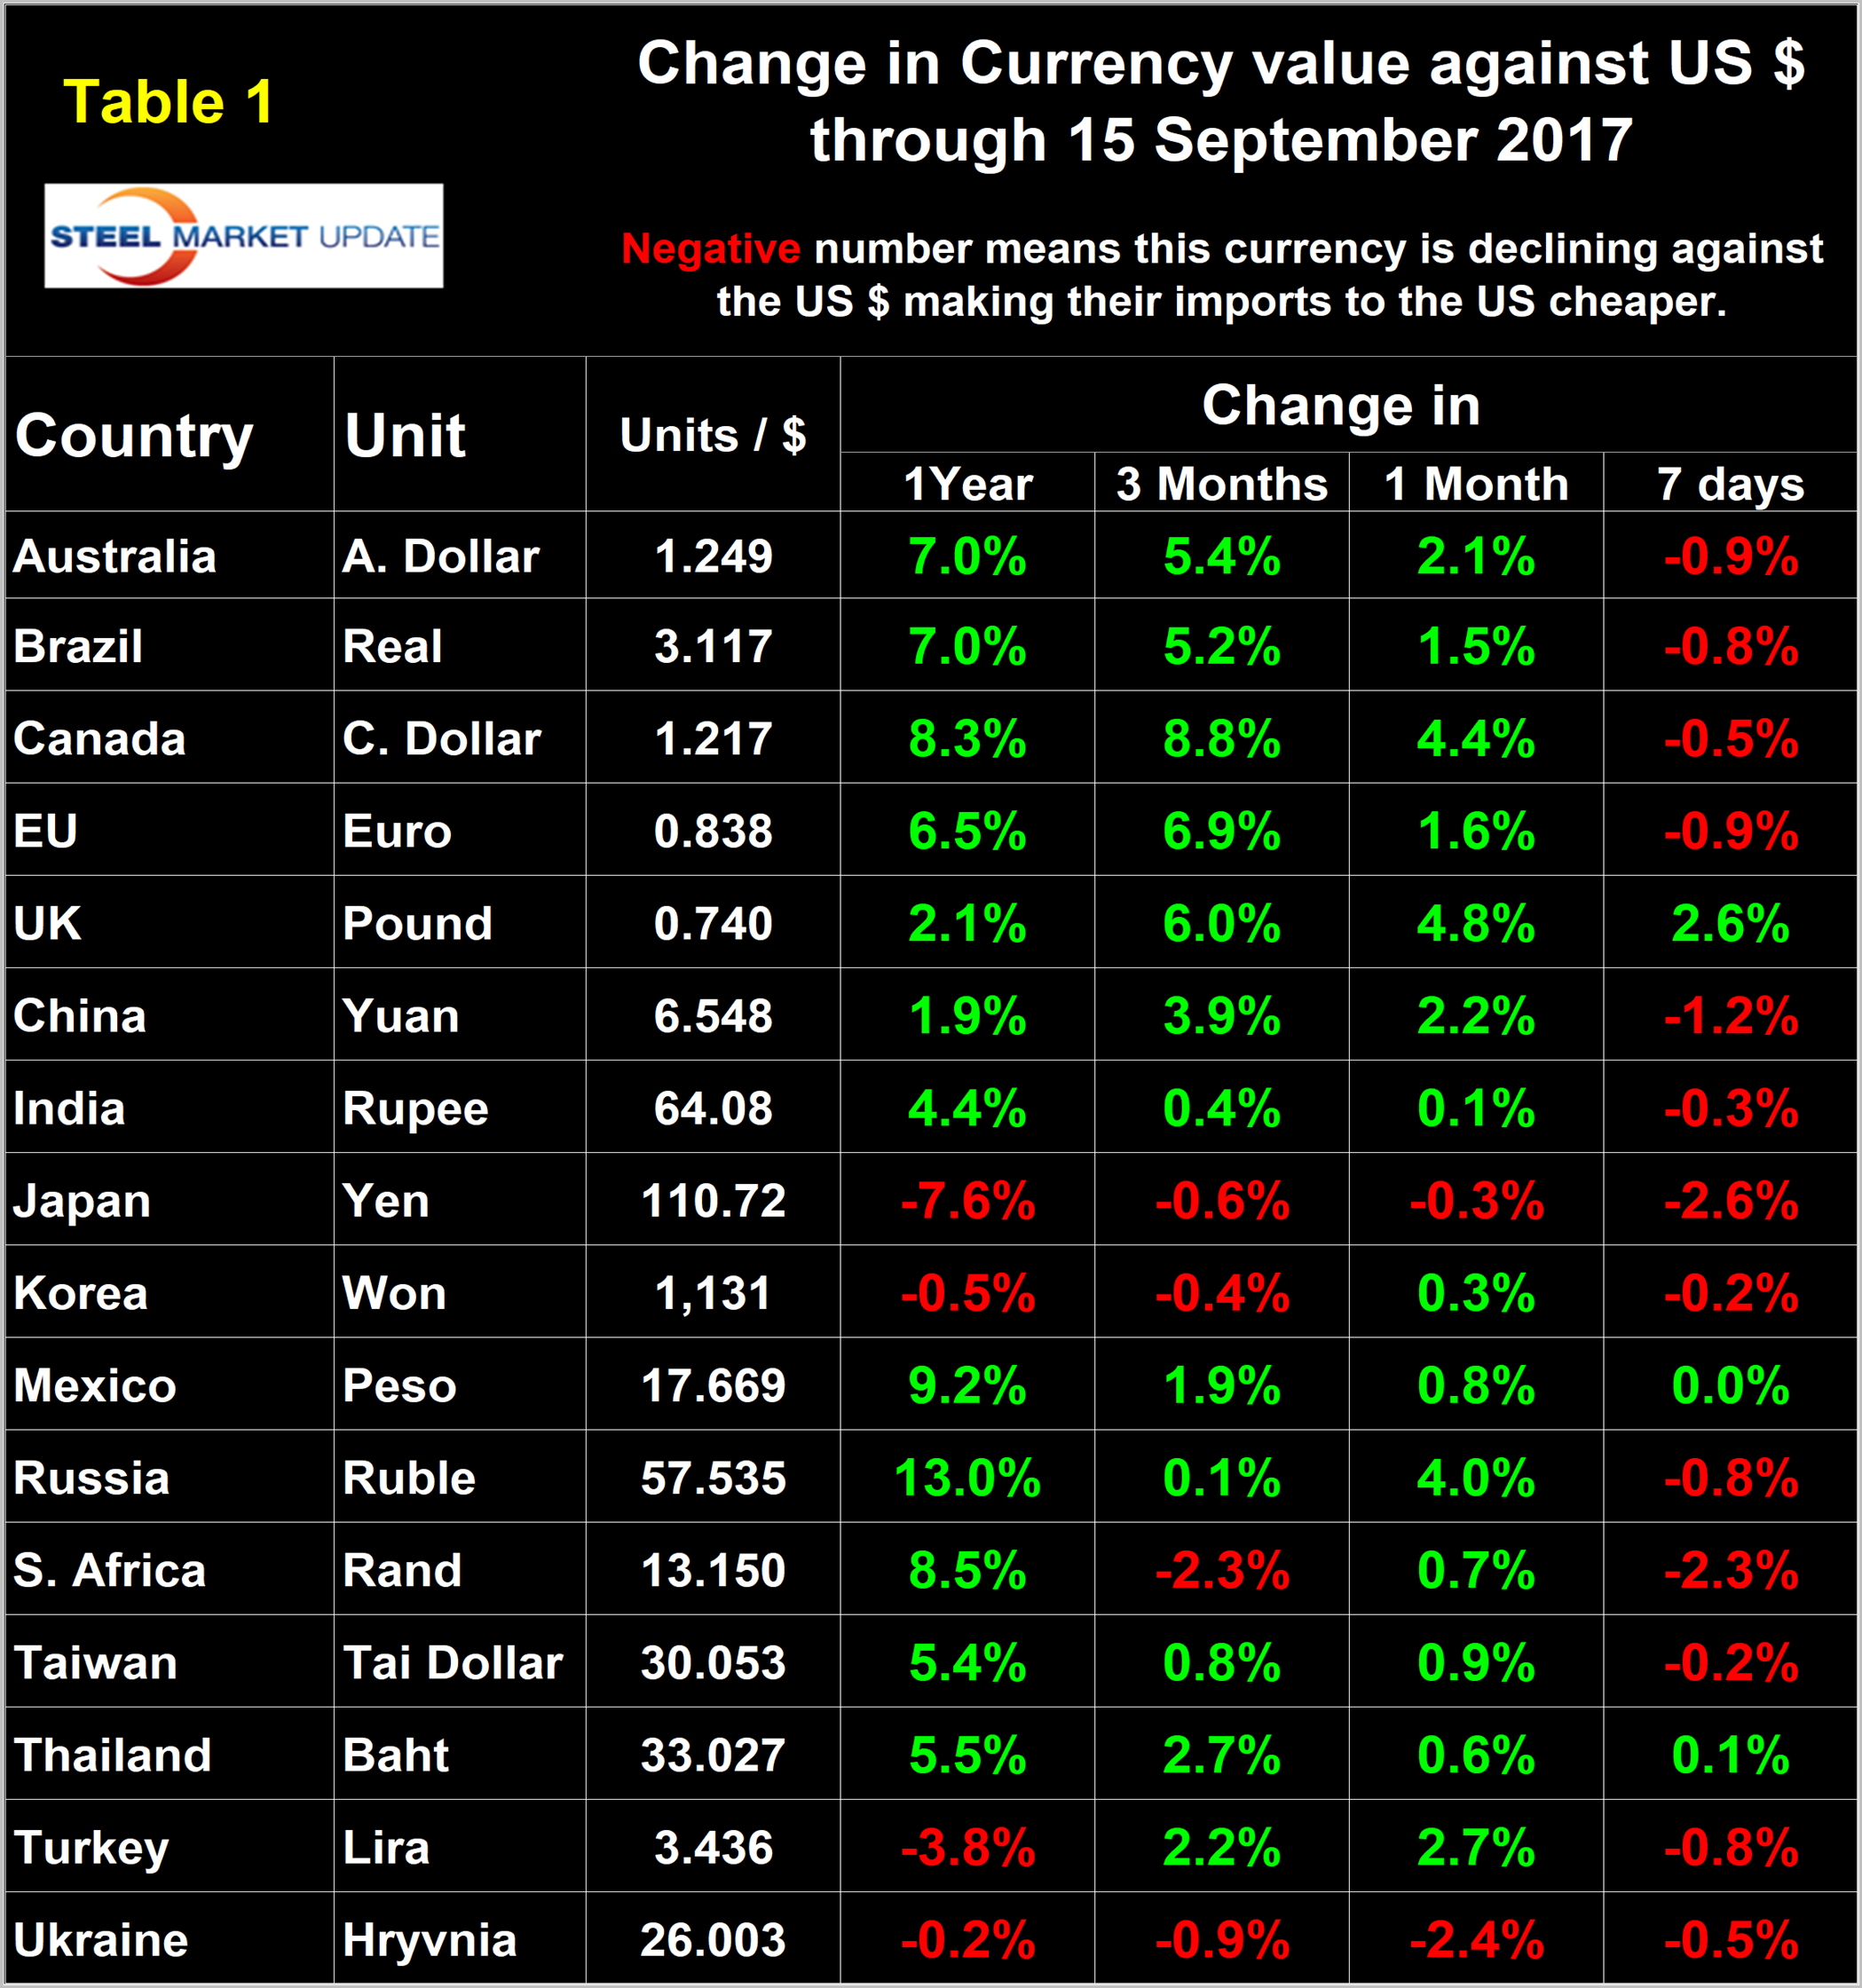
Each month, we publish an update of Table 1, which shows the value of the U.S. dollar against the currencies of 16 major global steel and iron ore trading nations. The table shows the change in value in one year, three months, one month and seven days. Even though it covers four different time frames, this is still a bit of a snapshot, which we try to avoid in all our data presentations. Direction is everything.
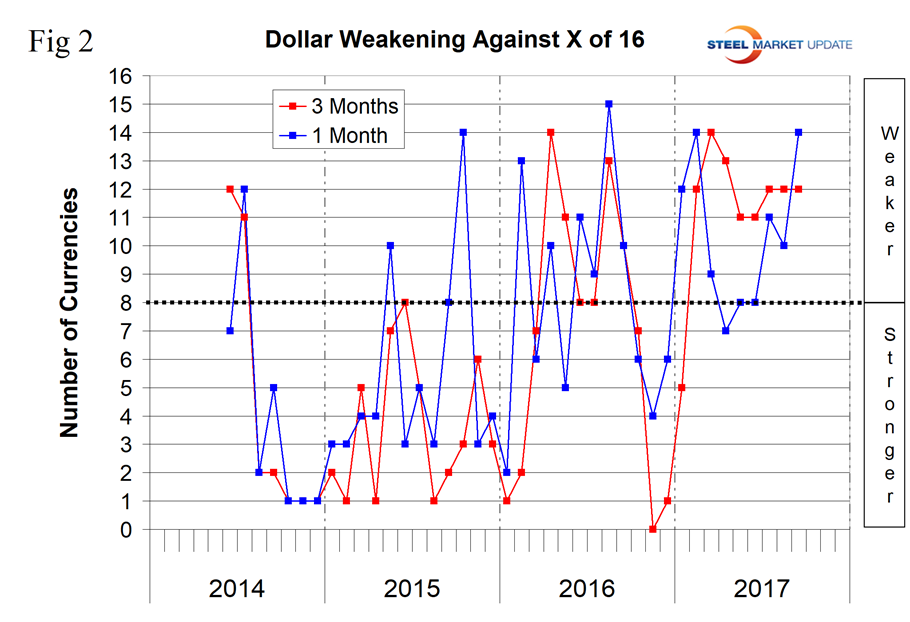
Figure 2 gives a long-range perspective and shows the extreme gyrations that have occurred in the last three years. Figure 2shows that the dollar has weakened against 12 of the 16 at the three-month level, which was the same as in our last two updates, and has weakened against 14 of the 16 in the last month. In the seven days prior to Sept. 15, there was a turnaround when the dollar strengthened against 13 of the 16. It’s too soon to say whether this is the beginning of a change in direction, but it does support Uy’s observation at the beginning of this piece. A declining dollar puts upward pressure on all commodity prices that are greenback denominated. Table 1 is color coded to indicate strengthening of the dollar in red and weakening in green. We regard strengthening of the U.S. dollar as negative and weakening as positive because of the effect on the trade balance of all commodities and on the total national trade deficit.
In each of these reports, we comment on several of the 16 steel and iron ore trading currencies listed in Table 1, and over a period of several months will describe the history of all of them. Charts for each of the 16 currencies are available through Sept. 15 for any premium subscriber who requests them.
Bitcoin: On Sept. 5, securities analyst Sean Geddert wrote a piece on a subject we have wondered about: With the rapid recognition of bitcoin and other crypto currencies, how will governments react to this threat to their sovereignty? “Control over a nation’s money supply yields great power,” Geddert wrote. “A government can use this control to cool or heat its economy, erode the true value of its debts through inflation, and much more. The acceptance, adoption, and proliferation of bitcoin, or any virtual currency, in a nation decreases the power that control over the money supply provides to governments. This is why some governments have banned them and most other governments are still figuring out what to do with them. I believe most governments will defend their power and not allow bitcoin, or any virtual currency, to become prevalent in their economies. Since governments can’t affect the supply and cost of bitcoin, they are left with less power to regulate. Indeed, citizens derive much more benefit from effective monetary policy then they would from widespread bitcoin adoption. Bitcoin, and virtual currencies in general, represent impressive technology, but they also represent a significant loss of power to governments. If a virtual currency is to become widely used in nations, it will be one that governments can control, which would defeat the purpose of the virtual currency in the first place, from the point of view of their citizens.”
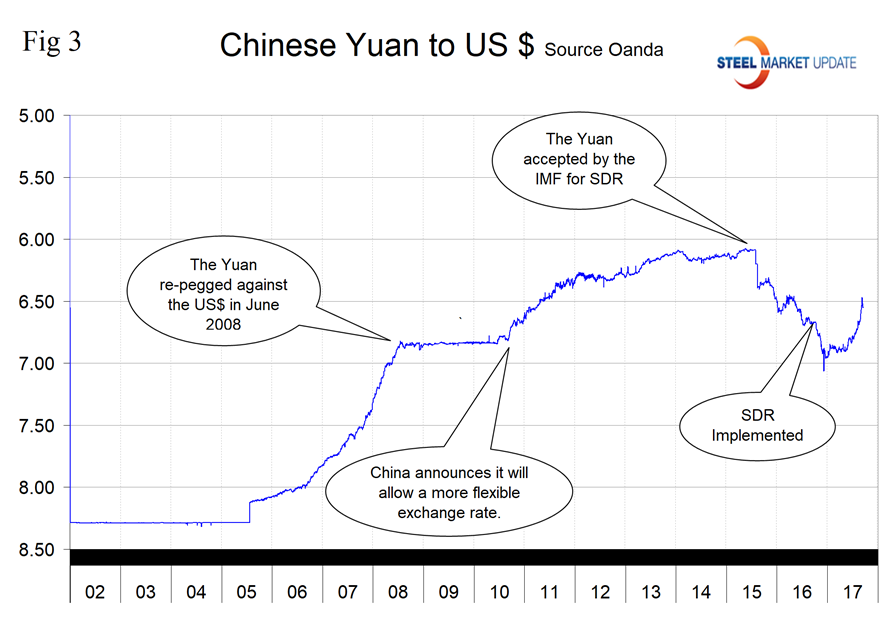
The Chinese Yuan: Invesco writes, “We expect the yuan to trade relatively strongly in the weeks ahead. The willingness of both offshore investors and domestic corporations to be long yuan, together with overall softness in the U.S. dollar, is expected to continue to support the currency. The gradual pace of yuan internationalization and capital account liberalization emphasized by President Xi during the National Financial Work Conference points to continued capital controls for the foreseeable future and potential stability in the yuan/U.S. dollar exchange rate. Central bank officials believe the U.S. dollar/yuan spot rate could trade around 6.5-6.6 by year-end. In our view, the exchange rate may trade in a range of 6.80-6.99 during the second half of 2017.”
Figure 3 shows the value of the yuan, which has appreciated by 3.9 percent in the last three months and by 2.2 percent in the last month. The dollar was worth 6.548 yuan on Sept. 15.
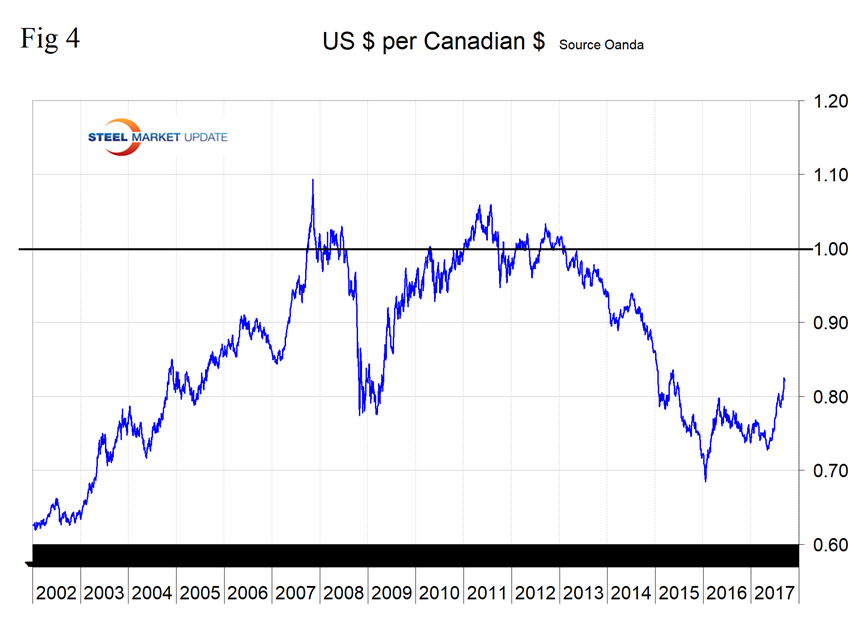
The Canadian Dollar: On Wednesday, Sept. 6, the Bank of Canada increased its benchmark interest rate to 1 percent. Following this announcement, the U.S. fell below a key support level of 1.2330 and signaled that further follow through to the downside was likely. “The Canadian dollar has rallied significantly this year following the Bank of Canada’s (BOC) switch to a hawkish tone,” Invesco reports. “The combination of reasonably strong growth and the expressed intent of the BOC to remove both the 2015 emergency rate cuts left the market covering shorts in the Canadian dollar. This sharp rally has left the currency susceptible to a short-term retracement, in our view.”
Figure 4 shows the value of the Canadian dollar in U.S. dollars. On Sept. 15, the Canadian dollar was worth 82.14 U.S. cents. In the last three months and one month, the Canadian dollar has appreciated by 8.8 percent and 4.4 percent, respectively.
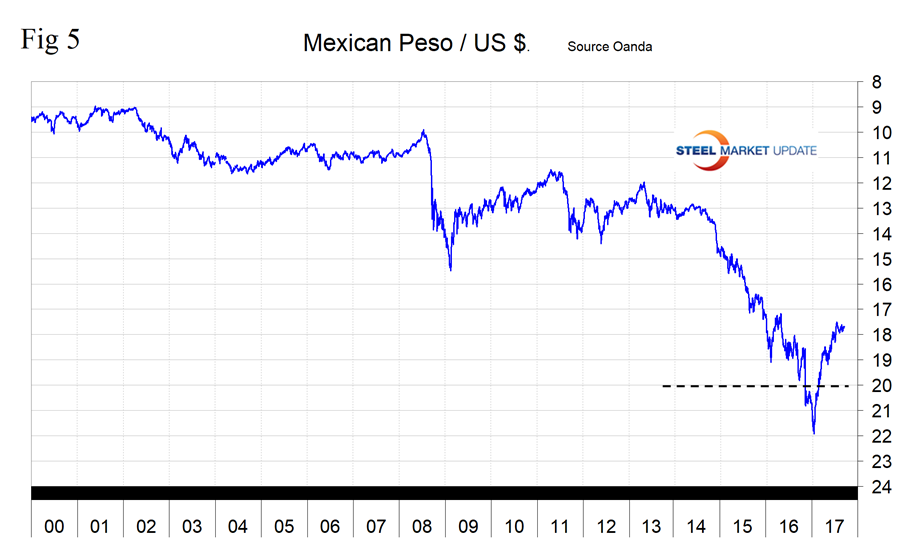
The Mexican Peso: Between January 19 and July 19 this year, the peso appreciated by 25.3 percent, as seen in Figure 5. Since then, the Mexican currency has traded in the range 17.50 to 17.94 per U.S. dollar to close at 17.67 on Sept. 15. In the last three- and one-month periods, the peso has appreciated by 1.95 percent and 0.8 percent, respectively, which seems to be in a wait-and-see mode as NAFTA negotiations commence.
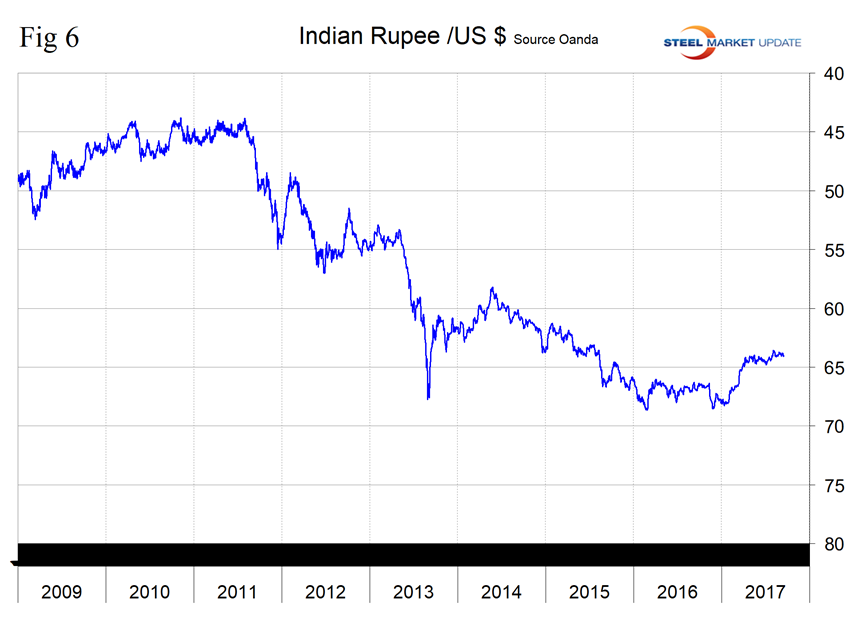
The Indian Rupee: In the 12 months through August, India shipped 697,000 tons of steel products into the U.S., which put them in 12th position. The top two items were line pipe and HDG sheet, which accounted for 47.1 percent and 19.6 percent, respectively. Figure 6 shows the number of rupees it took to buy one U.S. dollar in the period January 2009 through Sept. 15, 2017. The rupee surged in value between Feb. 17 and May 16 and since then has traded in the range 64.04 to 64.77 to close at 64.08 per U.S. dollar on Sept. 15. The rupee has appreciated by 0.4 percent in three months and 0.1 percent in one month.
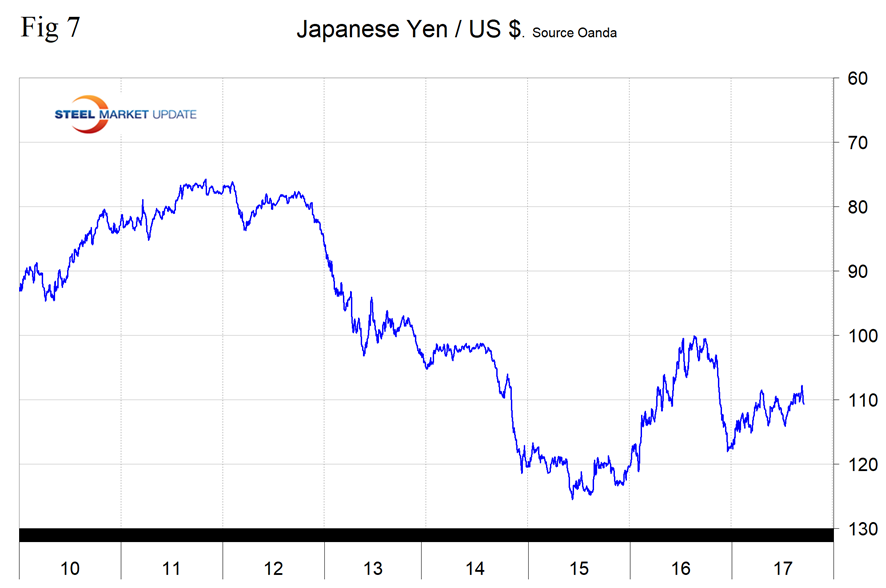
The Japanese Yen: Invesco reports, “The yen benefited from a general flight-to-quality in August, particularly away from the U.K. pound and the euro. We expect this trend to continue against the majority of other major currencies through September, particularly given the potential for a Brexit stalemate (which would be negative for sterling) and the possibility that the ECB quantitative easing exit plans might surprise the market. The trajectory for the yen is less clear against the U.S. dollar, however, given its recent breakout of the 110-115 range. We believe a move back into that range is possible.” Figure 7 shows the number of yen it took to buy one U.S. dollar in the period January 2010 through Sept. 15, 2017. The yen closed at 110.724 on Sept. 15, and as can be seen from Table 1 was one of only two of the 16 to decline in the last month.
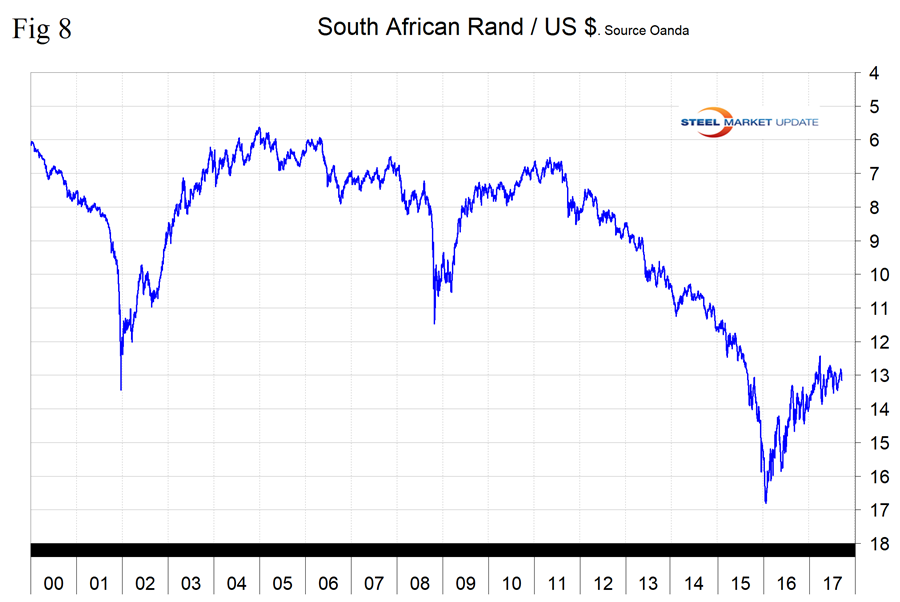
The South African Rand: In the 12 months through August, South Africa shipped 309,000 tons of steel products into the U.S., which put them in 18th position. The top two items were HDG sheet and cold rolled sheet, which accounted for 53.5 percent and 18.5 percent, respectively. Figure 8 shows the history of the value of the rand since January 2000. Between Jan. 21, 2016, and March 25, 2017, (14 months) the rand appreciated by 34.2 percent. Since then, the rand has traded in the range of 12.55 to 13.87, closing at 13.15 per U.S. dollar on Sept. 15.
Explanation of Data Sources: The broad index is published by the Federal Reserve on both a daily and monthly basis. It is a weighted average of the foreign exchange values of the U.S. dollar against the currencies of a large group of major U.S. trading partners. The index weights, which change over time, are derived from U.S. export shares and from U.S. and foreign import shares. The data are noon buying rates in New York for cable transfers payable in the listed currencies. At SMU, we use the historical exchange rates published in the Oanda Forex trading platform to track the currency value of the U.S. dollar against that of 16 steel and iron ore trading nations. Oanda operates within the guidelines of six major regulatory authorities around the world and provides access to over 70 currency pairs. Approximately $4 trillion U.S. dollars are traded every day on foreign exchange markets.


