Market Data

September 7, 2017
SMU Steel Buyers Sentiment Ticks Up in September
Written by Tim Triplett
Both current and future sentiment showed a slight improvement in the latest SMU Steel Buyers Sentiment Index, based on data gathered in early September. The index measures how buyers and sellers of flat rolled steel feel about their company’s ability to be successful both in the current market environment, as well as three to six months into the future. Overall, the indexes have remained at optimistic levels throughout 2017.
The history of the SMU Steel Buyers Sentiment Index is when we start to see a jump in the numbers it generally is due to higher steel prices or, a market that is perceived as heading higher from here. We will need to watch the data closely in the coming weeks to see if steel prices and demand improve from here. We do know that the information coming from China and elsewhere is quite positive and that too could be influencing the optimism being expressed in our Sentiment Index.
Indexed by SMU as a single data point, Current Sentiment is at +69 (the optimistic scale ranges from 0 to +100), up 4 points from the data collected two weeks ago. One month ago, sentiment was +67; a year ago it was +63.
SMU’s preference is to look at the data based on a three-month moving average (3MMA), which smooths out the index and provides a better look at the true trend. The Current Sentiment 3MMA is at +65.67, unchanged from two weeks ago. This is the first period in which the 3MMA has not declined since peaking at +74.17 in early April.
Future Steel Buyers Sentiment Index
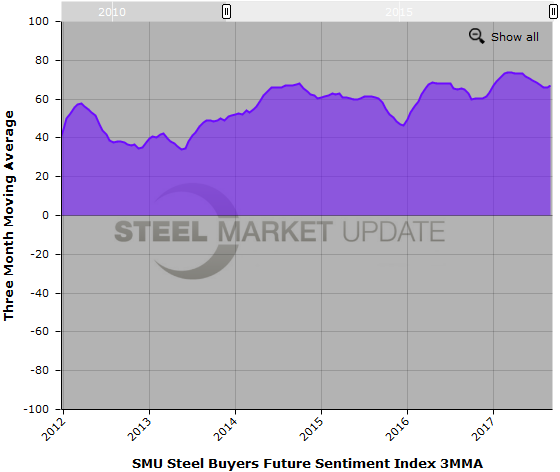
SMU also asked respondents how they feel about their ability to be successful three to six months in the future. Future Sentiment indexed as a single data point registered +73, up 7 points from mid-August and at its highest level since early May.
As a three-month moving average, Future Sentiment registered +67.17, up a point from +66.00 two weeks ago and +66.17 a month ago. Buyers and sellers are feeling slightly more optimistic than they were at this time last year when the index was at +64.83. The peak in Future Sentiment 3MMA in the past year occurred in mid-March at +73.67.
According to SMU’s analysis, both current and future sentiment have been gradually trending toward less optimistic levels for most of this year. While the latest figures are more positive, it’s too early to tell if the data is signaling a turnaround.
What Respondents are Saying
Commenting on their prospects for success, one manufacturer noted that his company had record invoices in August, which is typically one of the slowest months of the year. Others expressed a bit more pessimism: “There are so many unknowns now. I have the feeling things will start to slow down in the next year or so. Cost will keep going up and drive expansion down,” said one trader. “I think free trade is a dying thing for the U.S.,” added another. “If the current administration gets its way, it’s going to get harder for imports. Our costs will go up and the U.S. will lose competitiveness with finished goods on a world market.”
About the SMU Steel Buyers Sentiment Index
SMU Steel Buyers Sentiment Index is a measurement of the current attitude of buyers and sellers of flat rolled steel products in North America regarding how they feel about their company’s opportunity for success in today’s market. It is a proprietary product developed by Steel Market Update for the North American steel industry.
Positive readings will run from +10 to +100 and the arrow will point to the righthand side of the meter located on the Home Page of our website indicating a positive or optimistic sentiment. Negative readings will run from -10 to -100 and the arrow will point to the lefthand side of the meter on our website indicating negative or pessimistic sentiment. A reading of “0” (+/- 10) indicates a neutral sentiment (or slightly optimistic or pessimistic), which is most likely an indicator of a shift occurring in the marketplace.
Readings are developed through Steel Market Update market surveys that are conducted twice per month. We display the index reading on a meter on the Home Page of our website for all to see. Currently, we send invitations to participate in our survey to almost 600 North American companies. Our normal response rate is approximately 110-150 companies. Of those responding to this week’s survey, 35 percent were manufacturers and 49 percent were service centers/distributors. The balance was made up of steel mills, trading companies and toll processors involved in the steel business. Click here to view an interactive graphic of the SMU Steel Buyers Sentiment Index or the SMU Future Steel Buyers Sentiment Index.


