

Market Data

August 24, 2017
World Currencies vs. the U.S. Dollar: Is China a Currency Manipulator?
Written by Peter Wright
This article is normally reserved for our Premium members, but we are sharing it with our entire readership this month. To learn more about what our Premium members receive, click here.
Steel Market Update offers this update on the currencies of the steel and iron ore trading nations through Aug. 21. The analysis of currency trends is a highly technical undertaking; therefore, in this monthly update, we incorporate the opinions of experts to add color to our own data analysis. Please see the end of this report for an explanation of the data sources.
On July 19, equities analyst Geoffrey Caveney wrote: “People around the world who have wealth and who are smart know that it makes no sense to store their wealth in cash in their own countries’ currencies. They have experienced first-hand what has happened to the value of those currencies for 35 or 45 years or more: all the value has been virtually destroyed. So, when they have money or make money in their own countries, whether it is personal income or business revenues or anything else, they take the cash in their local currency and they buy U.S. dollars or U.S. Treasury bonds or U.S. stocks or U.S. real estate with it. It is the only sensible thing for them to do. And every time they do this, the exchange drives the emerging market currency value down even more, and drives the value of all the U.S. assets up even more. So long as people outside of the U.S., Japan and Western Europe still have money and make money, this trend can continue. These buyers don’t care so much about the overvaluation of U.S. stocks and bonds and real estate, or Price to Sales ratios over 2, or other such things. Those things are no big deal at all compared to what they know is going to happen to the value of their money if they keep it in cash in their local currency. Even the dot-com crash of 2000, the housing market crash of 2007, and the stock market crash of 2008-2009 pale in comparison to the emerging market currency crashes of the 1980s and ever since.”
On Aug. 14, Andrew Hecht, another commodities analyst, connected the dots as far as dollar value and commodity prices are concerned: “On Aug. 2, the greenback hit its most recent low at 92.39 on the September futures contract, which was 11 percent lower than the January highs. The inverse correlation between the dollar and raw material prices caused some commodities prices to finally take note of the price action in the U.S. currency. As the dollar index approaches the critical support level at 91.88, we have witnessed price strength in many commodities over recent weeks. The bull market in the dollar is almost three and a half years old, and a decline below 91.88 would do lots of technical damage to the greenback and could turn out to be highly bullish for the prices of many raw material markets. The price of September iron ore futures has moved from $52.31 per ton on June 13 to $75.42 on Aug. 10, a rise of over 44 percent in less than two months. The primary ingredient in steel has taken off to the upside. September iron ore futures closed last Friday at just under $72 per ton. There are many other examples of raw material markets that have moved to the upside over recent weeks, but many of the rallies have been tepid considering a move in the dollar of 11 percent in just seven and a half months. Commodities tend to be the most volatile asset class, and such a move in the currency that is the benchmark pricing mechanism for the sector should have caused even more dramatic gains. However, the raw materials sector could be on the verge of another big move to the upside if the dollar takes out critical support on the downside in the weeks ahead.”
The Broad Index value of the US dollar is reported several days in arrears by the Federal Reserve; the latest value was published on Aug. 11. Figure 1 shows the index value since January 2011.
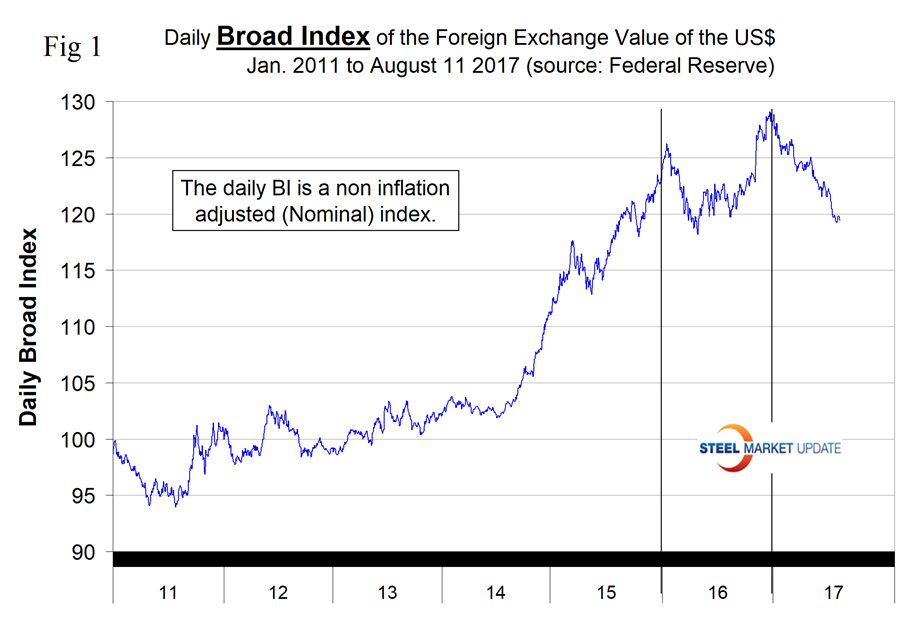
In 2017, the dollar has declined by 7.4 percent, but had stabilized in the two weeks prior to Aug. 11. The dollar had a recent peak of 128.963 on Jan. 3, which was the highest value since July 4, 2004. Since then the dollar has weakened to 119.44.
Each month, we publish an update of Table 1, which shows the value of the U.S. dollar against the currencies of 16 major global steel and iron ore trading nations.
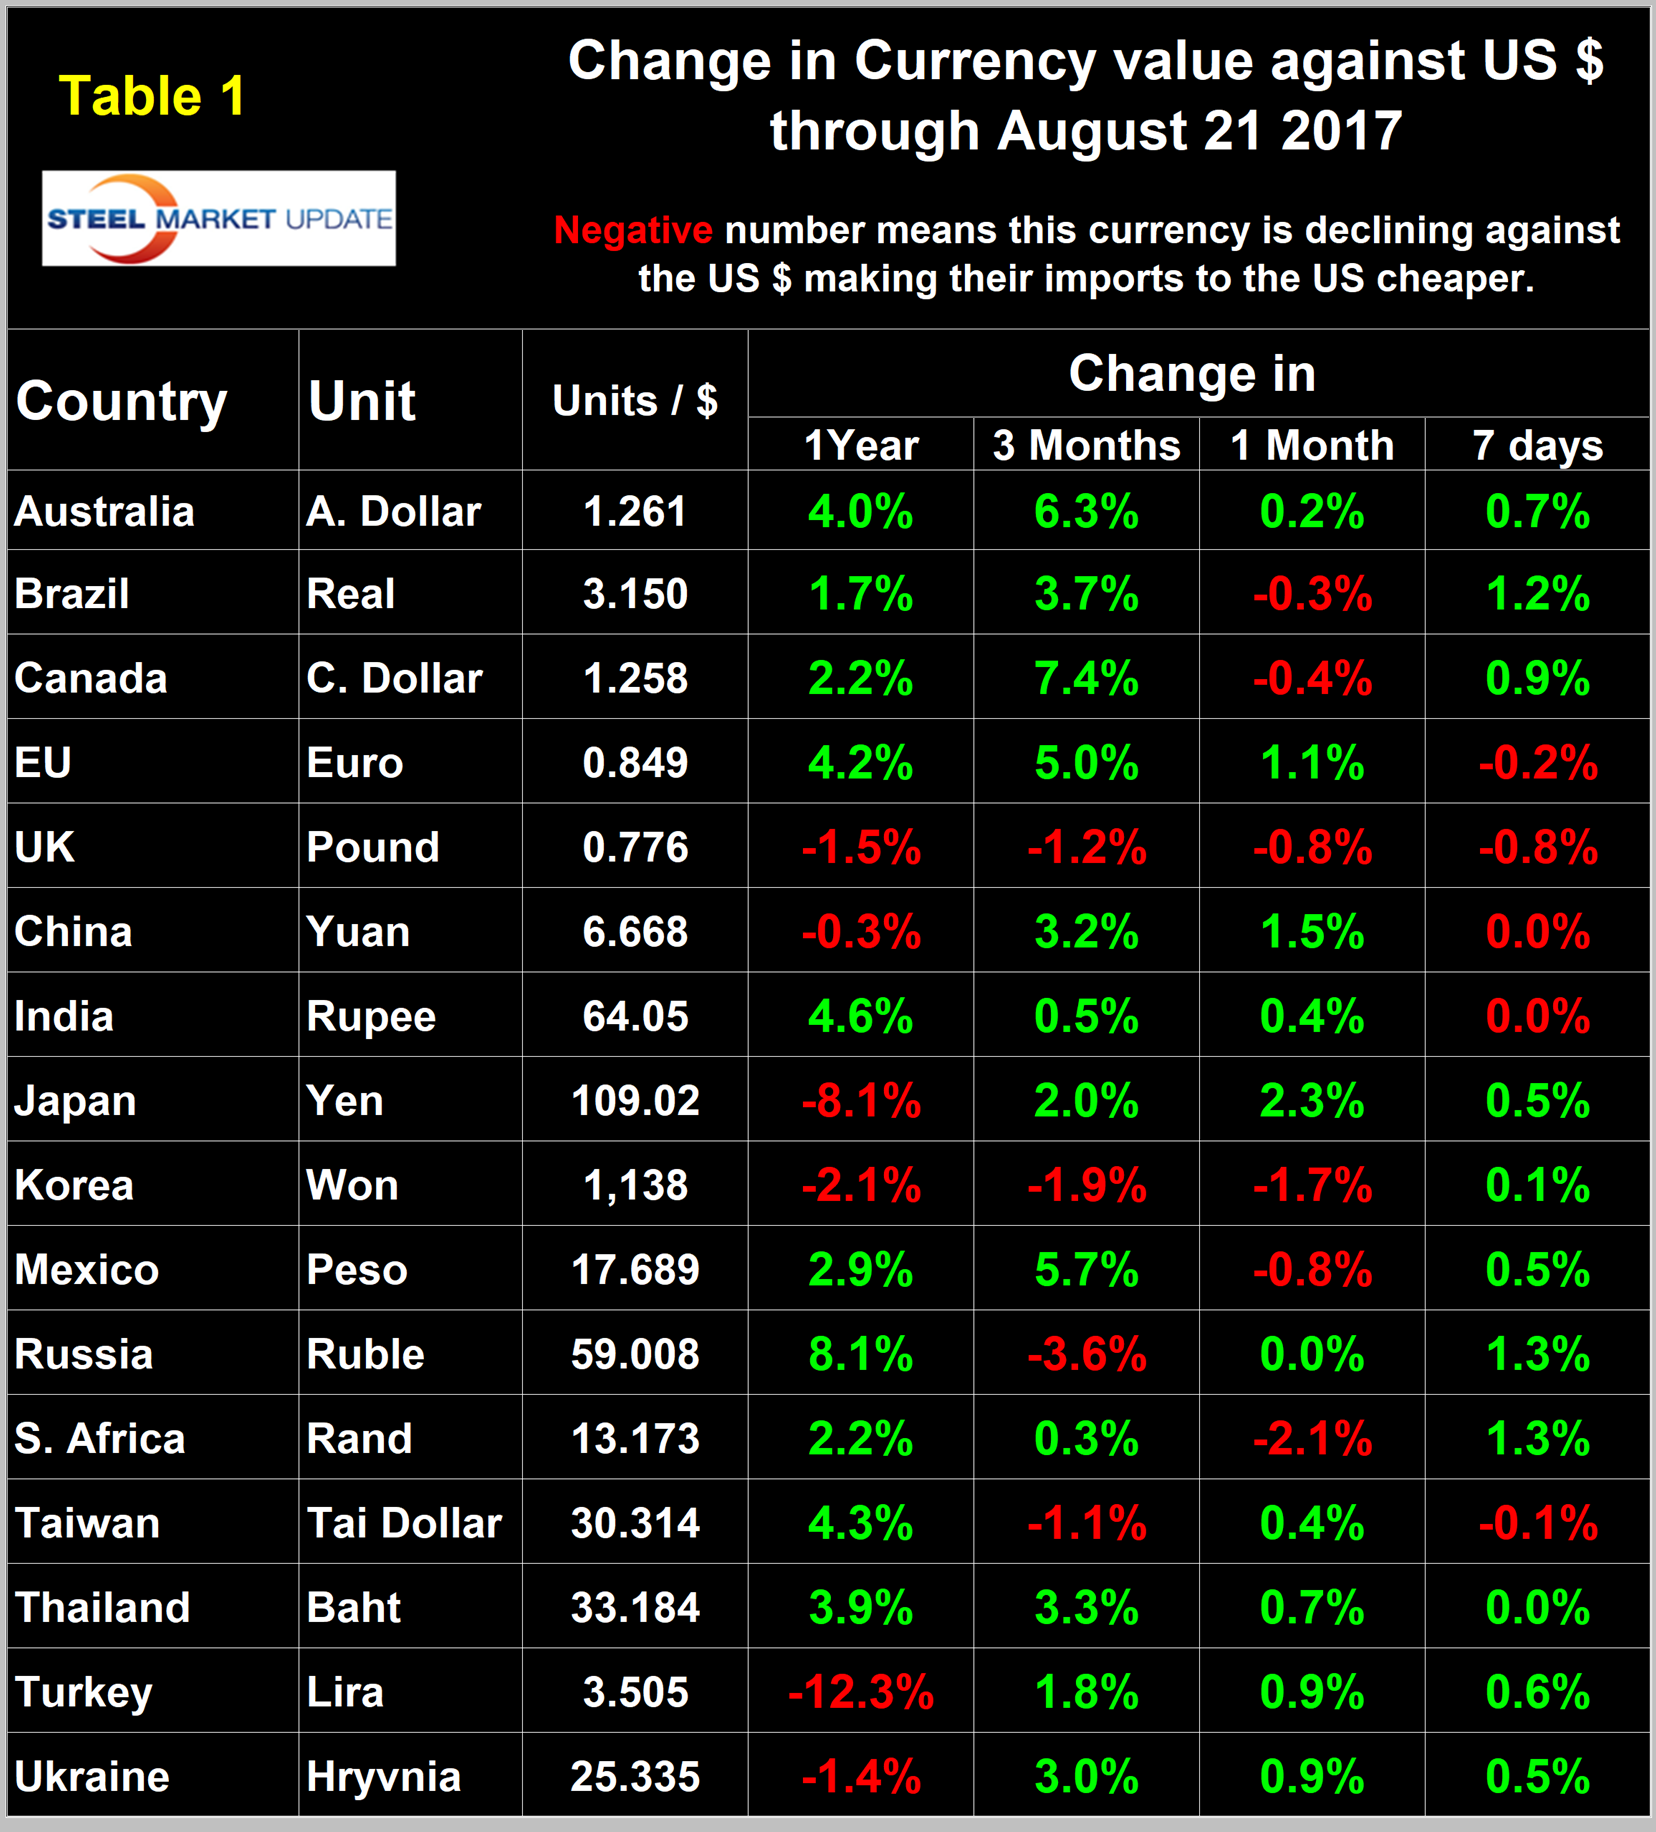
The table shows the change in value in one year, three months, one month and seven days. Even though it covers four different time frames, it is still a bit of a snapshot, which is something we try to avoid in all our data presentations. Direction is everything. We are now taking a supplemental look as shown in Figure 2.
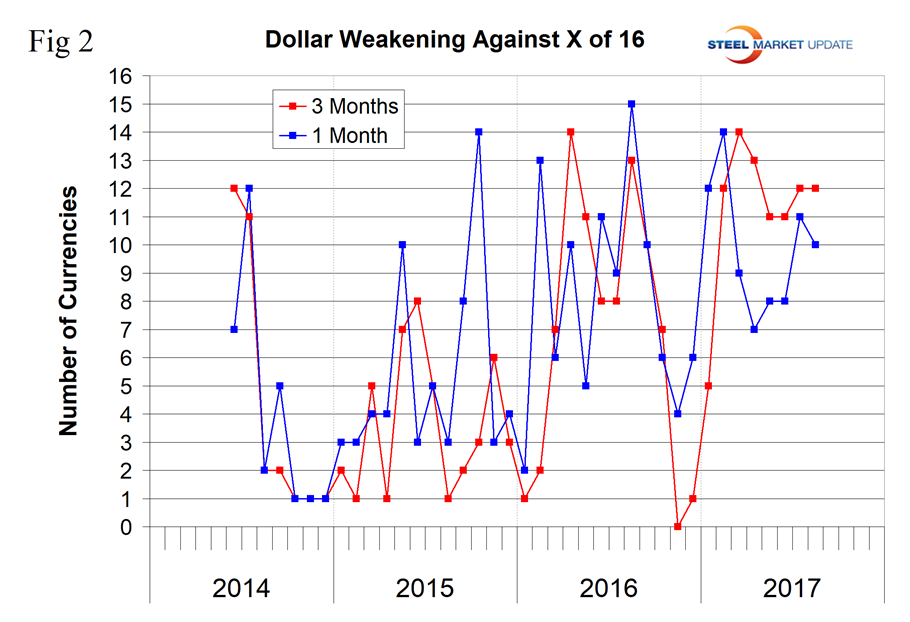
This shows that in the last three months, the dollar has weakened against 12 of the 16 currencies at the three-month level, which was the same as in our previous report of July 18. However, at the seven-day level, the dollar depreciated against all 16 in our July report. Looking at the situation on Aug. 21, the dollar weakened against 11 of the 16 in the previous seven days. A declining dollar puts upward pressure on all commodity prices that are greenback denominated. Table 1 is color coded to indicate strengthening of the dollar in red and weakening in green. We regard strengthening of the U.S. dollar as negative and weakening as positive because of the effect on the trade balance of all commodities and of the total national trade deficit.
In each of these reports, we comment on several of the 16 steel and iron ore trading currencies listed in Table 1, and over a period of several months will describe the history of all of them. Charts for each of the 16 currencies are available through Aug. 21 for any premium subscriber who requests them. Our commentaries include quotations from experts we regard as credible to explain some of the recent currency moves.
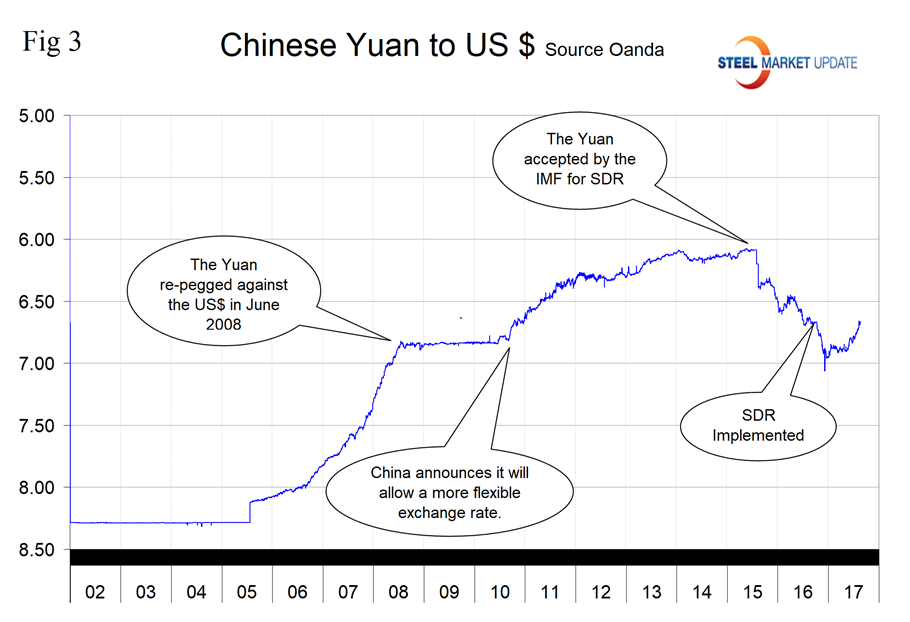
The Chinese Yuan. Is China a currency manipulator? On Aug. 15, Andrew Hecht wrote: “Up until the last few years, the Chinese economy had been growing at a double-digit pace. However, it has cooled, and economic growth in China is now somewhere in the 6-7 percent level. Considering how Chinese GDP has swelled over past decades, the current rate of growth remains impressive given the total size of the nation’s economy. China has long pegged the value of their currency to the U.S. dollar, and the fact that it is not convertible on the world’s foreign exchange market has given the government lots of control when it comes to the exchange rate of the yuan. The Chinese government has pursued a policy of keeping the yuan weak to encourage exports and support business within the country. As the Chinese strictly control their currency, and there are many restrictions for taking money out of China, it has been easy for the government to manipulate the value of the yuan against the dollar and other currencies of the world.
On Aug. 14, Investing.com wrote: “The People’s Bank of China set the yuan mid-point at 6.6601 against the dollar on Monday, compared to the previous close of 6.6666, the strongest since Sept. 22, 2016, and the fifth-straight higher fixing. The China Foreign Exchange Trade System sets the weighted average of prices given by market makers. The highest and lowest offers are excluded from the calculation. The central bank allows the dollar/yuan rate to move no more than 2 percent above or below the central parity rate. Market watchers see a yuan level of 7 against the dollar, USD/CNY, as a key touchstone for sentiment in the near term.”
Evidently the answer is yes, China is a currency manipulator. Figure 3 shows the value of the yuan, which has appreciated by 3.2 percent in the last three months, but has lost 0.3 percent in 12 months.
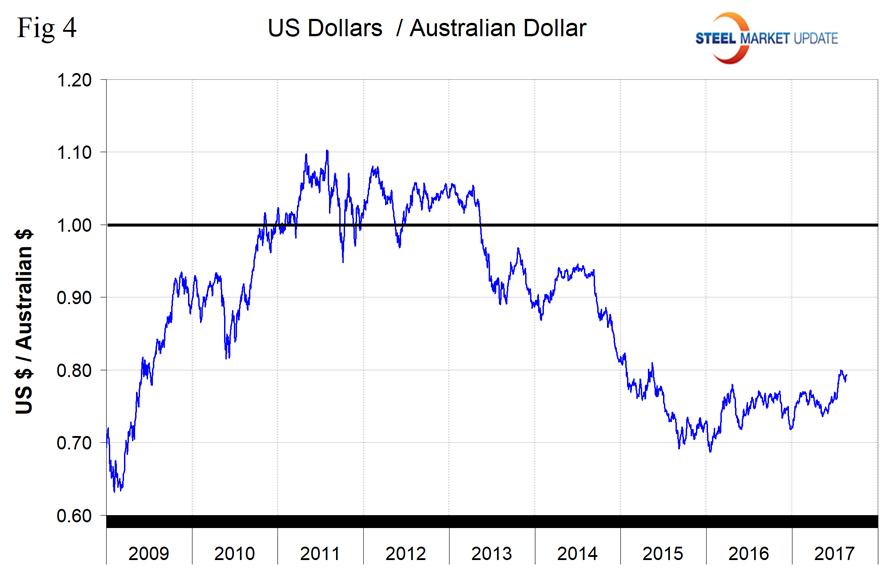
The Australian Dollar. Figure 4 shows the value of the Aussie since January 2009. There has been an erratic strengthening trend against the U.S. dollar since the beginning of last year. In the last three months, the Australian dollar has strengthened by 6.3 percent, which was the highest appreciation of any of the 16 currencies under examination here.
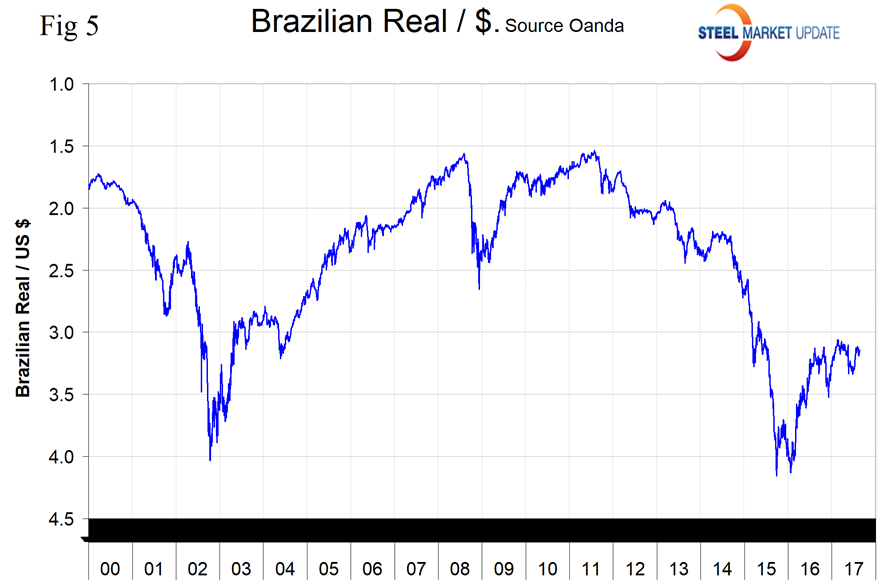
The Brazilian Real. Brazil’s real has strengthened by 3.7 percent against the greenback in the last three months as shown in Figure 5. On Aug. 21, it took 3.15 Reals to buy one U.S. dollar. This was an appreciation of 1.7 percent in 12 months.
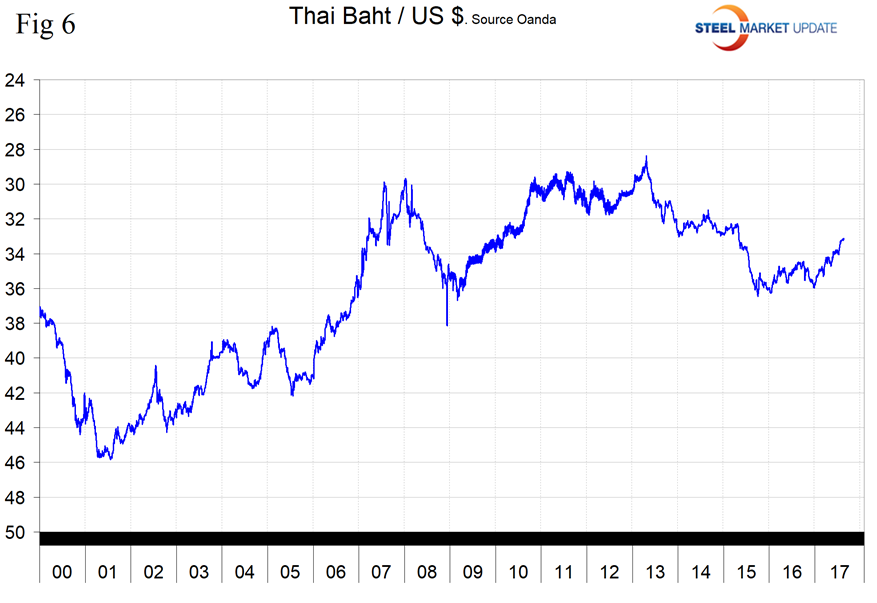
The Thailand Baht. Thailand’s baht strengthened by 3.3 percent in the three months prior to Aug. 21, at which time it took 30.3 Baht to buy one U.S. dollar (Figure 6). Since Jan. 1, the Baht has strengthened by 7.5 percent. Through mid-August licenses, Thailand had shipped 265,000 tons of steel into the U.S. .and was the 16th highest volume source. The top four products from Thailand were standard pipe, HDG sheet, cold rolled sheet and oil country goods, in that order. These four accounted for 91 percent of Thailand’s steel shipments to the U.S. in 2017.
The Euro. On Aug. 21, Citylitics, a long horizon research analyst, wrote: “Last week, the ECB published the minutes of their last meeting in July and stated the following—’Regarding exchange rates, while the appreciation of the euro to date could be seen in part as reflecting changes in relative fundamentals in the euro area vis-à-vis the rest of the world, concerns were expressed about the risk of the exchange rate overshooting in the future.’ Indeed, the ECB’s ‘verbal intervention’ is not surprising. I have recently argued that as long as the ECB struggles with low inflation, the last thing they want is further euro appreciation that would press inflation even lower. Moreover, it is worth noting that at the time of the meeting in July, the EUR/USD traded around levels of 1.14. This is substantially below the current levels and was already an issue for the ECB. The biggest question is how all this affects future ECB’s monetary policy stance and EUR/USD movements? At the beginning of 2014, the euro faced significant appreciation pressures with the EUR/USD exchange rate approaching the 1.40 mark. In such circumstances, Mario Draghi [president of the European Central Bank] used verbal interventions to lower the appreciation pressures and he was indeed quite successful. By the end of 2014, the EUR/USD has fallen to 1.20. In my opinion, the possibility of the ECB’s verbal interventions should not be excluded in the forthcoming period. Draghi’s appearance at Jackson Hole conference this week seems like a good opportunity.”
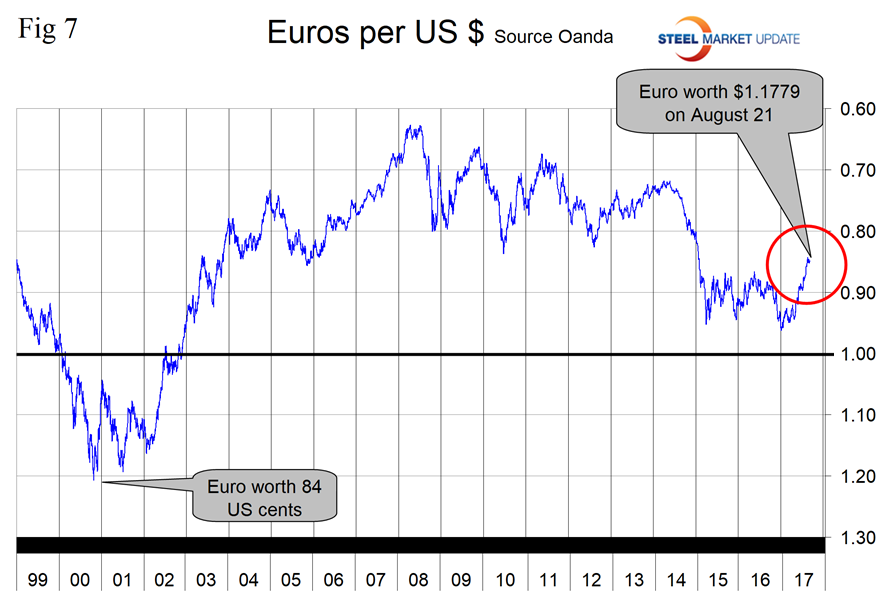
The euro has strengthened against the dollar by 5.0 percent in three months and reached 1.1779 U.S. dollars/euro on Aug. 21 (Figure 7). Year to date, the euro is up by 11.9 percent.
Explanation of Data Sources: The broad index is published by the Federal Reserve on both a daily and monthly basis. It is a weighted average of the foreign exchange values of the U.S. dollar against the currencies of a large group of major U.S. trading partners. The index weights, which change over time, are derived from U.S. export shares and from U.S. and foreign import shares. The data are noon buying rates in New York for cable transfers payable in the listed currencies. At SMU, we use the historical exchange rates published in the Oanda Forex trading platform to track the currency value of the U.S. dollar against that of 16 steel and iron ore trading nations. Oanda operates within the guidelines of six major regulatory authorities around the world and provides access to over 70 currency pairs. Approximately $4 trillion U.S. dollars are traded every day on foreign exchange markets.


