

Market Data

July 12, 2017
Shipments and Supply of Sheet Products through May
Written by Peter Wright
Apparent supply is a proxy for market demand, and for hot rolled coil has been growing strongly this year. Imports continue to be an increasing factor in the sheet markets. There is a major difference in import market share for the four major sheet products.
This report summarizes total steel supply from 2003 through May 2017 and year-on-year changes. It then compares domestic mill shipments with total supply to the market. It quantifies market direction by product and enables a side-by-side comparison of the degree to which imports have absorbed demand. Sources are the American Iron and Steel Institute and the Department of Commerce with analysis by SMU.
Table 1 describes both apparent supply and mill shipments of sheet products (shipments includes exports) side by side as three-month averages through May for both 2016 and 2017.
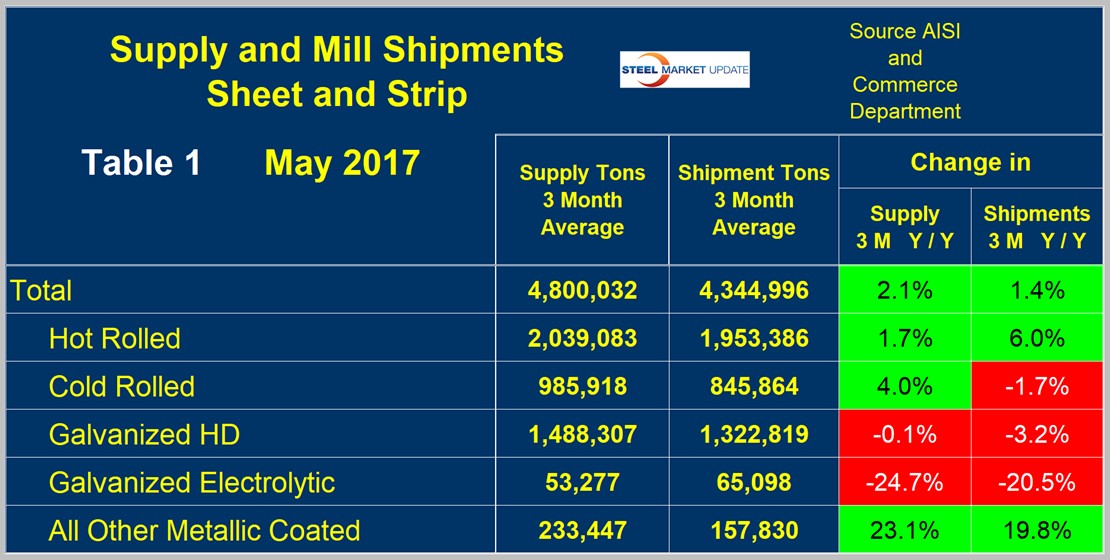
Apparent supply is a proxy for market demand. Comparing these two time periods, total supply to the market was up by 2.1 percent and shipments were up by 1.4 percent. The fact that the increase in supply was more than the increase in mill shipments means that imports were more of a factor in the market compared to the same three months last year. Table 1 breaks down the total into product detail, and it can be seen that supply grew by more than shipments for every product except HRC, which was a repeat of our April analysis. Electrogalvanized is an oddball because it has net exports.
A review of supply and shipments separately for individual sheet products is given below.
Apparent Supply
Apparent Supply is defined as domestic mill shipments to domestic locations plus imports. In the three months through May 2017, the average monthly supply of sheet and strip was 4.8 million tons, up by 2.1 percent compared to the same period ending May 2016 (year/year). In the three months through May compared to the three months through February, supply was up by 5.6 percent. The short-term increase (three months) compared to the long term improvement (12 months) means that through May momentum was positive. There is no seasonal manipulation of any of these numbers. By definition, y/y comparisons have seasonality removed but 3m/3m comparisons do not. Table 2 shows the change in supply by product on this basis through May.
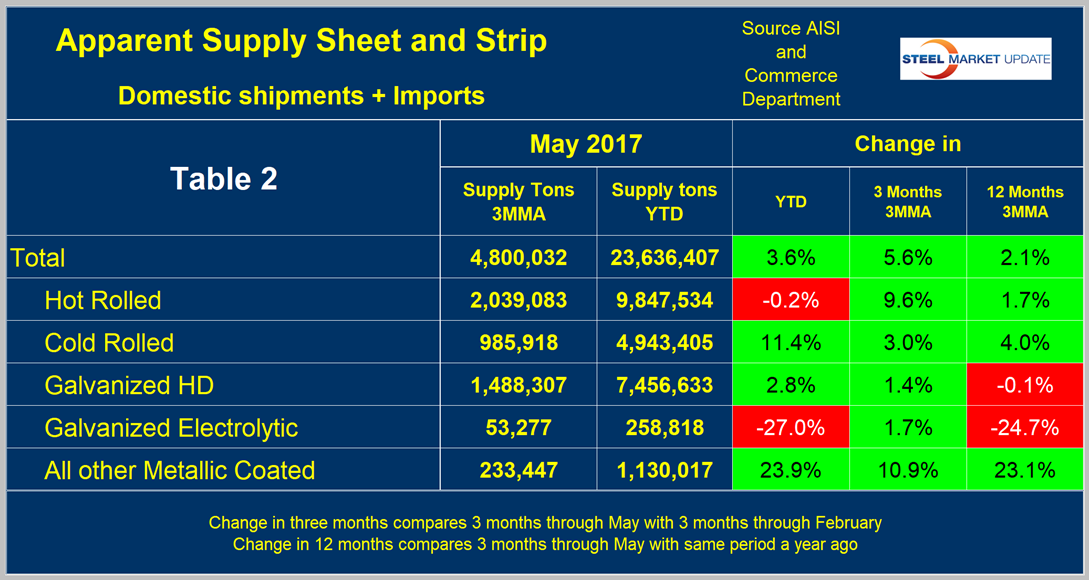
Momentum was very positive for HRC, but CRC slowed slightly. OMC (other metallic coated, mainly Galvalume) slowed substantially, but still had 10.9 percent growth in three months through May compared to three months through February.
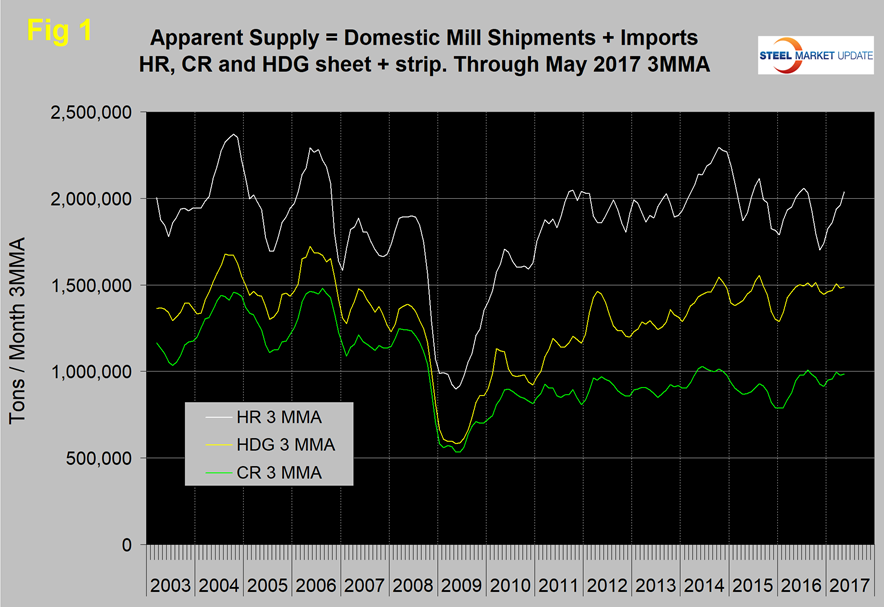
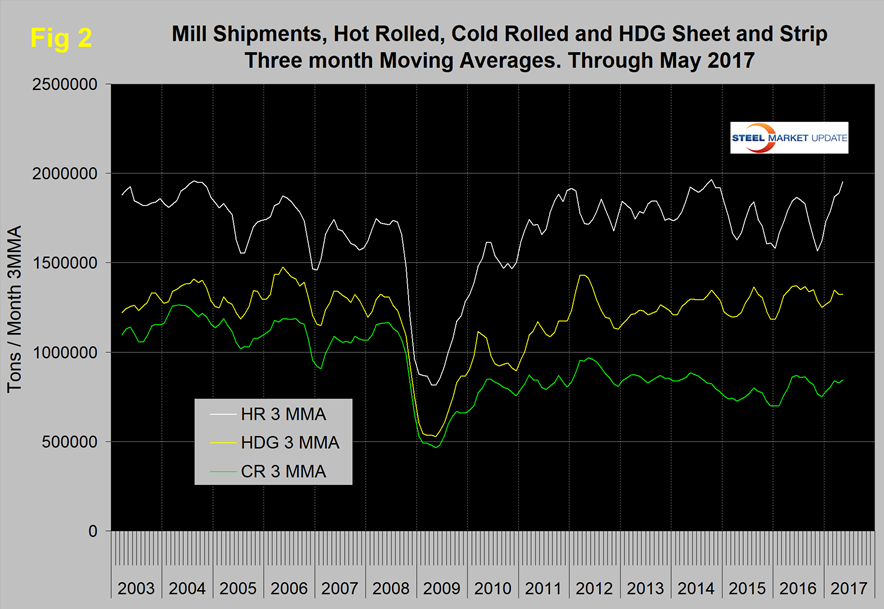
Figure 1 shows the long-term supply picture for the three major sheet and strip products, HRC, CRC and HDG, since January 2003 as three-month moving averages. All three products have improved this year, particularly HRC.
Mill Shipments
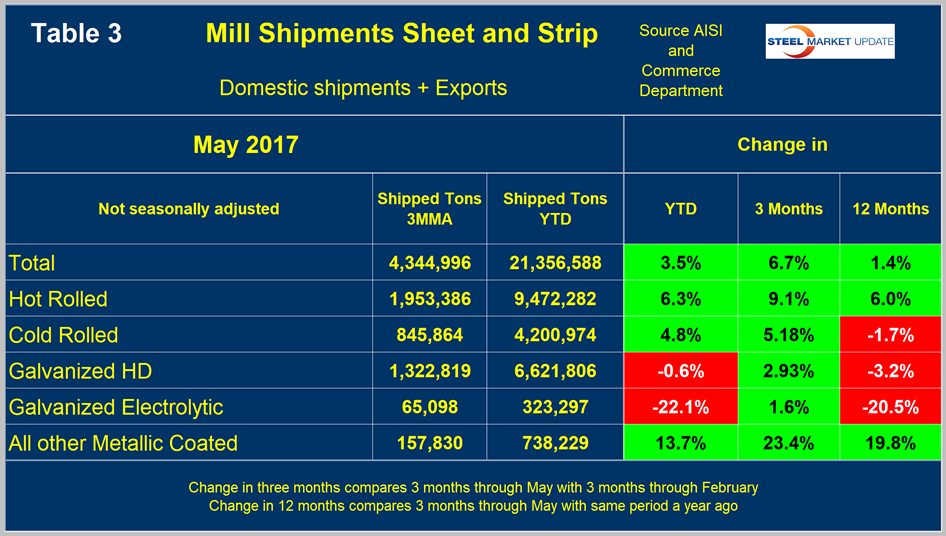
Table 3 shows that total shipments of sheet and strip products including hot rolled, cold rolled and all coated products were up by 1.4 percent in three months through May year over year and up by 6.7 percent comparing three months through May with three months through February.
These February/May numbers have a seasonal content, but discounting that we think that momentum really is positive for all individual products. Figure 2 puts the shipment results for the three main products into the long-term context since January 2003. This looks a lot like Figure 1 because the change in shipments and supply were similar in the recent data.
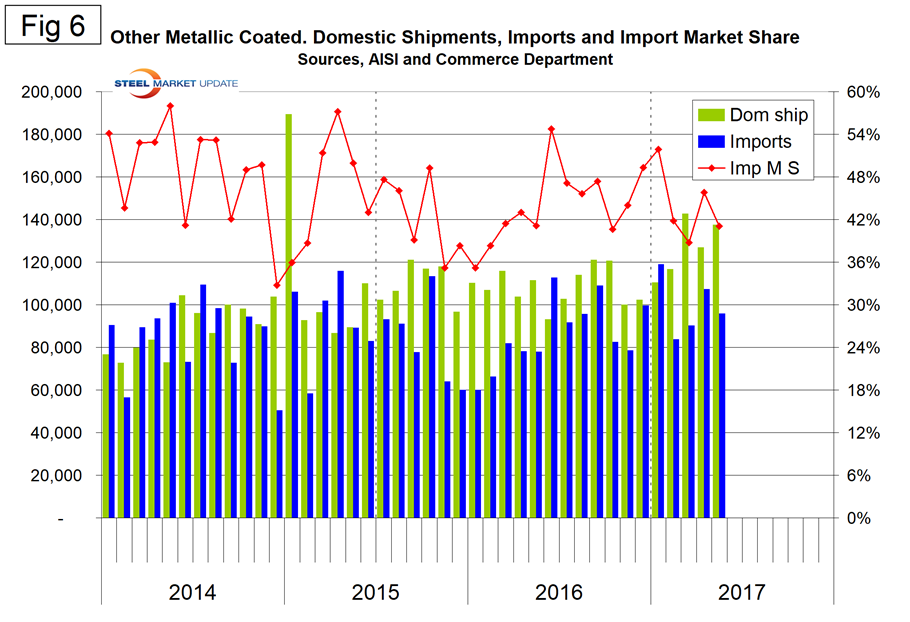
Import Market Share
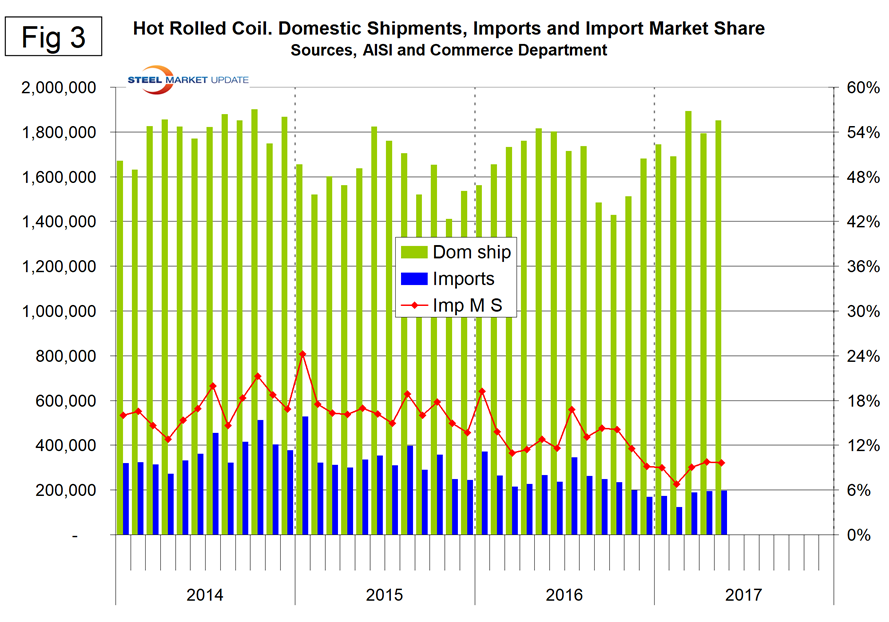
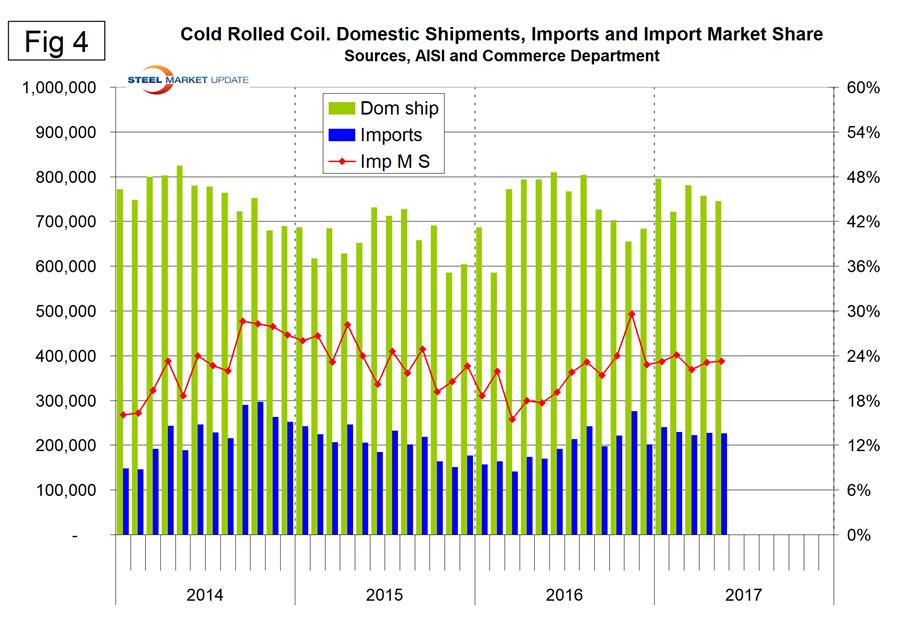
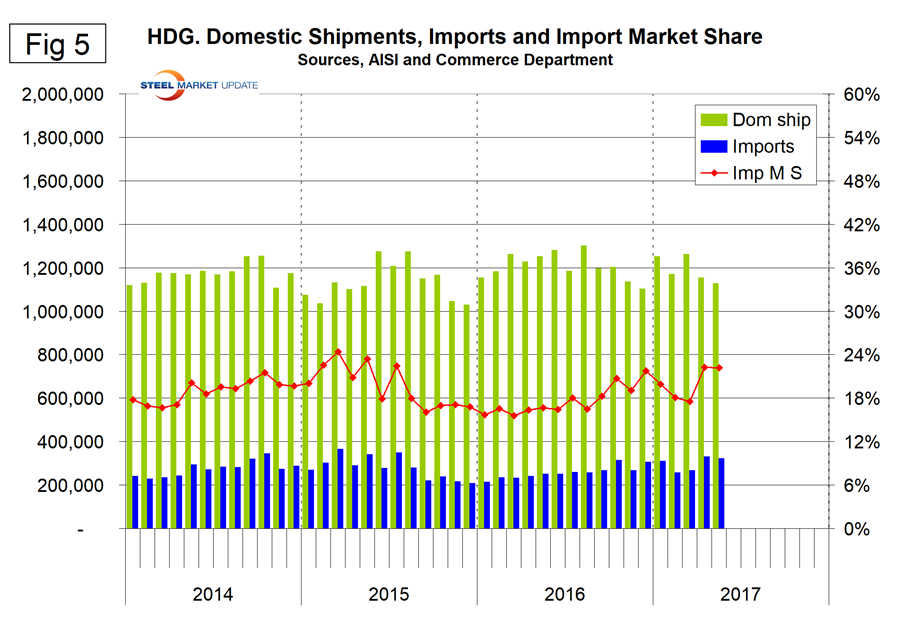
Figures 3, 4, 5 and 6 show the import market share of HRC, CRC, HDG and OMC, respectively. Note the right-hand Y axes of all four charts have the same scale to give true comparability. In May, the import share of HRC was 9.6 percent, of CRC was 23.3 percent, of HDG was 22.2 percent and of OMC was 41.1 percent.
SMU Comment: A problem with this data is that it’s now well into July and the latest information that we have for shipments and supply is for May. The AISI puts out weekly data for crude steel production, the latest for which was the week ending July 8. This provides the most current data for steel mill activity. Figure 7 shows the y/y change in weekly crude output on a four-week moving average basis.
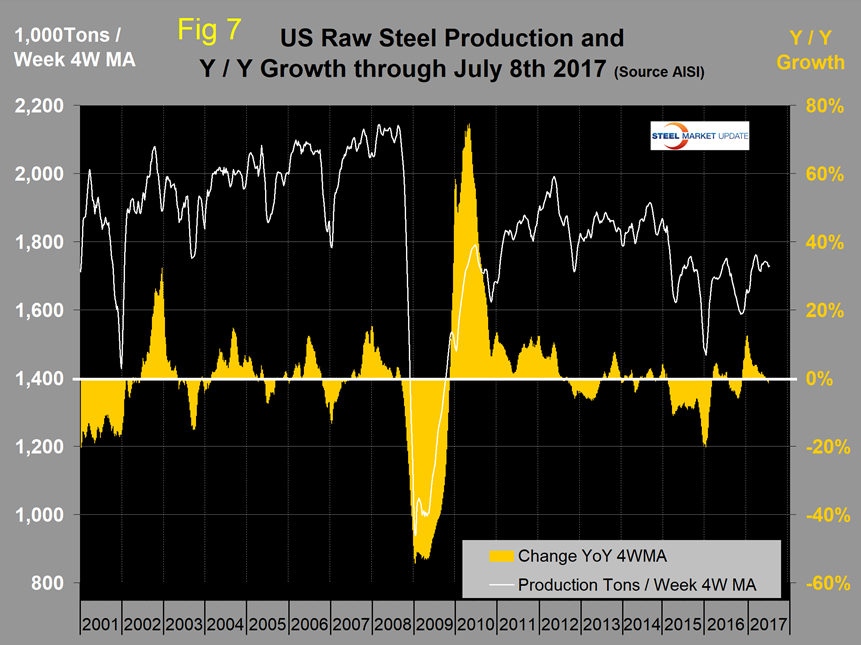
Growth became positive year over year in the week ending Nov. 19 last year and was positive for 30 weeks. However, in the last five weeks, growth was zero in two and negative in three. Licensed imports through June show a surge in the latest data, which is more evidence of a strengthening market and a continuing increase in import market share since crude steel production in June had negative growth. Based on the strength of the economic indicators analysis that SMU performs and our proprietary measure of buyer sentiment, we are expecting demand for sheet products to continue to increase through the third quarter.


