Prices

April 27, 2017
Hot Rolled Futures: Not Much Change to Forward Curve
Written by Jack Marshall
The following article on the hot rolled coil (HRC) steel and financial futures markets was written by Jack Marshall of Crunch Risk LLC. Here is how Jack saw trading over the past week:
Steel
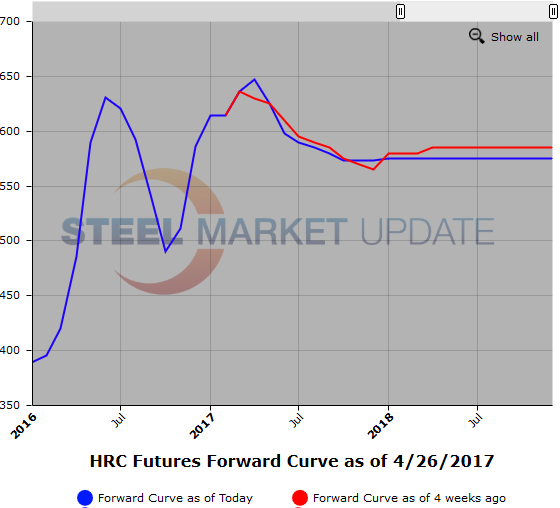
With the exception of HR spot not much has changed this past month in the HR futures curve.
When you compare the price settlements for the futures curve from the end of last month to Wednesday’s price settlement values, there is only a slight difference in price between the two dates. The largest difference is that Cal’18 has declined about $10/ST between the two dates. So the curve has remained relatively unchanged through the remainder of Cal’17 while the spot has risen and fallen with a net decline of $19 ( $648 -$629), the curves by quarter paint a very similar picture with roughly $40 of backwardation between Q2’17 and Q3’17 and and significantly less between Q3’17 and Q4’17. Q4’17 remains well anchored in the mid $570/ST range with decent two way interest. So if spot continues to slide we could see the curve flatten. Lately the bulk of the futures interest and inquiries have been in the June 2017 and Q4’17. With spot HR coming off $31 from the recent high of $660/ST and the backwardation in the curve remaining fairly stable at $50/ST through Cal’17 and Cal’18 we have seen more inquiries for longer dated strips.
This past week volumes have been modest with 12,080 ST trading mainly in the balance of 2017 periods. Jun’17 traded at $619/ST[$30.95/cwt] on Monday and then traded on Wednesday at $606/ST[$30.30/cwt] and $598/ST[$29.90/cwt]. Currently Jun’17 is offered at $605/ST[$30.25/cwt]. Q3’17 traded today at $585/ST[$29.25/cwt]. Q4’17 traded $580/ST[$29.0/cwt] on Monday and $573/ST[$28.65/cwt] yesterday and traded $575/ST[$28.75/cwt] today. Jan/Oct’18 traded at $575/ST equivalent as part of a larger strip transaction.
Below is a graph showing the history of the hot rolled futures forward curve. You will need to view the graph on our website to use its interactive features, you can do so by clicking here. If you need assistance with either logging in or navigating the website, please contact our office at 800-432-3475 or info@SteelMarketUpdate.com.
Scrap
Early chatter has prime scrap trading sideways to slightly higher or lower depending on who you ask. There is some discussion that supplies might be getting tighter but probably more of a regional problem.
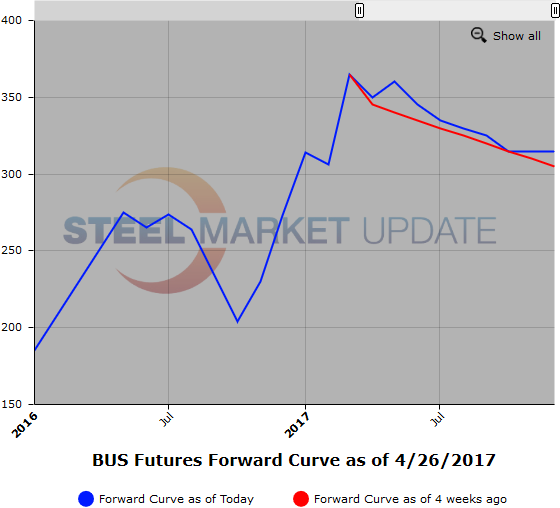
BUS futures have been quiet lately as participants unwilling to reach given uncertainty of market direction. Latest Q3’17 BUS $320/$335 per GT and 2H’17 $310/325 per GT. Cal’18 selling interest comes in around $315/GT.
In LME steel scrap it has been a busy latter half of the week. A bit of restocking by Turkish mills has been pushing prices up last day or so adding to market volatility. LME scrap futures have been trading between $260 and basically $280 per MT for all months in balance Cal’17. $268/MT traded May’17 on Friday in 1,000 MT and then at $260/MT in 1,000 MT on Tuesday and prices have rallied up from there coming into the latter part of the week. $265/MT traded 2H’17 on Monday in 1,000 MT per month. Today Q3’17 Traded at $269.50/MT in 1,000 MT per month.
Below is another graph showing the history of the busheling scrap futures forward curve. You will need to view the graph on our website to use its interactive features, you can do so by clicking here. If you need assistance with either logging in or navigating the website, please contact our office at 800-432-3475 or info@SteelMarketUpdate.com.


