

Market Data

November 20, 2016
Indirect Steel Trade – It's Bigger Than You Think
Written by Paul Lowrey
This article was written by Paul Lowrey, President of Steel Research Associates, LLC.
Over the last couple of years, a lot of attention has been paid to the high level of imports of steel mill products into the USA. Surprisingly, however, indirect steel imports have not received a lot of attention. Both the American Iron & Steel Institute (AISI) and World Steel Association (WSA) have done a lot of work in this area. Indirect steel trade is comprised of imports and exports of steel-containing goods (automobiles, appliances, etc.) expressed in tons of steel.
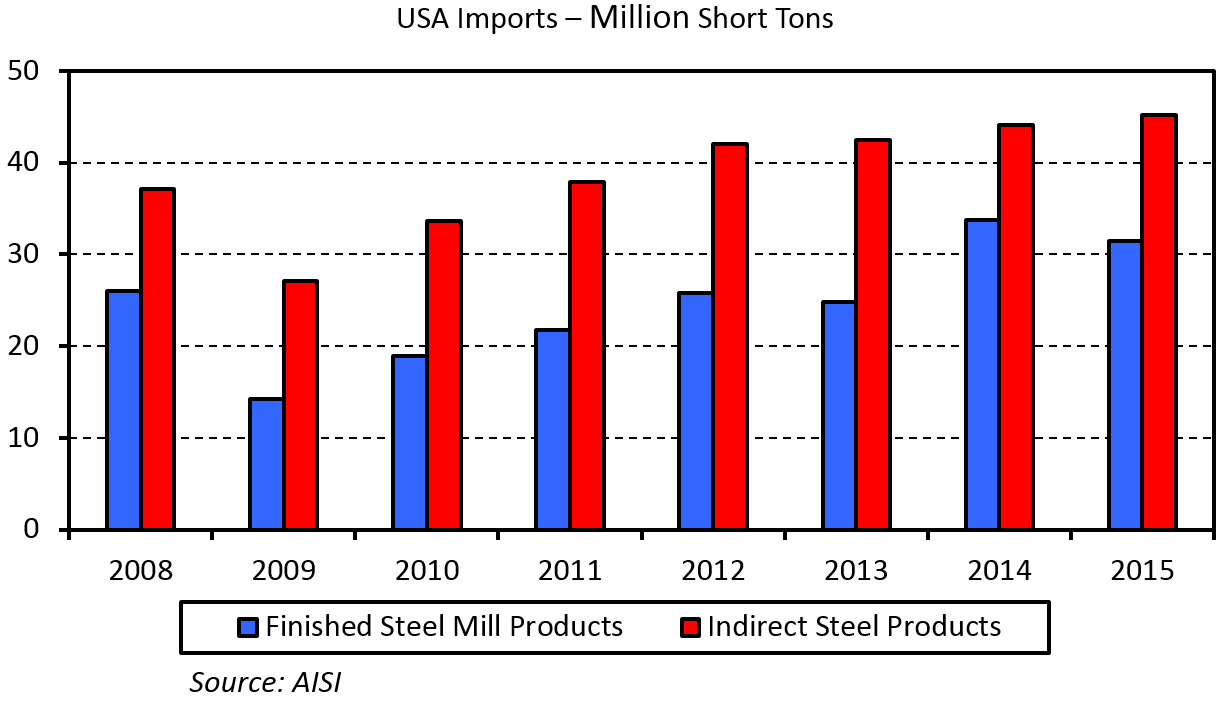
The chart below shows a comparison of imports of finished steel mill products and indirect steel products over the last 8 years (data does not exist before this). As you can see, imports of indirect steel products are 10 to 15 million tons per higher than imports of finished steel mill products. Looked at another way, indirect steel product imports are roughly 60 percent of all steel imports (direct and indirect).
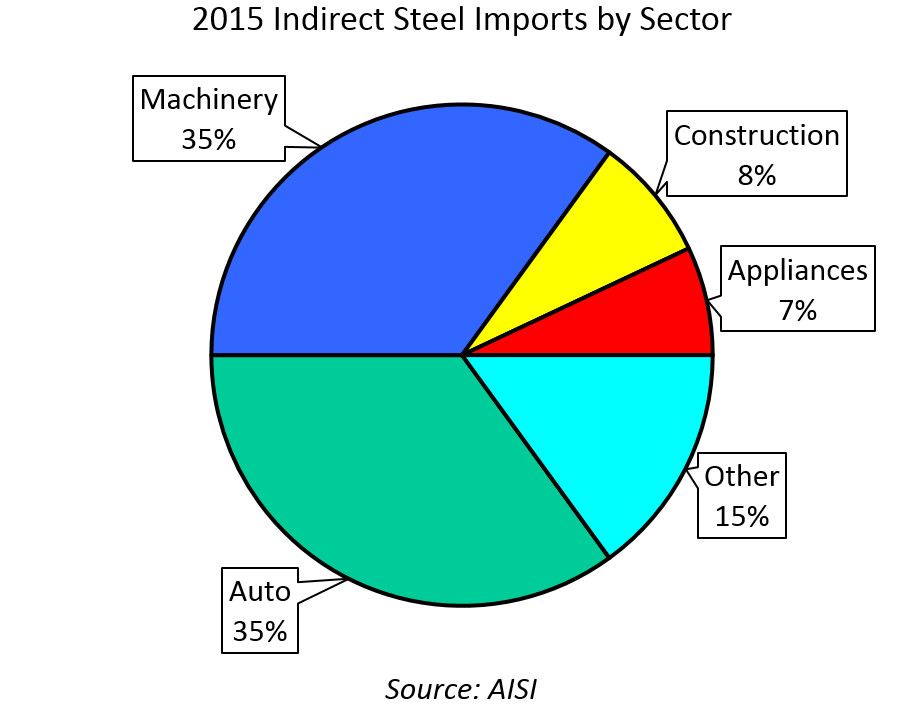
The next chart shows the composition of indirect steel imports by type of manufactured good. Not surprisingly, automotive is the largest sector and a significant amount of the imports come from Canada and Mexico. However, two-thirds of indirect steel imports come from other sectors, and a major portion of those imports are from other regions of the world.
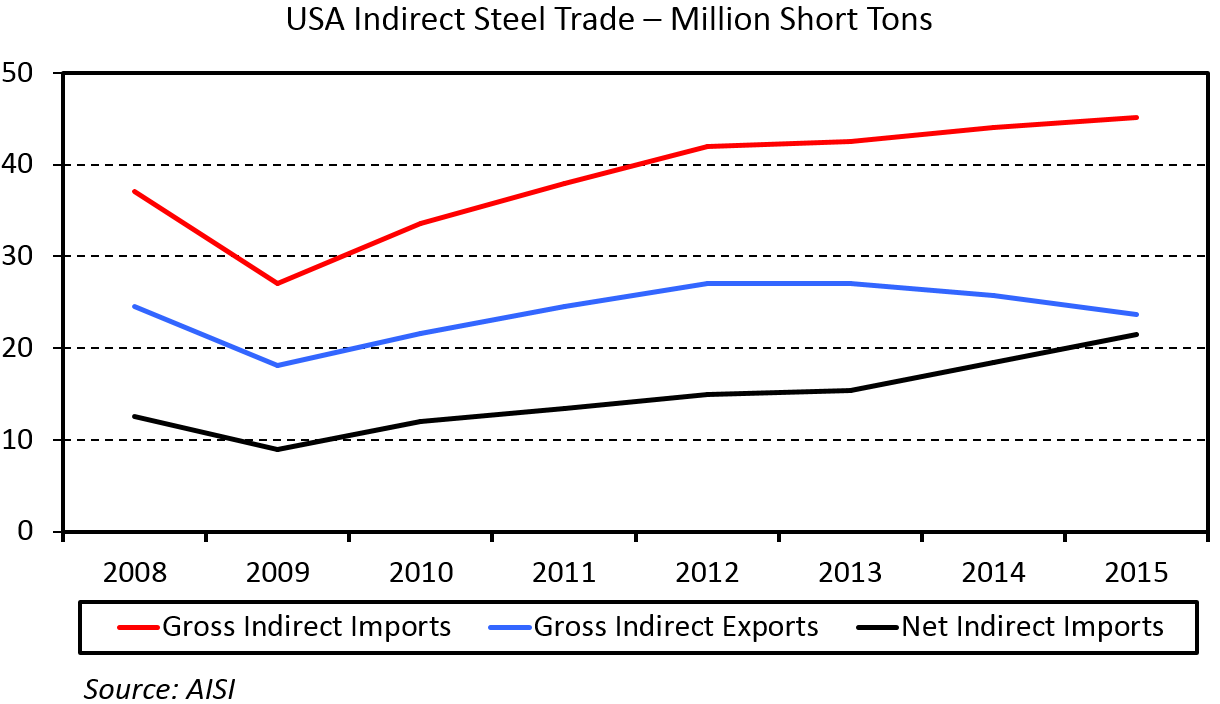
To be fair, the USA also exports a significant amount of indirect steel products. The following chart shows gross indirect imports, gross indirect exports, and net indirect imports (imports minus exports). Gross indirect exports are essentially unchanged over the last 8 years. Gross indirect imports, however, have grown significantly. On a net basis, USA imports of indirect steel products have nearly doubled in the last 8 years. The current trade deficit is 21.4 MT. This amount is equivalent to ten domestic steel mills producing an average of 2.0 million tons per year each.
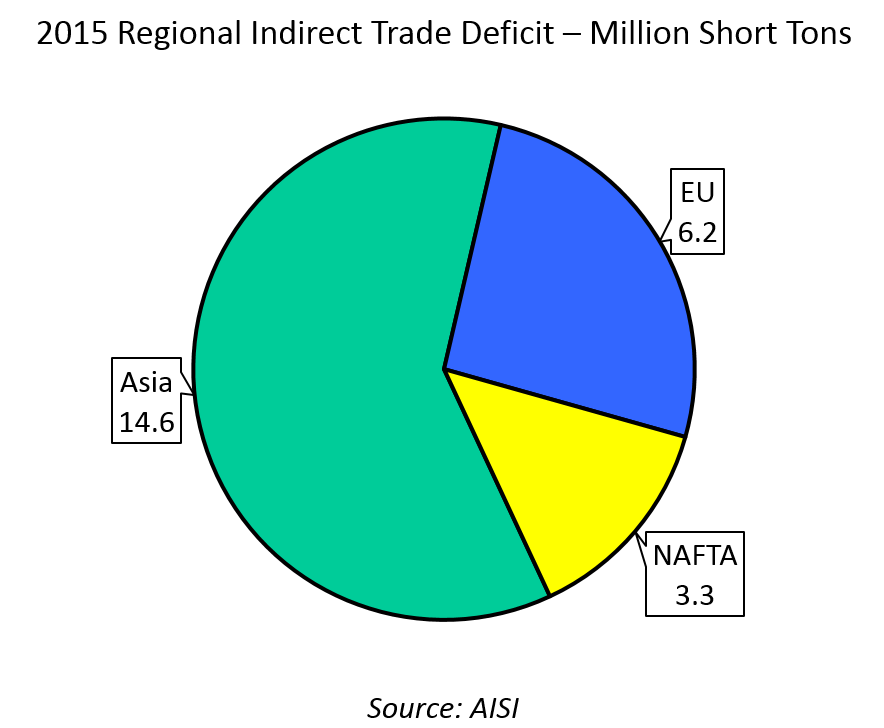
Finally, the last chart shows the indirect trade deficit (net import basis) by major region of the world. Asia is about 60 percent of the total, followed by the EU at 25 percent and NAFTA at 15 percent. The data in the chart adds up to 24.1 million tons. The USA actually had a 2.7 million ton indirect trade surplus with the rest of the world in 2015.
One can draw all kinds of conclusions on indirect steel trade – it’s a reflection of globalization, it’s caused by currency exchange rates, etc. One issue the author finds interesting is that it makes steel demand forecasting more difficult. Finished product steel demand in the USA peaked at 135 million tons in 2006. Last year, finished product steel demand was around 110 million tons and it will likely be lower this year. Different types of forecasting models (end-use sector activity, consumption per capita, and steel intensity of GDP) suggest that finished product steel demand should be higher – perhaps in the 115 to 120 million ton range. The growing indirect trade deficit seems to explain most of that difference.


