

Prices

April 7, 2017
Global Trade of Cold Rolled Coil Through Q4 2016
Written by Peter Wright
We are continuing our investigation to quantify the players in the global trade of both HRC and CRC. We now have data for all of 2016. This information is sourced quarterly from the Iron and Steel Statistics Bureau in the UK. Data is not very current because many countries are slow in reporting but we feel that the history does explain where we are now and shines a light on the relative position of the US in the global picture.
This update covers the global trade of CRC through Q4 2016.
In 2016 as a whole 40,208,000 metric tons of cold rolled coil were traded internationally. Excluding the tonnage traded within the EU the global total in 2016 was 30,867,000 metric tons. Figure 1 shows the total global tonnage quarterly since Q1 2006 and also the total excluding the inter EU volume.
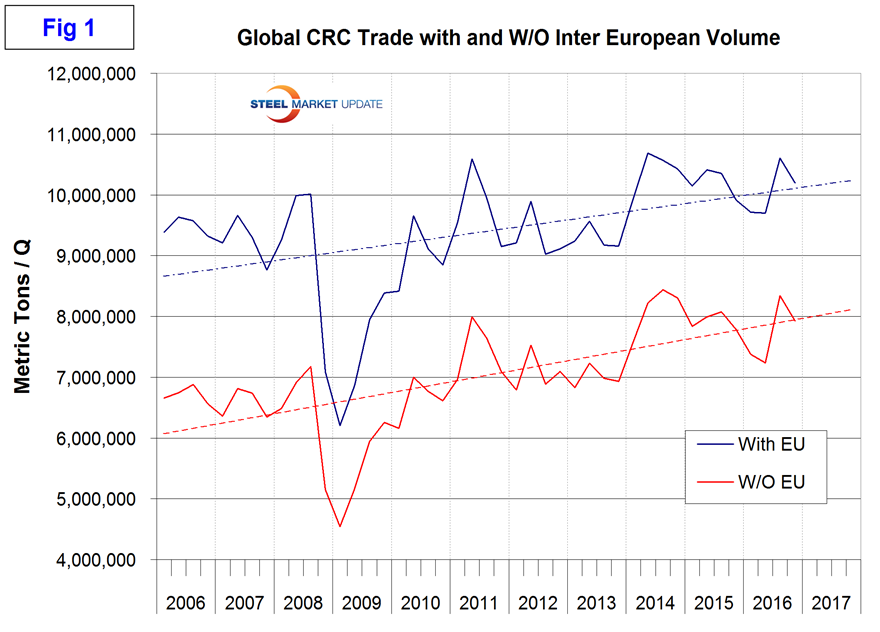
In this analysis we use only the total excluding the inter EU trade to provide what we think is a more representative base for comparisons. The highest tonnage quarter since our data begins was Q3 2014 with a total of 8,439,000 tons. The total global trade of CRC in Q4 was up by 1.8 percent from Q4 last year but down by 5.0 percent from Q3 2016. The seven major exporters in 2016 in order of volume were China, South Korea, Japan, the EU, Taiwan, Russia and India. Together these seven made up 83.9 percent of total global CRC trade in 2016. Figure 2 shows the relative size of China as an exporter.
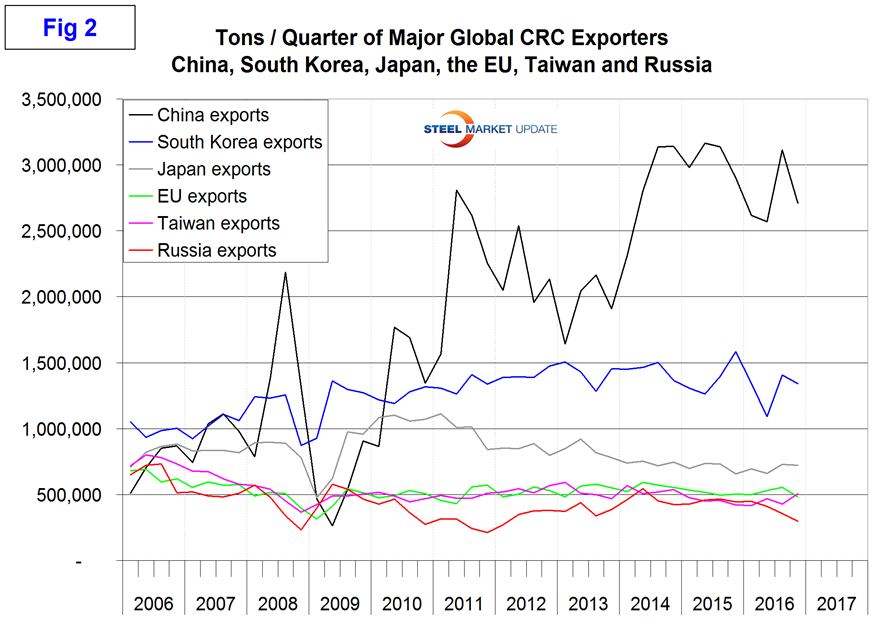
In 2016 as a whole South Korea exported exactly half as much as China and in the fourth quarter exported 46 percent of China’s total. China’s exports declined by 12.9 percent in Q4 as South Korea’s were down by 4.6 percent. China exported 11,010,000 metric tons CRC in 2016. Figure 3 shows the export market share of the top six nations.
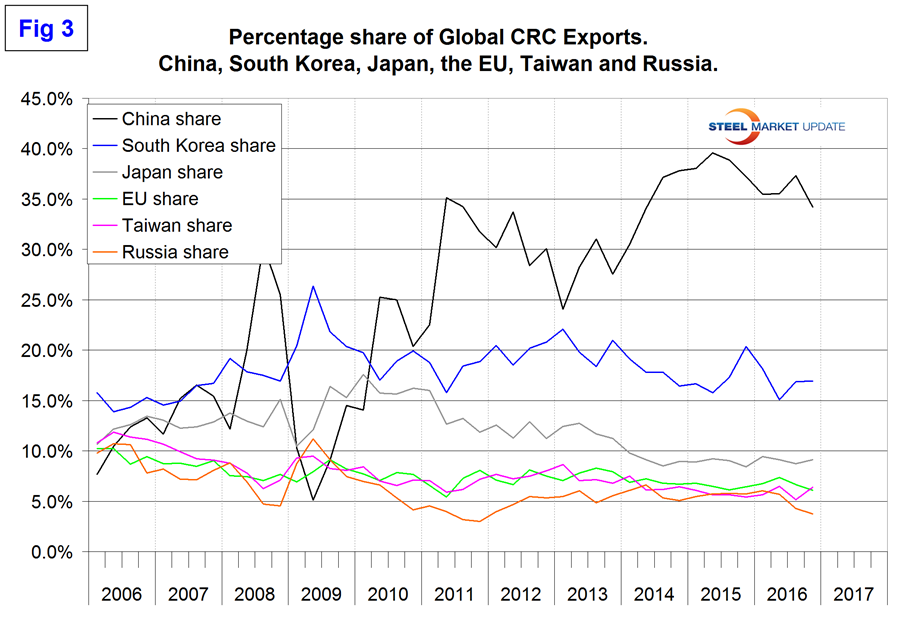
China has had a market share of >30 percent for the last twelve quarters with a declining trend since Q2 2015. South Korea is by far the largest volume destination for China’s exports as shown in Figure 4 but Vietnam has expanded rapidly and is up by 524 percent in eight quarters since Q1 2015 and reached second place as a destination in the second half of 2016.
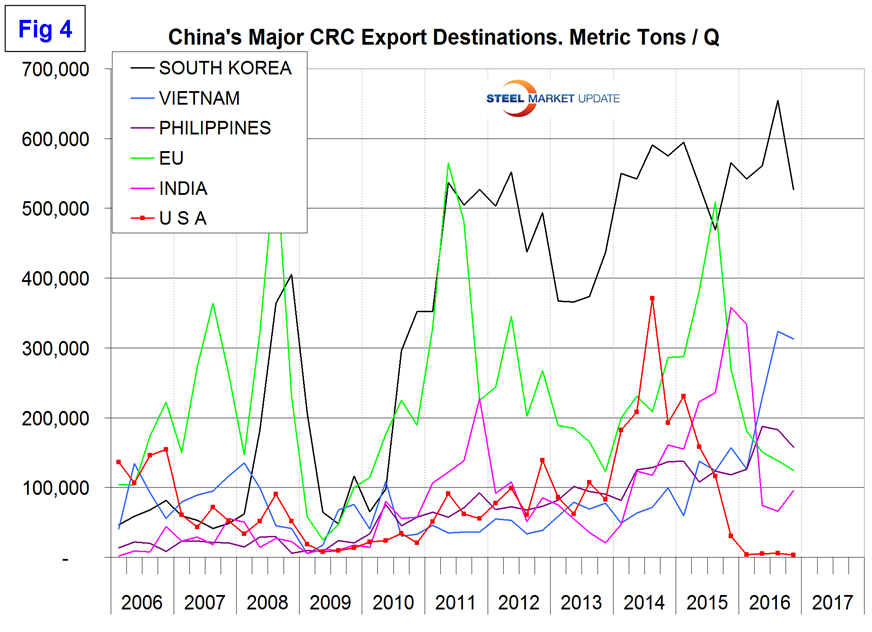
The US is included in Figure 4 to illustrate the effect of trade suites against China. China’s exports of CRC to the US were down from 536,000 tons in 2015 to 18,000 in 2016. As we continue to report quarterly on the global trade of CRC we will try to identify where the US tonnage was diverted to. At first glance it looks to have gone to Vietnam but we suspect this is not a cause and effect but the result of other ambitions.
Figure 5 shows the top six importing nations through Q4 2016.
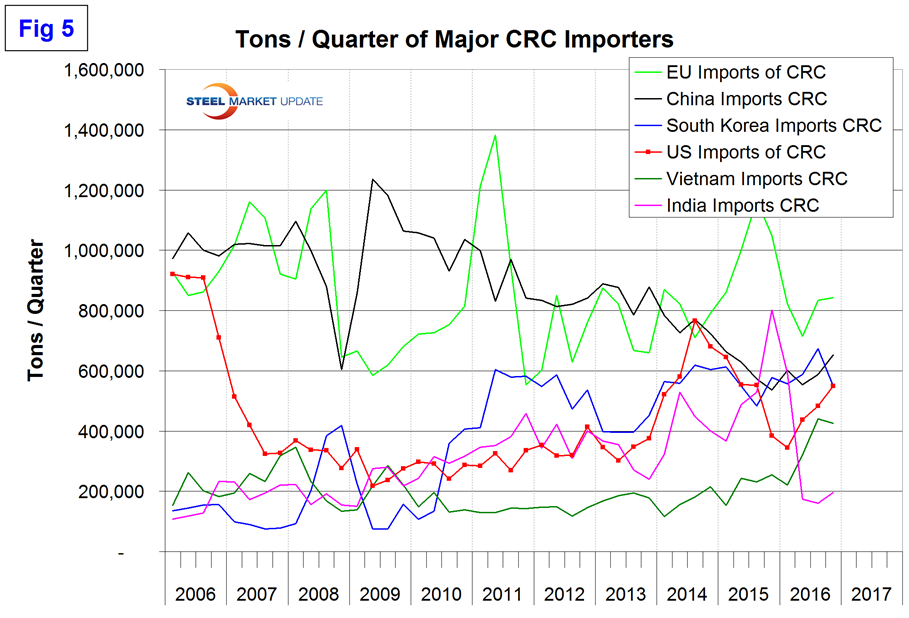
In the fourth quarter the US was in third place just 1,000 tons ahead of South Korea. The EU had a much higher import volume than China who was in 2nd place. The Chinese imports are almost all alloy steel. Figure 6 shows the import share of the top six players.
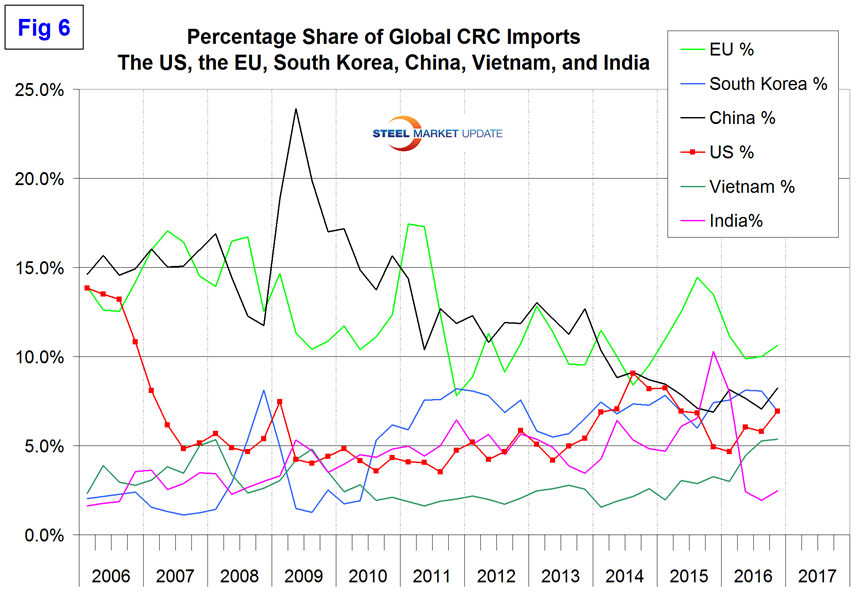
The reason for including both tonnage and share charts is that if the base is broadened the share of individual nations drops at the same time as their tonnage could increase.
The United States imported 6.9 percent of total global CRC trade in Q4 which was the highest share since Q1 2015. As China was taken out of the equation they were replaced by other suppliers.
As readers can imagine there is a huge amount of date behind this analysis covering most (probably 99 percent) of the tonnage by source and the same by destination. This is a work in progress as we experiment with the best way to distill the data into the most revealing summary. We plan to repeat this exercise quarterly for HRC, CRC and global scrap trade for our premium subscribers.


