Market Data

February 20, 2017
Shipments and Supply of Sheet Products through December 2016
Written by Peter Wright
This report summarizes total steel supply from 2003 through December 2016 and year on year changes. It then compares domestic mill shipments and total supply to the market. It quantifies market direction by product and enables a side by side comparison of the degree to which imports have absorbed demand. Sources are the American Iron and Steel Institute and the Department of Commerce with analysis by SMU.
Table 1 shows the final annual tonnages for 2016 and describes total supply, domestic mill shipments, imports and import share.
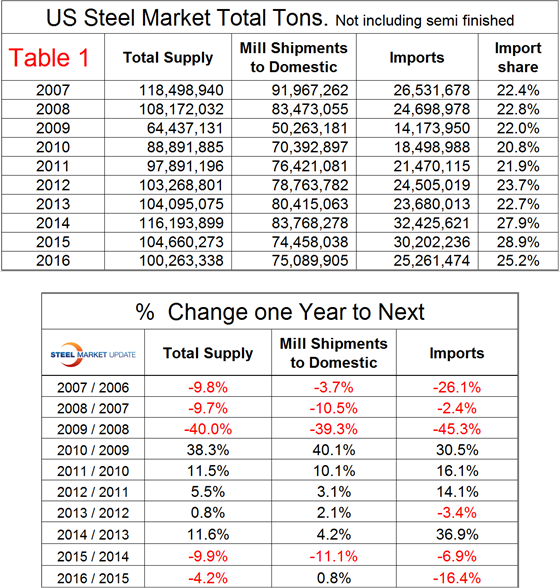
Total supply in 2016 was 100.263 million tons down from 104.660 million tons in 2015. Domestic mill shipments were up from 74.458 million tons to 75.090 million tons and imports were down from 30.202 million tons to 25.262 million tons. Table 1 also shows the percent changes year/year for 2016 compared to 2015. These numbers do not include semi-finished. Total supply grew for five successive years from 2010 through 2014 as the recovery from the recession progressed. Supply contracted in both 2015 and 2016.
Table 2 describes both apparent supply and mill shipments of sheet products (shipments includes exports) side by side as a three month average through December, for both 2015 and 2016.
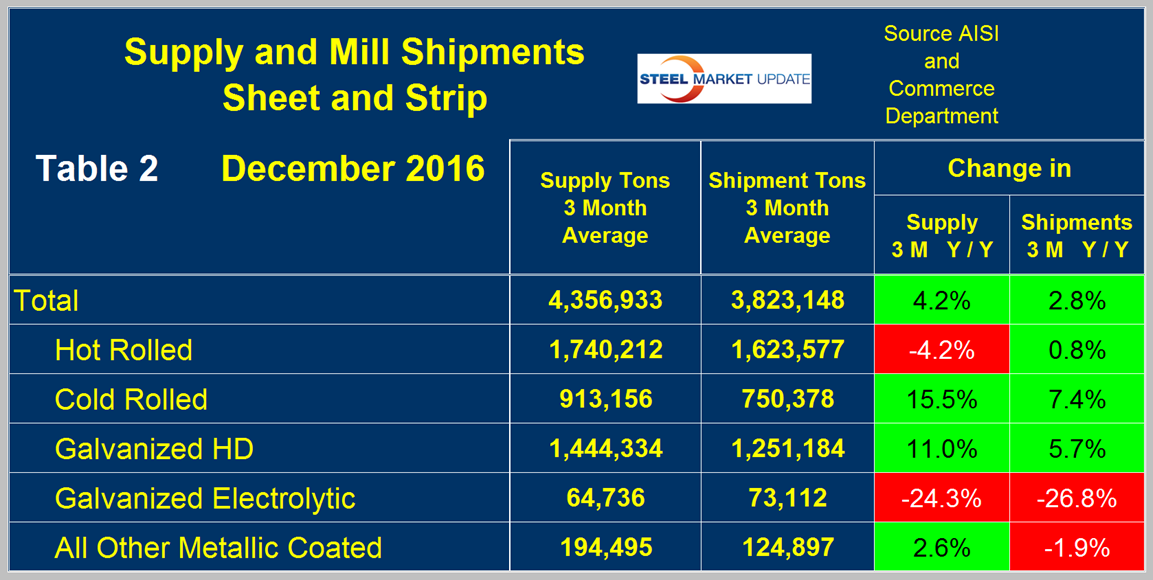
Apparent supply is a proxy for market demand. Comparing these two time periods total supply to the market was up by 4.2 percent and shipments were up by 2.8 percent. The fact that supply was up by more than shipments means that over a three month time period imports took market share compared to the same three months last year. Table 2 breaks down the total into product detail and it can be seen that shipments did better than supply for HRC but worse for CRC, HDG and other metallic coated which is mainly Galvalume. Electro-galvanized is an odd ball because it has net exports.
A review of supply and shipments separately for individual sheet products is given below.
Apparent Supply
Apparent Supply is defined as domestic mill shipments to domestic locations plus imports. In the 12 months of 2016 the supply of sheet and strip was 54.8 million tons, up from 54.1 million tons in 2015 or 1.3 percent. In the three months through December 2016 the average monthly supply of sheet and strip was 4.357 million tons, up by 4.2 percent year over year compared to the same period in 2015. (We had to make a double take on this ourselves because at first glance a reader might think that the YTD figure through December should be the same as the 12 months change. It isn’t because one compares 12 months Y/Y and the other 3 months Y/Y.) In the three months through December compared to the 3 months through September, supply was down by 7.1 percent. The short term decline (3 months) compared to the long term decline (12 months) means that through December momentum was negative. This was probably a seasonal effect as there is no adjustment in any of these numbers and we know that buyers play the year end inventory game. Table 3 shows the change in supply by product on this basis through December. Momentum was negative for all products except electro-galvanized.
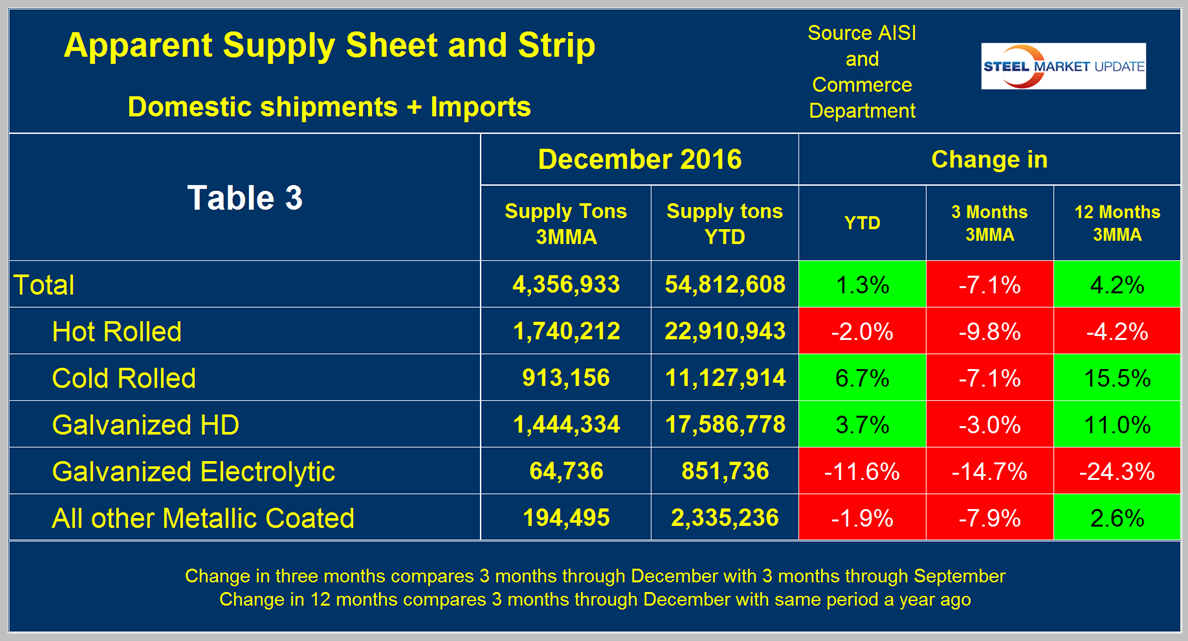
Figure 1 shows the long term supply picture for the three major sheet and strip products, HR, CR and HDG since January 2003 as three month moving averages. HRC has experienced a major seasonal decline but not so much for CRC and HDG.
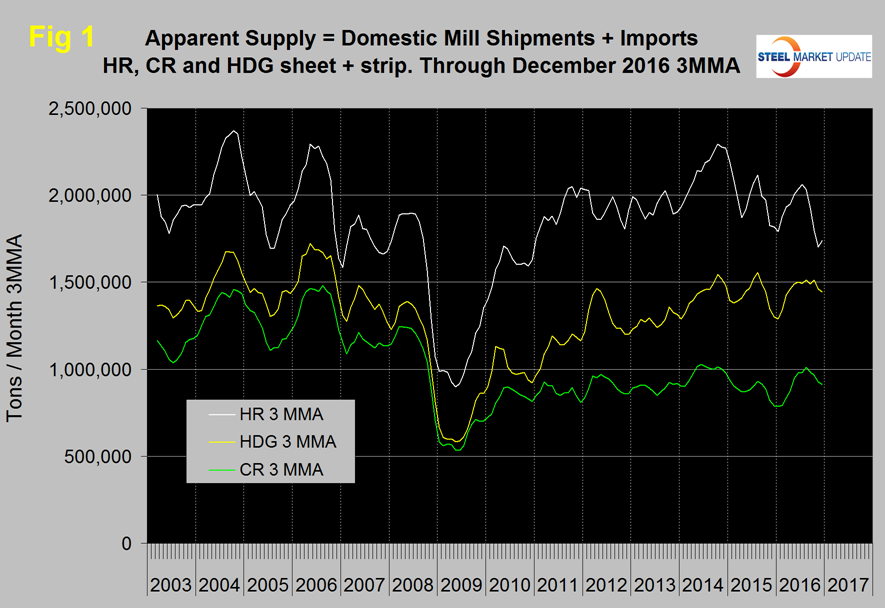
Figure 2 shows import market share of sheet products and includes long products for comparison.
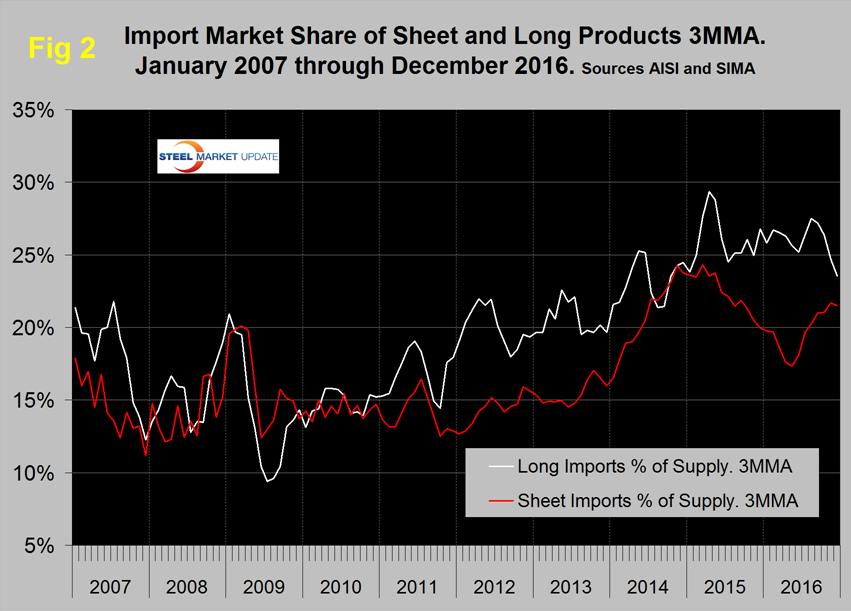
Based on a 3MMA the import market share of sheet products declined from 24.3 percent in March 2015 to 17.4 percent in May 2016 and has increased to 21.5 percent in three months through December 2016. Long product import market share is now below its trend since 2010 and in 3 months through December was 23.5 percent.
Mill Shipments
Table 4 shows that total shipments of sheet and strip products including hot rolled, cold rolled and all coated products were up by 2.8 percent in 3 months through December year over year and down by 7.1 percent comparing three months through December with three months through September.
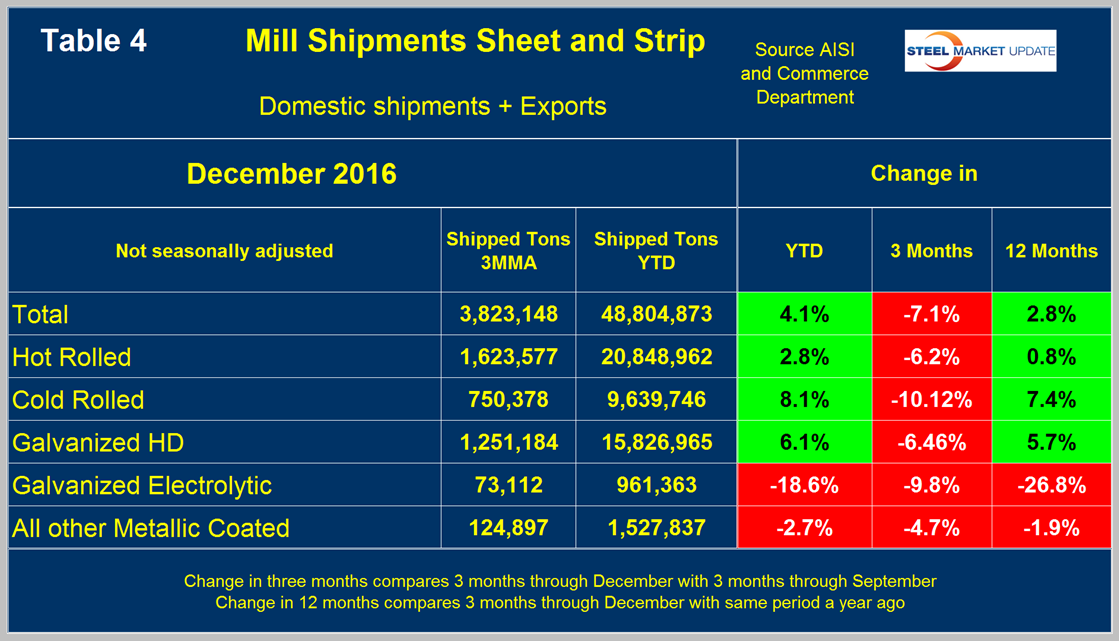
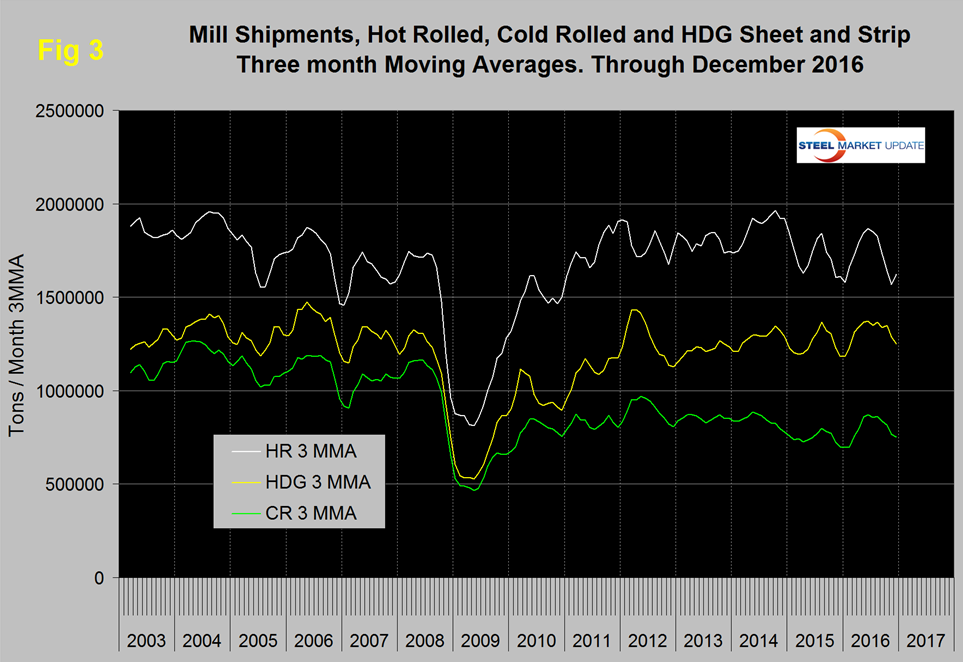
Momentum for the total shipments of sheet and strip products was negative because the 3 month growth (-7.1 percent) was less than the 12 month result (+ 2.8 percent). However there is no seasonality in the 12 month figure and there is in the 3 month comparison so that is probably most of the explanation. All sheet products except EG exhibited that pattern but as we mentioned above, EG is an oddball. Figure 3 puts the shipment results for the three main products into the long term context since January 2003. This figure looks a lot like the supply data shown in Figure 2 with a severe decline in HRC in the last few months.
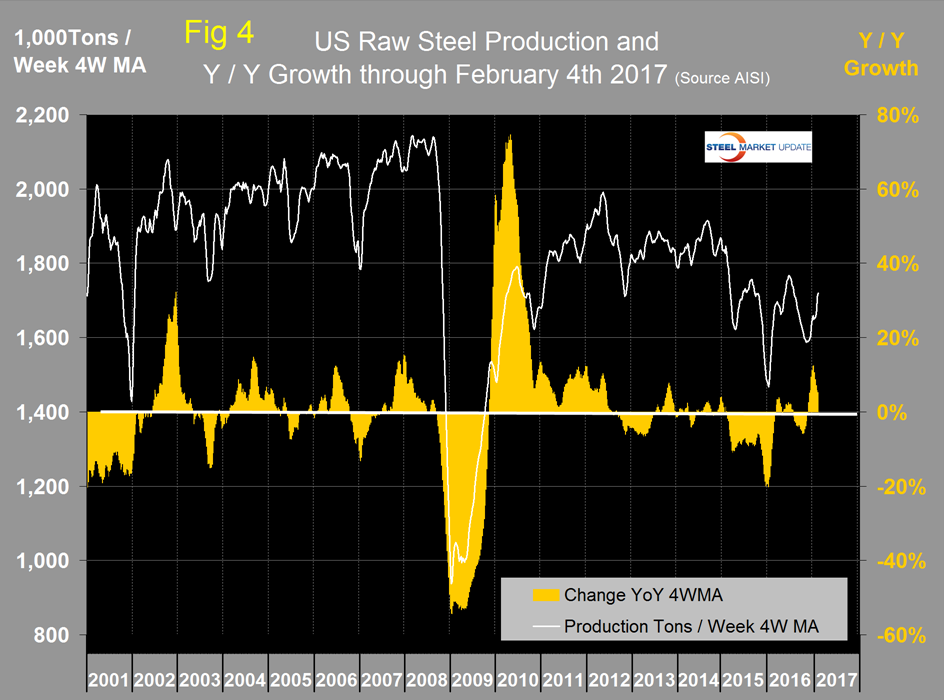
SMU Comment: The numbers in this report illustrate why it’s necessary to look at different time periods to try to understand the whole picture. We could draw different conclusions based on whether we look at year over year changes or three month over three months changes. Both are necessary to understand what is going on and the difference between the two normally indicates direction. However when the year end market inventory corrections are considered the 3M/3M data doesn’t have much validity. Another problem with this data is that it’s now mid-February and the latest data we have for shipments and supply is for December and a lot has happened since then to the positive. The AISI puts out weekly data for crude steel production the latest for which was w/e February 4th. This provides the most current data for steel mill activity. Figure 4 shows the y/y change in weekly crude output on a four week moving average basis. Growth became positive in w/e March 5th and in the next 19 weeks there was only one week with negative Y/Y growth. Growth became negative again in w/e July 23rd and stayed negative until November 12th with an increasingly improving trend from October 8th through November 12th. Since then growth has been positive y/y for 12 straight weeks.