Prices

February 12, 2017
Global Trade in HRC and CRC through Q3 2016
Written by Peter Wright
We believe that to understand the forces acting on the US steel import market it is necessary to examine global trade flows. We present here episode one of our investigation into the global trade of hot rolled coil and cold rolled coil and the US’s position in the big picture. The source of this data is the Iron and Steel Statistics Bureau in the UK. Data is collected from exporters and from importers. Since there are very many fewer exporting nations than importers and since the exporters generally have more advanced reporting systems (unless they lie!) we have only analyzed export based data then reversed it to get the import flow. Data is reported about 10 weeks after a quarter closes. Rather a long delay but it takes time for the ISSB to receive all the data as nations have different reporting speeds. Even with that delay we believe the data is valuable in providing an overall direction and volume of trade flows.
There is a huge inter country flow within the EU which we think is of little relevance to our investigation therefore we have excluded this volume from our analysis. As in most of our reports, what we are after is changes in direction and we will attempt to identify such in these reports. Episode two will be a detailed drill down into where the exports of the major players are headed and where the imports of the major destinations are coming from. We will then report on this data quarterly for our premium members with a focus on changes that are occurring that will put more or less pressure on the US market. From a buyers point of view this will point to more or less opportunity.
Hot Rolled Coil
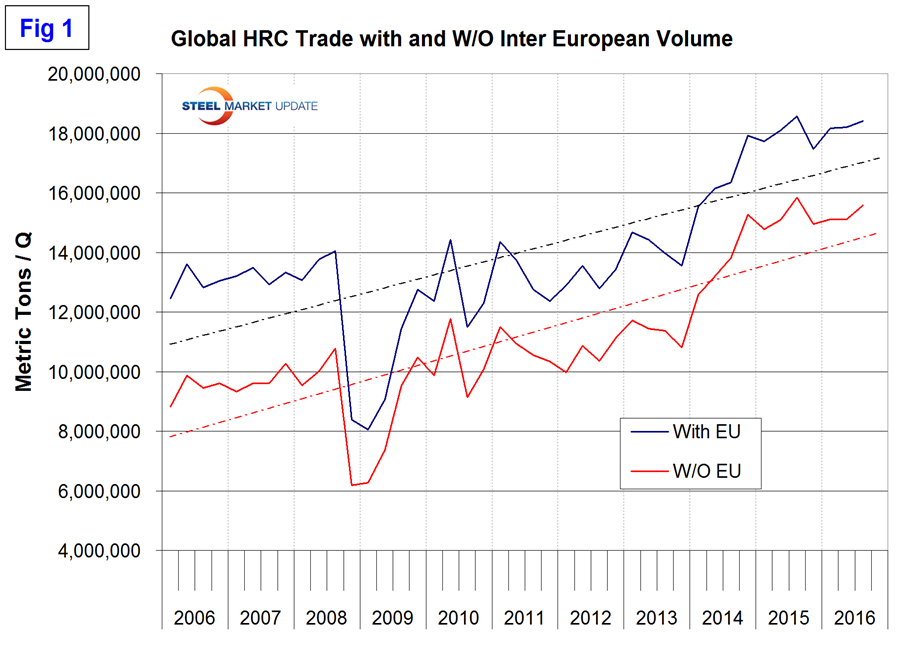
Figure 1 shows quarterly global trade as both the total and with the exclusion of inter EU volume.
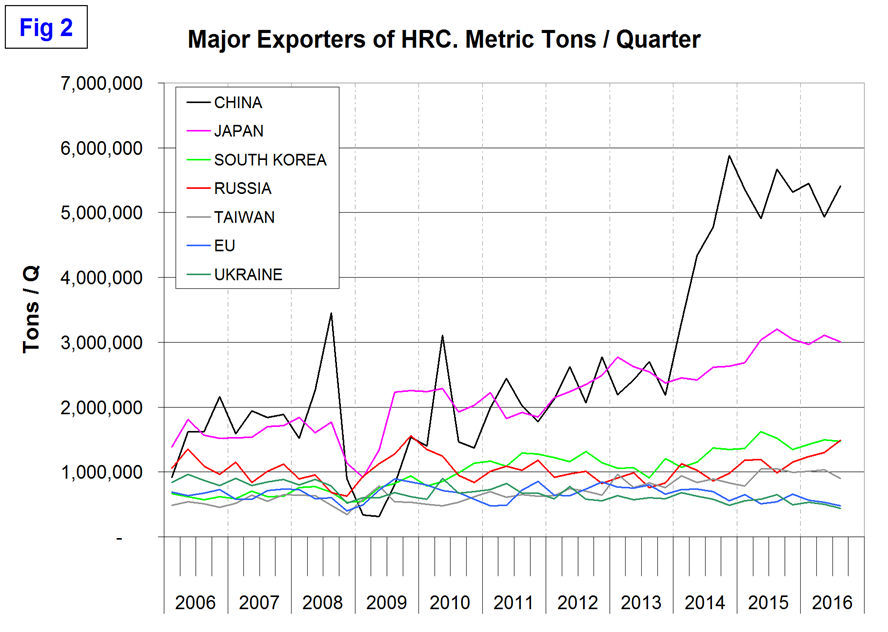
In the first three quarters of 2016 the global total volume was 54.8 million tons and excluding the inter EU volume was 45.8 million tons. Both tonnages have been trending up since Q1 2016. Figure 2 shows the relative size of China in particular but also that Japan is exporting over half as much as China. These are the top seven nations in 2016 tonnage through Q3.
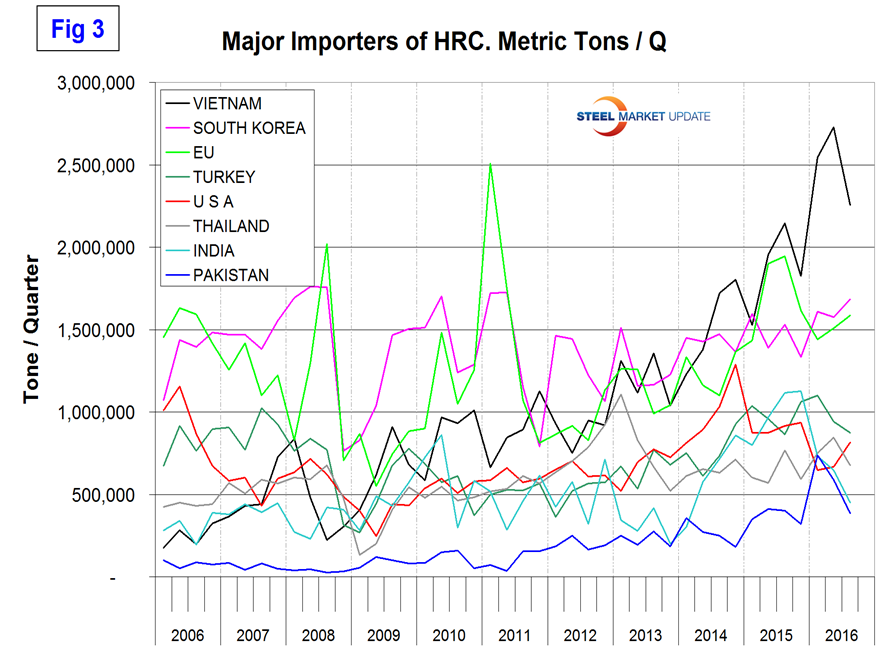
In the last two years Russia has increased its exports by 50 percent. Figure 3 shows the top eight importing nations based on the total for 2016 through Q3.
Big surprise we think is that Vietnam has the highest volume and we wonder to what extent this is related to the further processing of Chinese coil. The US was in 5th place on this basis and in our future analyses we will look at changes in the US percent share of the global total.
Cold Rolled Coil
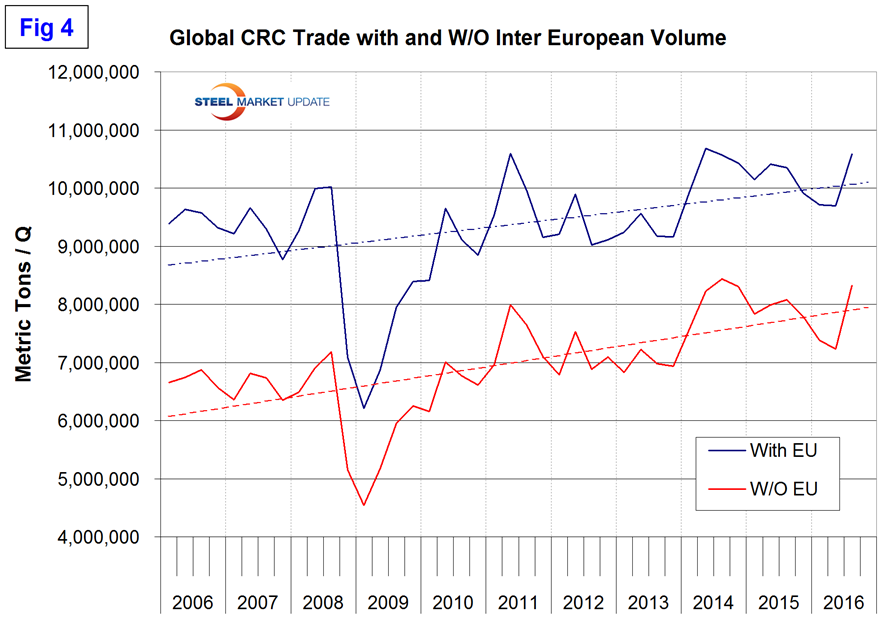
Figure 4 shows the global total with and without the inter EU trade.
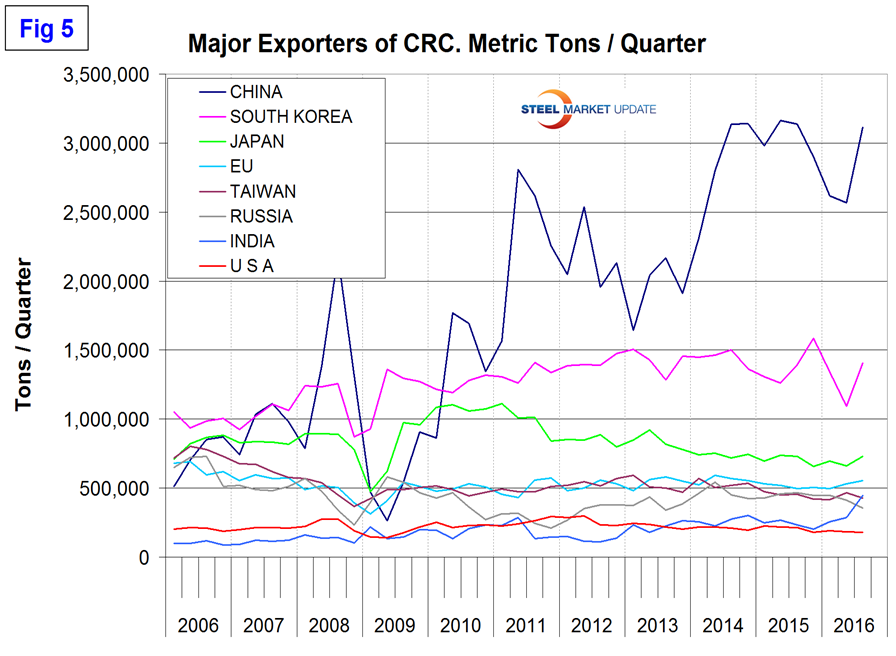
In the first three quarters of 2016 the global total volume was 30.0 million tons and excluding the inter EU volume was 22.9 million tons. As with HRC both tonnages have been trending up since Q1 2006 but CRC is trending up slower. Figure 5 shows the top eight exports and in this case the US makes the list in 8th place. Korea is in 2nd place to China with almost half the volume. Exports from Japan have been declining for almost five years. Exports from India have been increasing for over four years.
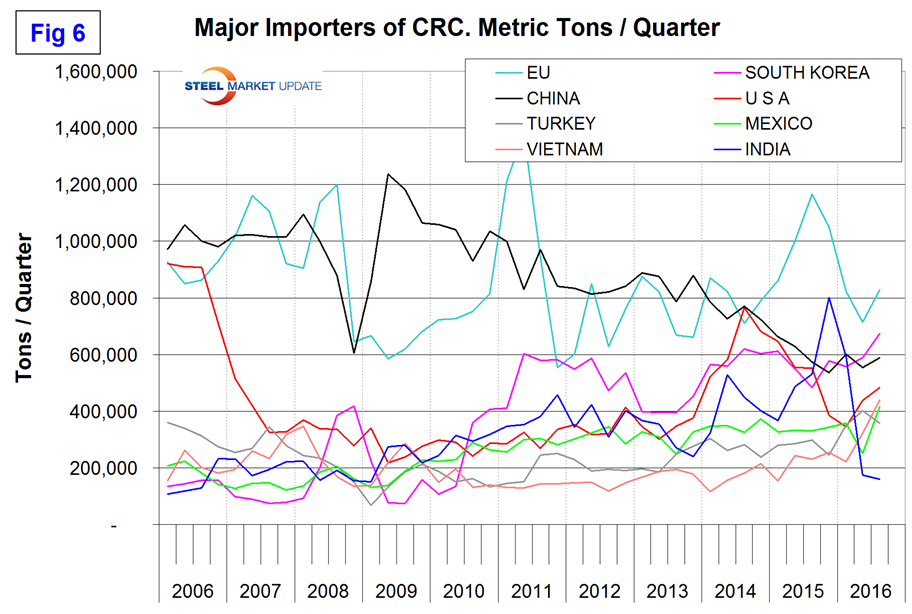
Figure 6 shows the top eight importing nations with the US as # 4. The EU has the highest volume of imports and between Q4 2015 and Q3 2016, India fell from 2nd to 8th place.
We think that global trade is like an under-inflated balloon. Squeeze it in one place and it pops out in another. In our second episode we will examine in more detail where trade is going from – to and how that is changing.


