

Market Data

January 30, 2017
US Gross Domestic Product for Q4 2016 - First Estimate
Written by Peter Wright
The headline report of GDP growth in Q4 came in at 1.88 percent a decline from 3.53 percent in the third quarter. GDP is measured and reported in chained 2009 dollars and in the first estimate of Q4 was $16.805 trillion. The growth calculation is misleading because it takes the quarter over quarter change and multiplies by 4 to get an annualized rate. This makes the high quarters higher and the low quarters lower. Figure 1 clearly shows this effect.
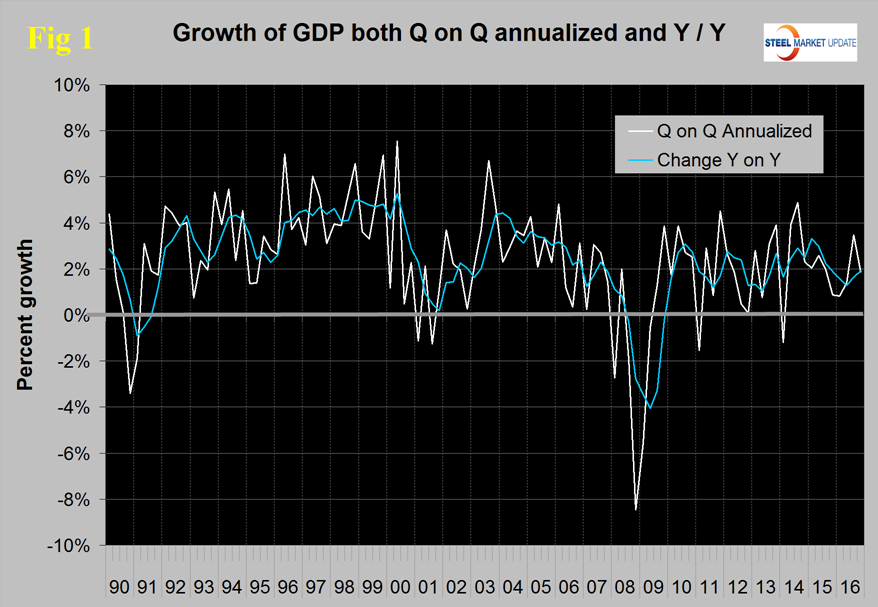
The blue line is the trailing 12 months growth and the white line is the headline quarterly result. On a y/y basis GDP was up by 1.90 percent an improvement from 1.65 percent in the third quarter and from 1.28 percent in the second quarter. So is the growth of GDP improving or deteriorating? We at SMU believe it is improving and that the trailing 12 month figure is a truer reflection of the actual performance of the economy. On that basis GDP growth slowed for five straight quarters through Q2 2016 and has improved for the last two quarters. The long term average since Q1 2000 has been 2.09 percent. The average of the last eight quarters has been 2.10 percent therefore we conclude that in recent quarters the growth of US GDP is exactly in line with its average for the last sixteen years.
We include what Economy.com had to say about the latest result even though their point of view is different from ours, “The U.S. economy posted disappointing growth to end 2016. However, while growth did not match the rapid third quarter pace, it did comfortably exceed its pace in the first half of the year. Growth was led by consumer spending and investment spending, although the latter was led by inventory investment, which is a concern for the outlook. Trade was a major drag on growth as exports fell and imports rose rapidly. The rising dollar is reducing U.S. competitiveness, although some of the weakness was caused by an unsustainable surge in soybean exports in the third quarter. The outlook for 2017 is solid. It will mark the eighth year of the economic expansion, making it the second longest in the nation’s history. Only the 10-year internet-fueled 1990s’ expansion was longer. It will also be the year the economy returns to full employment—everyone who wants work will have it—about a decade since the last time it enjoyed that distinction.”
Figure 2 shows the headline quarterly results since 1990 and the October IMF forecast through 2021.
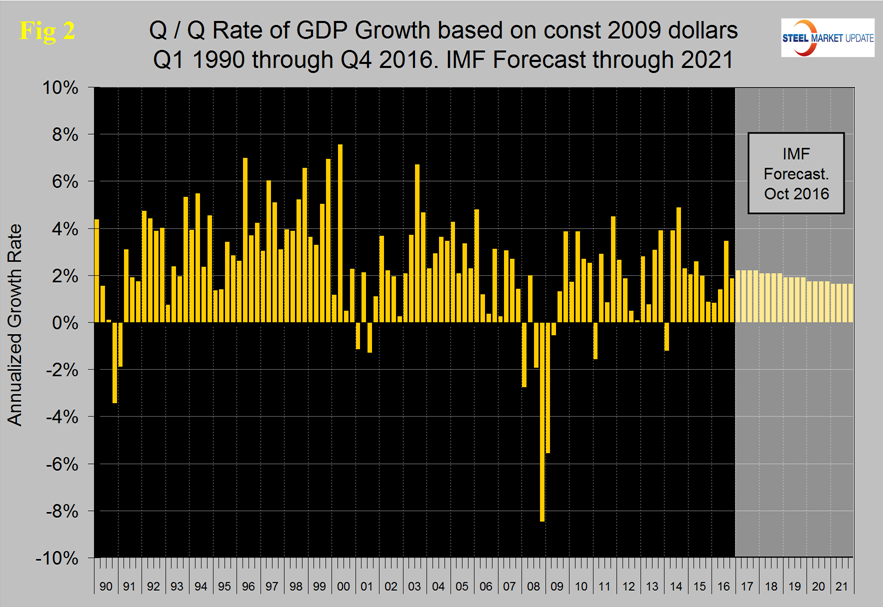
In their October revision, the IMF downgraded their forecast of US growth in 2016 from their April 2016 estimate of 2.4 percent to 1.58 percent and downgraded 2017 from 2.50 percent to 2.20 percent. We expect the IMF to raise their 2017 forecast in their next update which will be released in April.
Figure 3 shows the change in the six major subcomponents of GDP in Q4 2016 and the dominance of personal consumption as a growth driver.
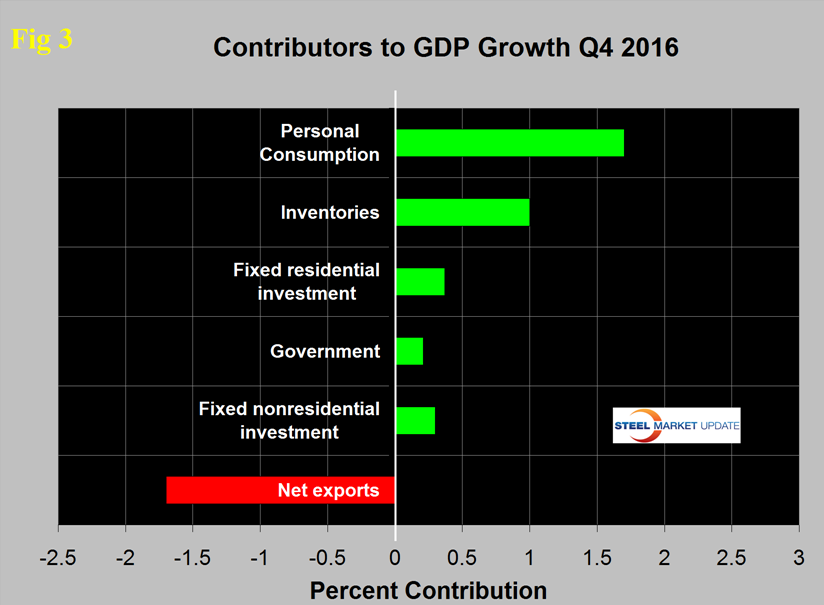
Exports were a major drag on growth in the fourth quarter and deducted 1.7 percent. This was the biggest difference between Q3 and Q4. Other changes were that the contribution of inventories increased from 0.5 to 1.0 percent, both residential and non-residential construction improved, the contribution of personal consumption deteriorated from 2.03 percent to 1.70 percent. Personal consumption includes goods and services, the goods portion of which includes both durable and non-durables. Rising inventories have a positive effect on the overall GDP calculation and this was the case for the last two quarters following five straight quarters when inventories contracted. Over the long run inventory changes are a wash and simply move growth from one period to another. When a decline in one period is subtracted from growth, it can often be a healthy indicator for future periods. Such a decline suggests that there are lower levels of overall inventories which will set the stage for inventory increases – which will then add to GDP growth in the future. This seems to be what happened in the third and fourth quarters.
Figure 4 shows the contributors to GDP extended back through Q1 2007 and describes the quarterly change in the six major subcomponents.
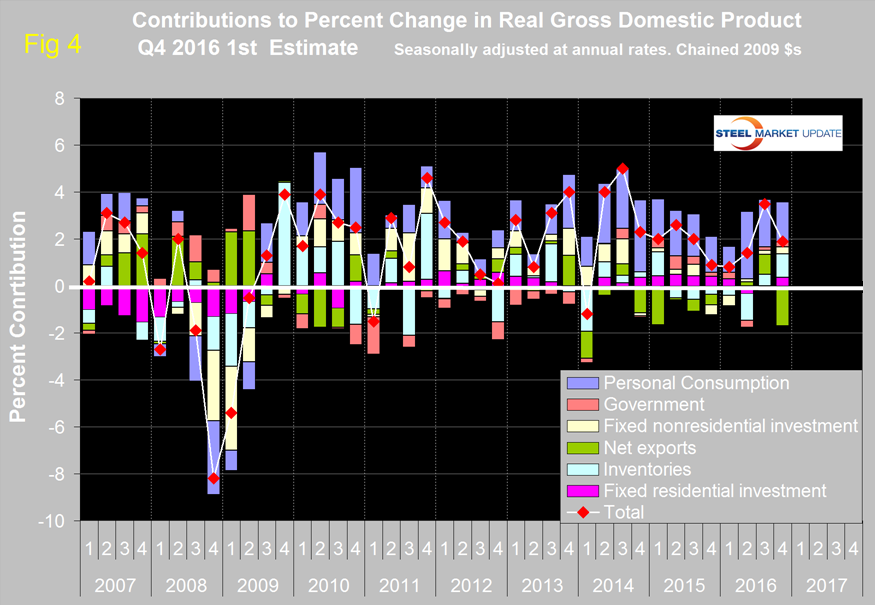
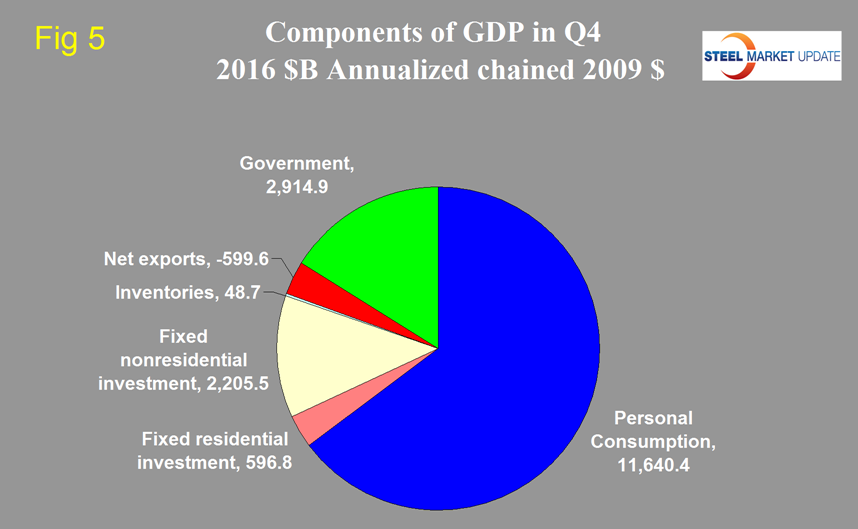
In the second quarter the negative contribution of inventories was the greatest since Q1 2014 and in the fourth quarter the positive contribution was the greatest since Q1 2015. Government expenditures made a small positive contribution in the last two quarters. Figure 5 shows the breakdown of the $16.8 trillion economy.
SMU Comment: It is disturbing that the contribution of personal consumption was down in Q3 and down again in Q4. The strong dollar resulted in a disappointing contribution of net exports and that won’t change for the better anytime soon. The growth of inventories made a huge contribution to Q4 but as we reported above this is simply moving growth from one time period to another. Historically it has been necessary to have about a 2.5 percent growth in GDP to get any growth in steel demand so this latest estimate of GDP suggest that at least steel demand won’t contract in the immediate future. This relationship is a long term average and in reality steel is much more volatile than GDP. If GDP takes a dive then steel demand craters and if GDP takes a sudden upturn steel soars. Neither of these extremes is evident at present.


