

Market Data

October 11, 2016
Shipments and Supply of Sheet Products through August 2016
Written by Peter Wright
This report summarizes total steel supply from 2003 through August 2016 and year on year changes. It then compares domestic mill shipments and total supply to the market. It quantifies market direction by product and enables a side by side comparison of the degree to which imports have absorbed demand. Sources are the American Iron and Steel Institute and the Department of Commerce with analysis by SMU.
Table 1 shows both apparent supply and mill shipments of sheet products (shipments includes exports) side by side as a three month average through August, for both 2015 and 2016.
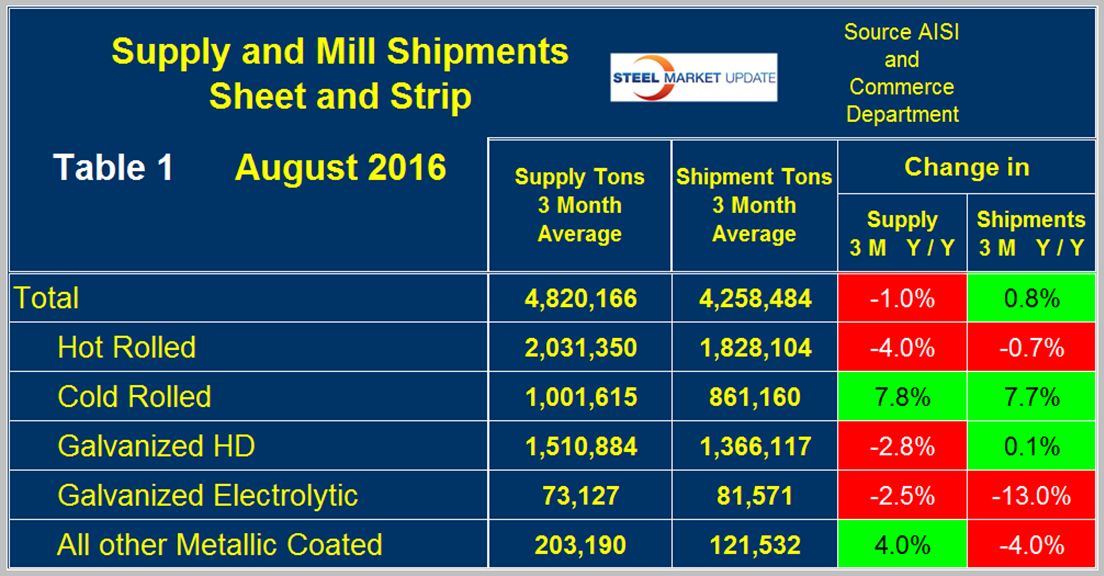
Apparent supply is a proxy for market demand. Comparing these two time periods, total supply to the market was down by 1.0 percent but shipments were up by 0.8 percent. The fact that shipments were up slightly and supply was down slightly means that over a three month time period imports put less pressure on the market than they did this time last year, however, it looks as though that is changing as import market share in June, July and August increased. Table 1 breaks down the total into product detail and it can be seen that shipments did better than supply for HRC and HDG but not so for EG and OMC as CRC was break even.
A review of supply and shipments separately for individual sheet products is given below.
Apparent Supply
Apparent Supply is defined as domestic mill shipments to domestic locations plus imports. In three months through August 2016 the average monthly supply of sheet and strip was 4.820 million tons, down by 1.0 percent year over year as mentioned above but up by 2.5 percent comparing June through August with the previous three months. The short term improvement (3 months) compared to the long term improvement (12 months) means that momentum continues to be positive. Table 2 shows the change in supply by product on this basis through August. Momentum was positive for all products except cold rolled.
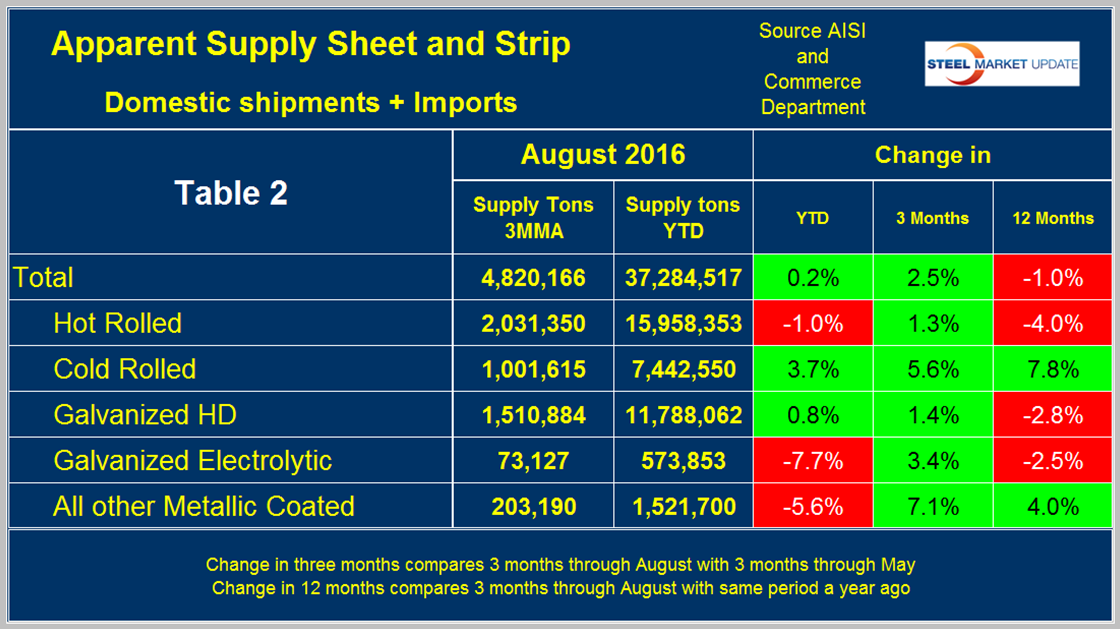
Figure 1 shows the long term supply picture for the three major sheet and strip products, HR, CR and HDG since January 2003 as three month moving averages and the improvement that has occurred this year.
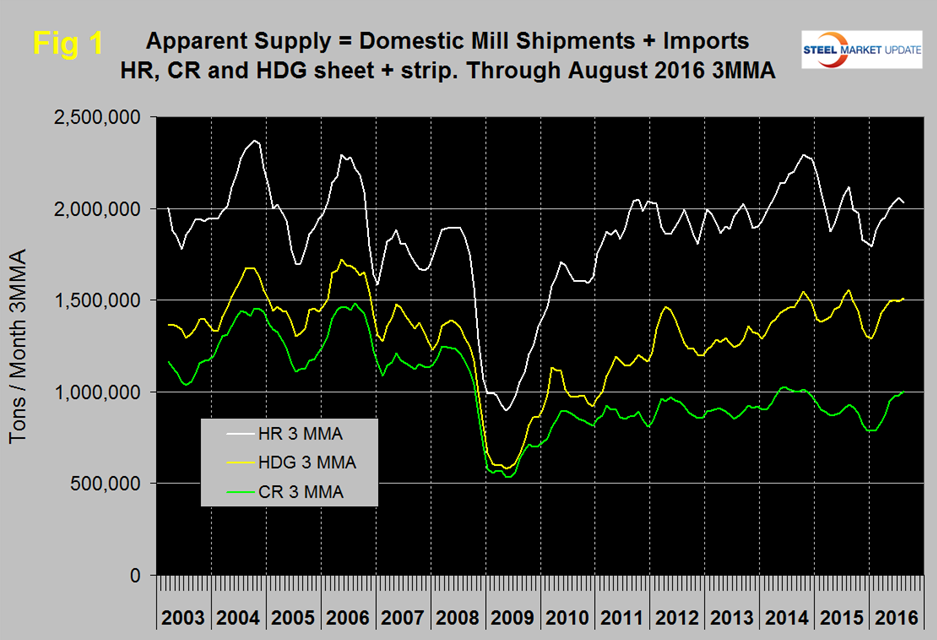
Figure 2 shows import market share of sheet products and includes long products for comparison.
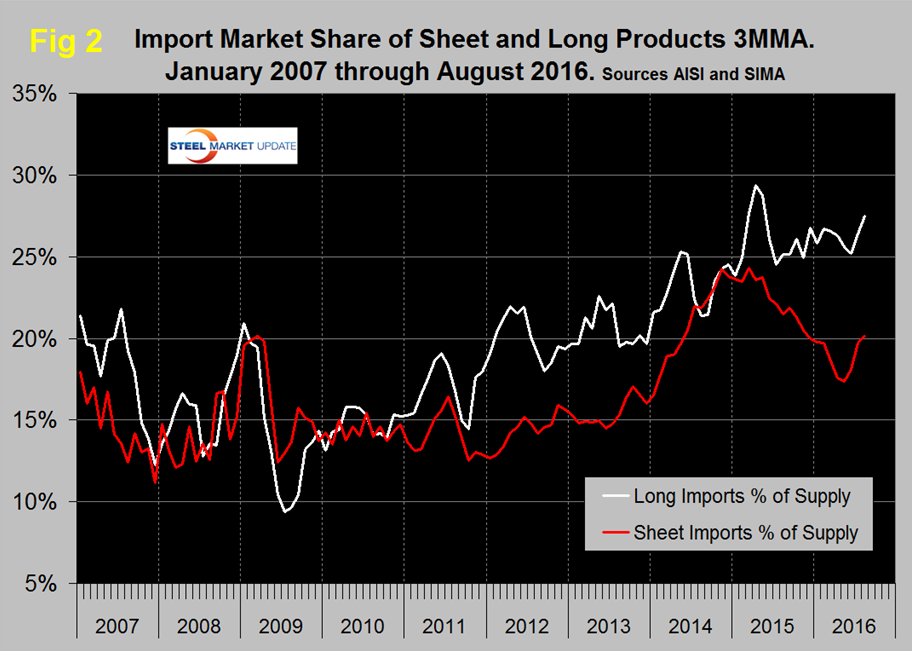
Based on a 3MMA the import market share of sheet products declined from 24.3 percent in March last year to 17.4 percent in May this year and has increased to 20.1 percent in August. Long product import market share peaked at 29.4 in August last year, declined abruptly to 24.5 percent in August 2015 and now stands at 27.5 percent in this latest data.
Mill Shipments
Table 3 shows that total shipments of sheet and strip products including hot rolled, cold rolled and all coated products were up by 0.8 percent in 3 months through August year over year and down by 0.6 percent comparing three months through August with three months through May.
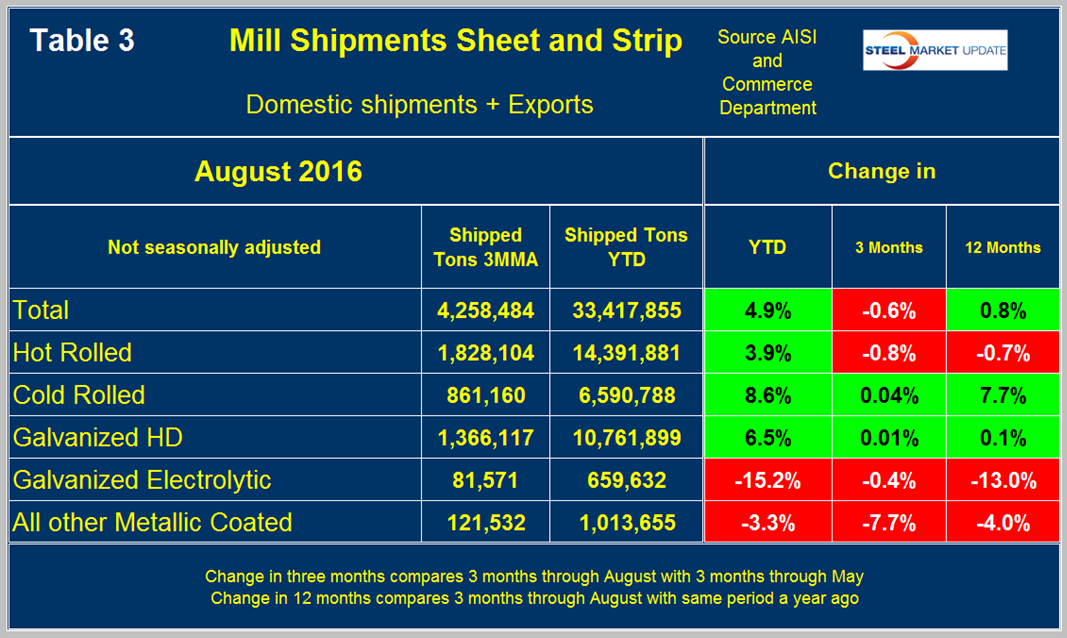
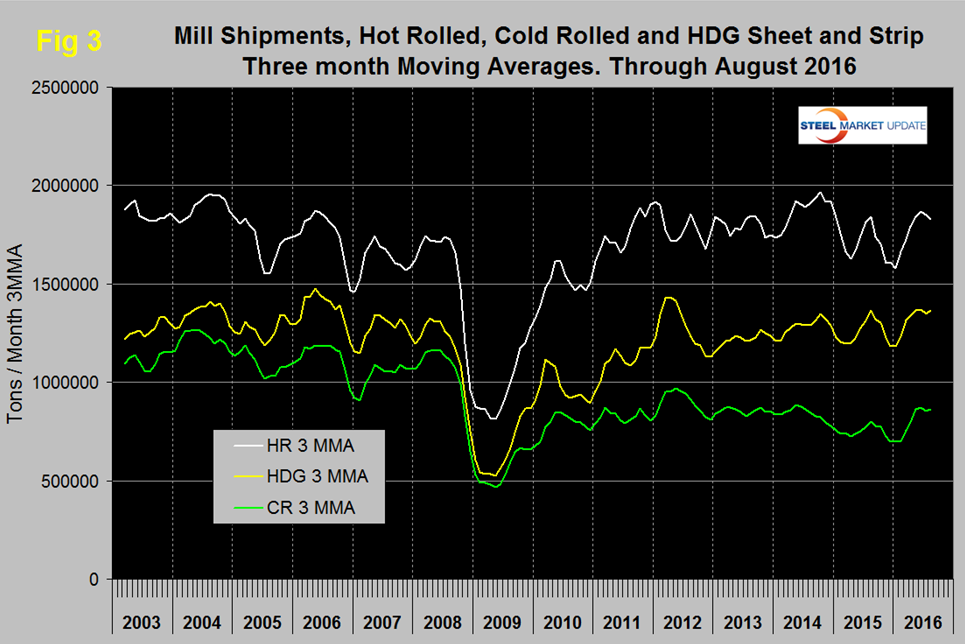
Momentum for the total shipments of sheet and strip products was negative because the 3 month growth (-0.6 percent) was less than the 12 month result (+ 0.8 percent). This was not true of all the individual products. HRC had no momentum in either direction and EG had positive momentum but CRC, HDG and other metallic coated had negative momentum. Figure 3 puts the shipment results for the three main products into the long term context since January 2003. All three have had positive growth this year but direction has been lost in July and August.
SMU Comment: The numbers in this report illustrate why it’s necessary to look at different time periods to try to understand the whole picture. We could draw different conclusions based on whether we look at year over year changes or three month over three months changes. Both are necessary to understand what is going on and the difference between the two indicates direction. A problem with this data is that it’s now approaching mid-October and the latest data we have for shipments and supply is for August. The AISI puts out weekly data for crude steel production the latest for which was the week ending October 1st. This provides the most current data for steel mill activity. Figure 4 shows the Y/Y change in weekly crude output on a four week moving average basis.
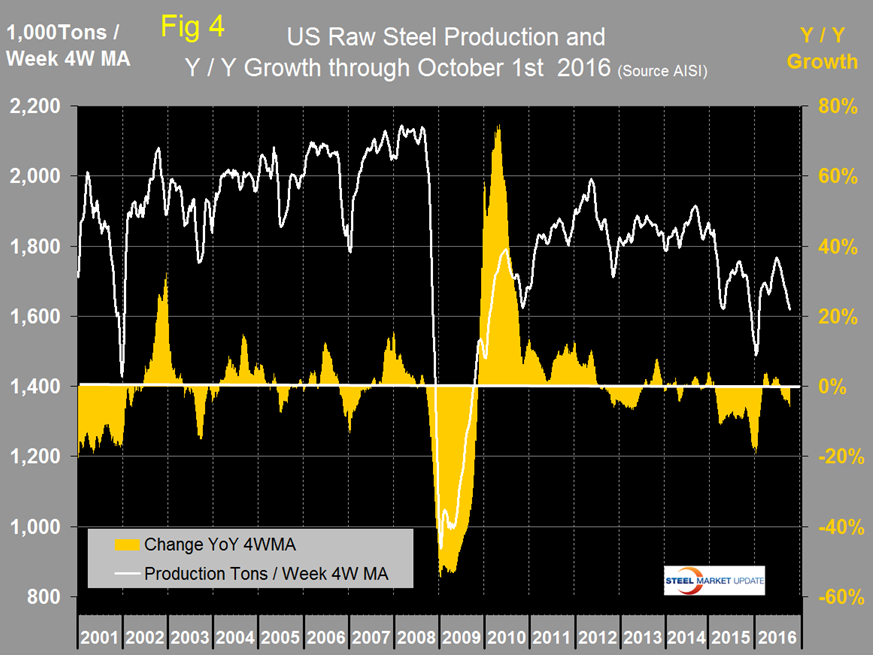
Growth became positive in the week ending March 5th and in the next 19 weeks there was only one week with negative Y/Y growth. Growth became negative again in w/e July 23rd and has been increasingly negative ever since. Note, this is not a summer slowdown as we are considering Y/Y data. This deterioration in weekly crude steel production may be a harbinger of further declines in shipments of sheet products which as shown in Figure 3 above began to roll over in July. Import market share is up and in 3 months through August total supply of sheet products was up compared to 3 months through May. Our key market indicators data is mostly still trending positive but our SMU buyer’s sentiment index is has weakened in the last month.


