Market Data

September 15, 2016
Industrial Production and Manufacturing Capacity Utilization in August 2016
Written by Peter Wright
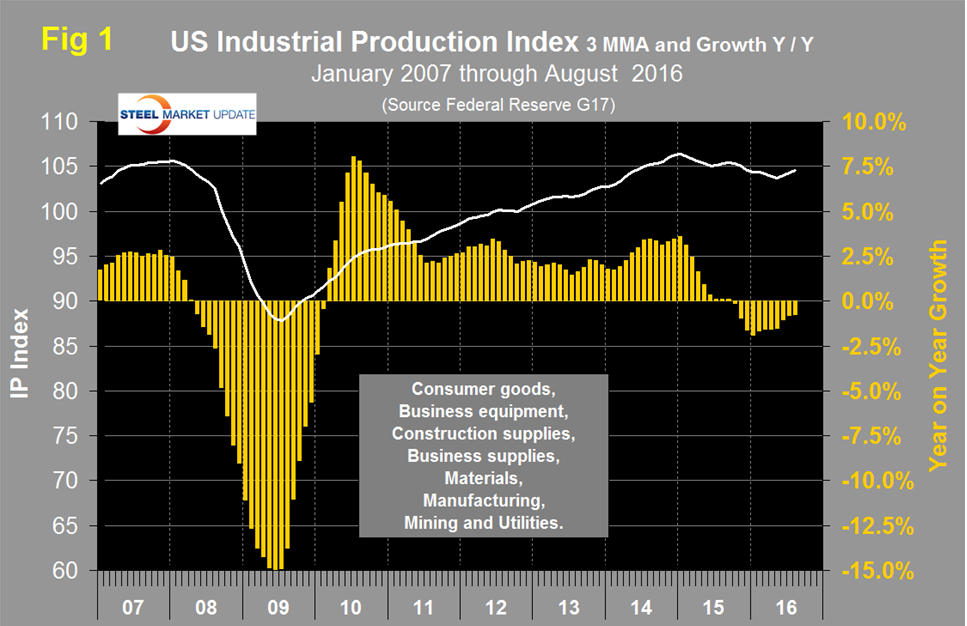
Both these data points are reported in the Federal Reserve G17 data base. The index had an all-time high of 106.70 in November 2014 and trended down until June this year when it experienced a two month turnaround followed by a slight decline in August to 104.402. The three month moving average (3MMA) had positive month over month growth in June, July and August for the first time since September last year. Figure 1 shows the 3MMA of the index and the year over year (Y/Y) growth.
On this Y/Y basis the negativity is decreasing. Data is seasonally adjusted and the index is based on the May 2012 level being defined as 100. In August the M/M growth on a three month moving average basis, was positive 0.2 percent but the 3MMA growth on a Y/Y basis was negative 0.76 percent. This means that momentum is positive since there was a short term (3 months) improvement compared to the longer term (12 months) decline. We place less emphasis on the actual numbers than we do direction and we conclude that the August data suggests an improvement in industrial production. Momentum has been positive for 13 straight months.
The September update of the Federal Reserve Beige Book was released on the 7th and had this to say: Activity in the manufacturing sector was flat to slightly up in general, with Chicago in particular reporting a moderate pace of growth. Activity in technology manufacturing was up modestly in Dallas, but contacts in San Francisco noted that production of semiconductors was flat and that capacity remained somewhat underutilized. Several transportation equipment and industrial machinery manufacturers reported plans to expand facilities in the St. Louis District. Pharmaceutical manufacturers in the San Francisco District reported that sales continued at a strong pace despite increased regulatory burdens and negative media coverage around industry pricing decisions. Weakness in the oil and gas extraction sector combined with competitive foreign supply to depress demand and production of steel products in several Districts. In contrast, contacts in the Chicago District noted that demand for steel was steady and declining imports have helped domestic producers gain market share. Manufacturers in Richmond are optimistic about growth prospects, and contacts in Philadelphia expect growth to pick up over the next six months.
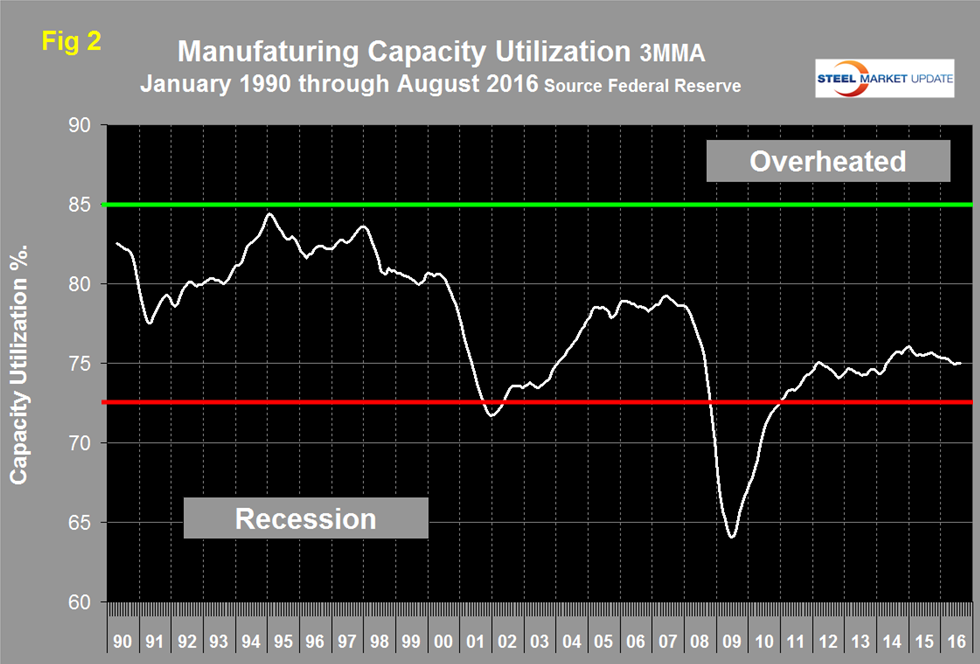
Manufacturing capacity utilization was 74.82 percent in August with a 3MMA of 74.99 percent (Figure 2).
In January last year, utilization exceeded 76 percent for the first time since the recession and has been slowly declining ever since. Regarding the August result the Fed had this to say: “Capacity utilization for manufacturing decreased 0.4 percentage point in August to 74.8 percent, a rate that is 3.7 percentage points below its long-run average. The operating rate for non-durables moved down 0.2 percentage point: the rates for durables and for other manufacturing (publishing and logging) each declined 0.5 percentage point. The operating rate for mining moved up 1.0 percentage point to 76.2 percent, while the rate for utilities decreased 1.3 percentage points to 80.4 percent.”
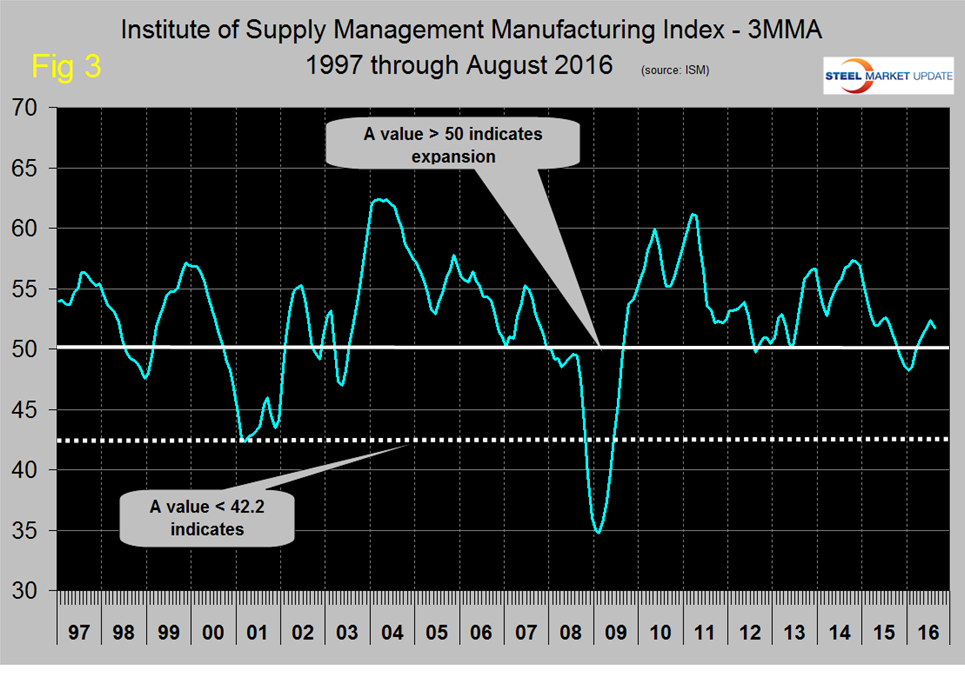
SMU Comment: In March this year the ISM manufacturing index signaled positive growth by exceeding 50 for the first time since August last year and had five positive months through July. August sank below 50 to 49.4 which signals contraction, however the 3MMA,which we prefer to dwell on, has had five consecutive months of positive growth through August (Figure 3).
We regard the ISM index as “leading,” therefore, combined with positive momentum in the IP index our expectations for manufacturing in the short term are positive. At SMU we try to examine two or three measures of the same activity as a reality check and on this basis manufacturing is flashing green.


