

Market Data
September 13, 2016
Oil and Gas Prices and Rotary Rig Counts for August 2016
Written by Peter Wright
The price of oil and natural gas have much to do with sales of oil country tubular goods (OCTG) and related steel products. The energy markets represent a large portion of the hot rolled coil used to make pipe and tube, storage facilities as well as equipment used to drill and pump oil and natural gas.
Figure 1 shows historical oil and gas prices since January 2000. The daily spot price of West Texas Intermediate (WTI) rose through $40 on April 11th and since then has been in the $40s except for one day, August 2nd when it dipped to $39.50 and 3 days, June 7th through the 9th when it broke through the $50 level. On September 6th WTI closed at $44.85 according to the Energy Information Administration (EIA). Brent closed at $46.21 on the same day.
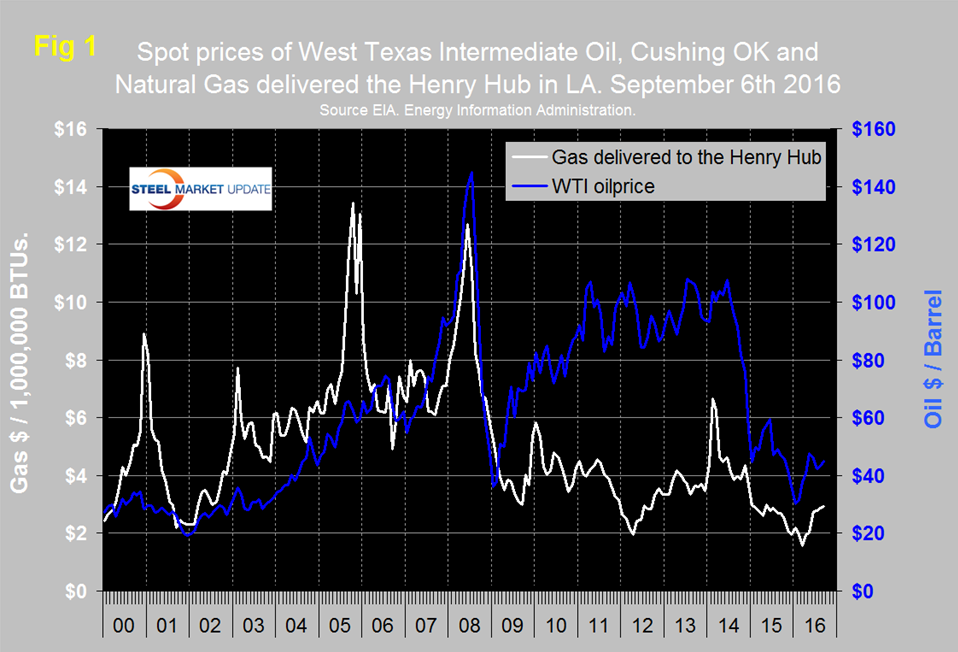
Dean Popplewell wrote on August 11th: The oil cartel, which has been hit hard by low oil prices, has again floated the idea of a freeze in output in order to stabilize oil prices. Venezuela, Ecuador and Kuwait are pushing the idea, but Russia is so far non-committal to implementing a freeze. OPEC members will meet in late September in Algiers. If recent history is any indication, an agreement will be difficult to reach. OPEC members attempted to freeze output earlier in the year, but could not reach an agreement as Iran refused to climb on board. The meeting resulted in significant volatility in oil prices, and if the trend repeats itself in the September summit, we could see some volatility from the Canadian dollar around the time of the OPEC meeting.
Seeking Alpha recently published this piece which we have abbreviated by Michael Filloon: Cost reductions are occurring for all operators in all plays. In areas like the Permian, additional pipelines to move crude and water are important. Less trucking means lower logistical costs. Many pads have implemented systems that use natural gas to run equipment. In Texas plays, many areas already had much of this set up, but not as much in North Dakota. Lower oil prices have motivated operators to get logistics set up before well completion work is begun. North Dakota also has wider differentials, but this is improving. It is hoped that next year, there will be enough pipe in the ground to move all Bakken crude out of the state. This will limit the need for trains to move to the Northeast and supply refiners like PBF Energy. The same goes for railing to the west, where California has begun to stop the movement of crude via train. This could prove instrumental for refiners like Tesoro to begin importing more Brent. The same would be said for refiners in the northeast. Cost decreases have been seen through better oil service contracts, including frac sand and fluids prices. Water costs are down, as water depots are not as busy and most operators have or are putting pipe in the ground. Operators continue to decrease drilling and completion times, while improving production. As efficiencies have improved, so has source rock stimulation. This is how the operator breaks or fracs the rock to release oil and natural gas. By doing this well, it increases production significantly. Operators are focusing on the best geology. Core operations produce more resource per foot. When coupled with better well designs performance increases. These are the reasons unconventional US well economics is improving. We have seen this throughout all plays. There was a time when one-mile laterals in the Bakken were around $10 million, but now most operators are doing it for a little more than half that. This is the North Dakota average. Operators have tried three mile laterals but it is too difficult to control the entire length. On average, an operator does produce more per foot doing a one-mile lateral, but has to bear the cost of drilling twice as many holes. Now a location can be drilled and completed for approximately $6 million.
The price of natural gas, delivered the Henry Hub in Louisiana closed at $2.94 / MM BTU on September 2nd, up from $1.57 on March 4th. September 2nd was the latest data published by the EIA. The price had trended down for two years prior to March 14th therefore the turnaround since then is encouraging. Natural gas is expected to fuel the largest share of electricity generation in 2016 at 33 percent, compared with 32 percent for coal and in 2017, natural gas and coal are both forecast to fuel 32 percent.
Figure 2 shows the apparent supply of the two main steel tubular products used in oil and gas production from January 2003 through July 2016 (apparent supply is a proxy for demand.)
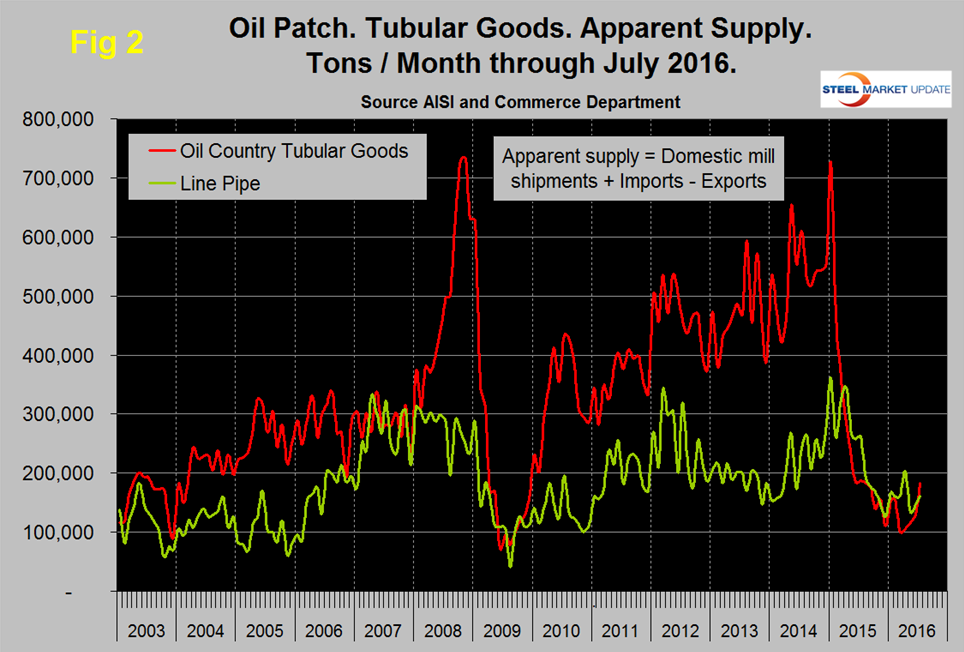
Following a weak December, line pipe demand coincided with the rising oil price but dived abruptly in May when the import volume which was 159,000 tons in April fell to 91,000 tons. Imports had recovered to 126,000 tons in July. The supply of OCTD which had fallen in March to 99,600 tons recovered slightly in April, May and June then shot up to 183,000 tons in July.
The total number of operating rigs in the US and Canada on September 9th was 639, up from a low of 445 on May 27th. In that time frame the oil rig count was up from 330 to 488 and the gas count was up from 115 to 151. Figure 3 shows the Baker Hughes US Rotary Rig Counts for oil and gas equipment in the US through September 9th (explanation below).
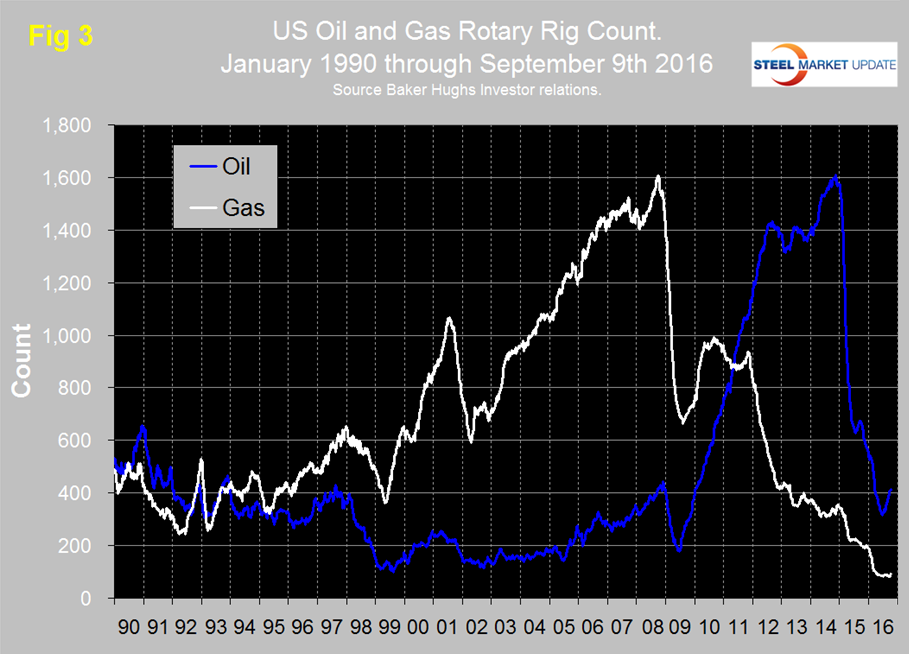
The uptick in the US oil rig count was the first since August of last year and now seems to be well established having increased from 316 on May 27th to 414 on September 9th. Based on the most recent available data, the EIA estimates that oil production from hydraulically fractured wells now makes up about half of total U.S. crude oil production. The off shore US rig count peaked at 66 on August 29th 2014 immediately before the oil price crash. Since then the off shore count has steadily declined to 18 (Figure 4).
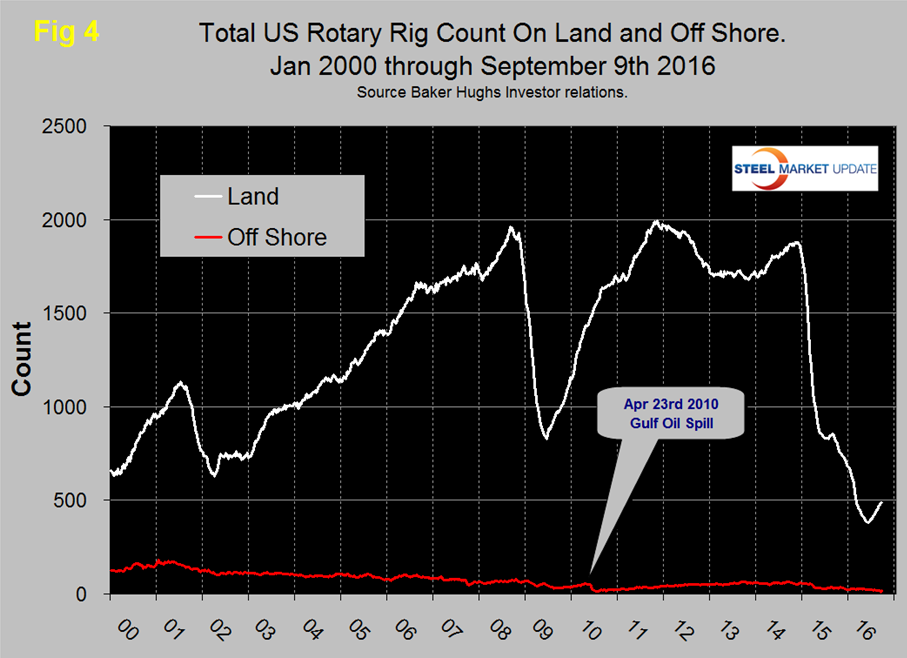
From HFI Premium Research August 5th. Looking at the earnings reports of companies like Diamond Offshore, it’s easy to see how offshore drilling has almost come to a complete stop. Be mindful that there are long-lead projects from 2014 that will be coming online in 2017, but after the oil price crash we likely won’t see a resurgence in offshore activity. Diamond Offshore’s CEO, Marc Edwards, said during the recent conference call that “some of the larger diversified oilfield service providers have declared a bottom in activity and are suggesting that a recovery is imminent. While this may be the case for certain onshore basins, it is not so for deep water drilling.”
The gas rig count in the US fell rapidly in 2015 and broke through the 200 level on September 11th. After a few months of relative stability the decline re-commenced in late December 2015 and bottomed out at 82 on June 3rd. Since then there has been a small recovery to 92 on September 9th.
On a regional basis in the US, the big three states for operating rigs are Texas, Oklahoma and North Dakota. Texas at 244 on September 9th was up from a low point of 173 on June 20th but still down from 318 at the beginning of the year. Oklahoma at 62 on September 9th was up from its low point of 54 on June 24th but down from 87 at the beginning of the year. North Dakota at 28 on September 9th was up from its low point of 22 on June 3rd but down from 53 at the beginning of the year.
About the Baker Hughes Rotary Rig Count: These are a weekly census of the number of drilling rigs actively exploring for or developing oil or natural gas in the United States. Rigs are considered active from the time they break ground until the time they reach their target depth and may be establishing a new well or sidetracking an existing one. The Baker Hughes Rotary Rig count includes only those rigs that are significant consumers of oilfield services and supplies.


