Prices
July 28, 2016
Hot Rolled Futures: Bullish News Pushing Values Higher
Written by Jack Marshall
The following article on the hot rolled coil (HRC) and financial futures markets was written by Jack Marshall of Crunch Risk LLC. Here is how Jack saw trading over the past week:
Steel
A trickle of bullish news for steel helping to push values higher on very light HR futures volume and reduced selling interests. Iron ore prices continue to remain in the mid 50’s despite the backwardated curve, CFR Turkish prices continue to rebound ($230/MT) on stronger Turkish demand and domestic scrap prices look to be sideways to up slightly for prime scrap (BUS). In addition, Chinese steel and billet prices are heading higher. MSCI reports show that steel service center inventory’s continue to remain lean.
Weak global economic conditions, along with the U.S Fed still in a holding pattern, has left the steel markets with tepid forecasts but relatively steady demand.
With steel supplies constrained due to effective removal of domestic steel production, labor disputes and the current high tariff environment, the U.S Steel industry is enjoying a brief rest from constrained margins. How long will this last? This week’s pick up in buying inquiries and higher bids for periods in Cal’17 suggest it could be an extended period.
The CME HR July contract settled at $621/ST. Looks like light spot physical transaction activity this past week has kept most of the HR indexes from falling too much. The decline anticipated in spot has been very slow which suggests mills have been holding firm on their offers.
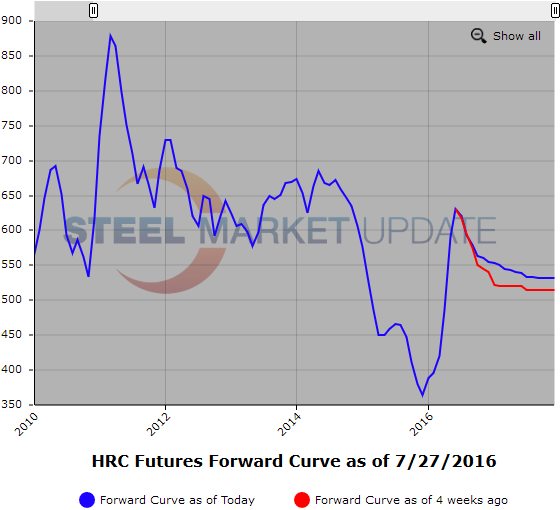
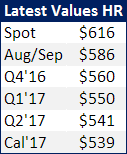
This week the focus has shifted to Q4’16 and Cal’17. Despite low trading Volume this week (12,160 ST of HR traded) the Cal’17 curve shifted up an average of $8/ST over the past week (Wed to Wed) with the Q1’17 value moving up $12/ST to $550/ST[$27.5/cwt], Q2’17 moving up $7/ST to $541/ST[$27.05/cwt], Q3’17 moving up $6/ST to $533/ST[$26.65/cwt] and Q4’17 moving up $8/ST to $532/ST[$26.60/cwt]. The futures curve got steeper between Q1’17 and Q2’17 as the spread between the two settlements increased from $4 to $9 and it got slightly flatter between the following 3 quarters of 2017 as the spread shrunk from $10 to $9.
Below is a graph showing the history of the hot rolled futures forward curve. You will need to view the graph on our website to use it’s interactive features, you can do so by clicking here. If you need assistance with either logging in or navigating the website, please contact our office at 800-432-3475 or info@SteelMarketUpdate.com.