Market Data

June 30, 2016
June 2016 at a Glance
Written by Brett Linton
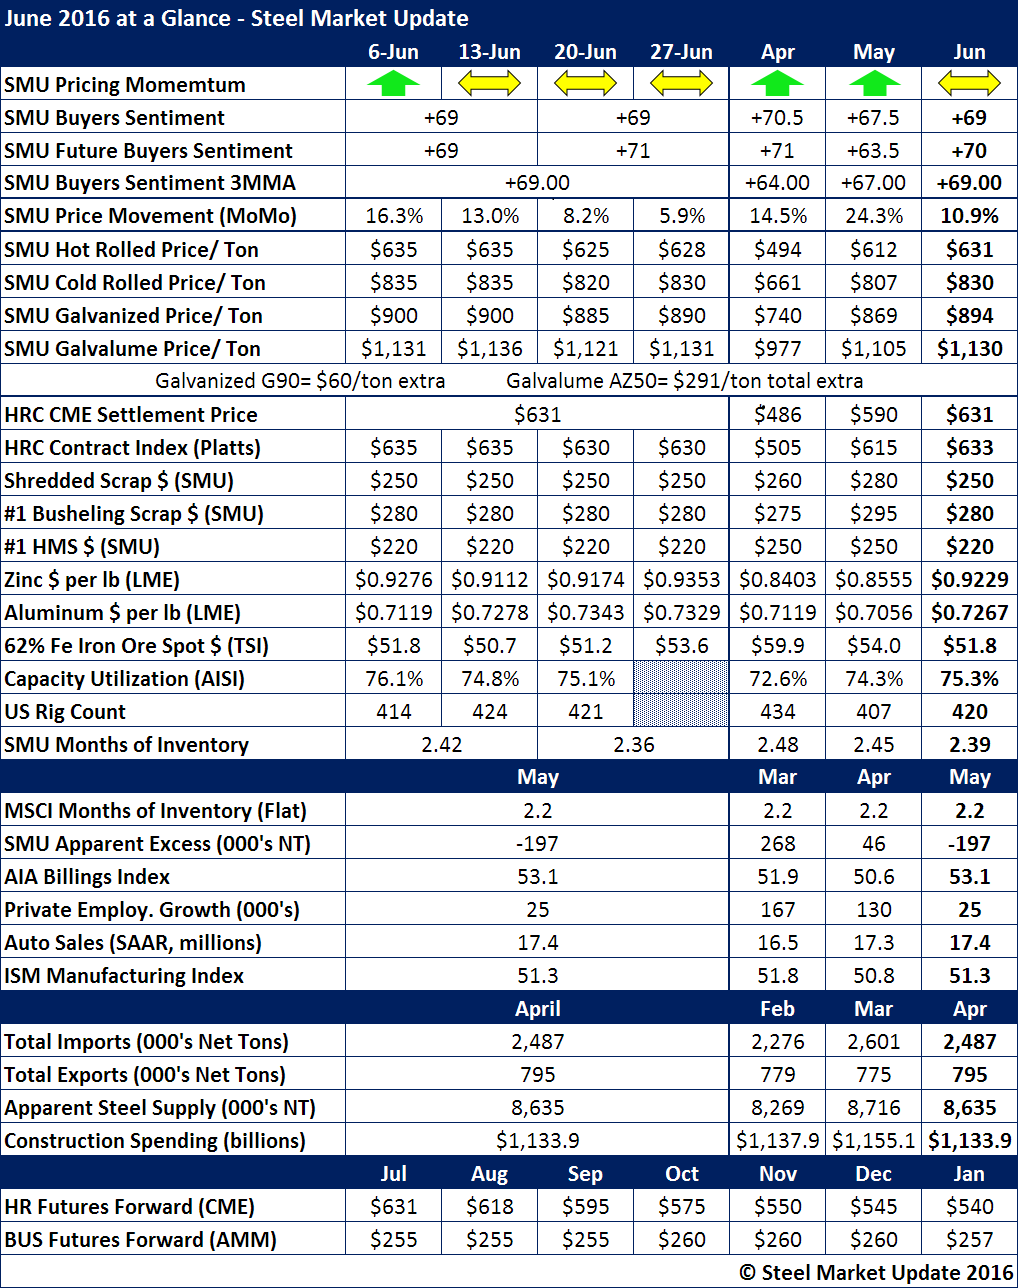
Andre Marshall stated in his “futures” article this evening that perhaps the market is a little too negative. The purpose of looking at the month of June in its totality is to provide another way to look at what just happened over the past month as you prepare for the next one.
SMU Price Momentum Indicator was adjusted to “Neutral” during the month of June. We believe prices will trend sideways (or bounce up and down, which is what we have seen over the past couple of weeks) until momentum is re-established in one direction or the other. The price increase announcements made by ArcelorMittal and NLMK USA during the month do not appear to have had any effect on the direction of prices.
SMU Steel Buyers Sentiment Index continues to move higher on our 3 month moving average. However, as we look at the monthly data we may be getting a little “toppy” with the numbers. Don’t get us wrong, these numbers are as optimistic as we have ever seen in our index. We will be watching this data carefully as we delve into the month of July.
Our hot rolled average for the month was the same as the CME settlement number and $2 per ton less than the Platts average for the month.
One item of huge importance is our calculation that the service centers (carbon flat rolled) inventories are now in deficit by 197,000 tons. That is not a big number when looking back at recent history – so we can call inventories essentially “balanced” and we expect them to remain that way for a number of months. Our Apparent Excess/Deficit Model is a proprietary product we share with our Premium level members once per month along with our forecast for distributor inventories going forward.


