Market Data

June 16, 2016
SMU HR Price MoMo Index Remains Positive but Slowing
Written by Brett Linton
The Steel Market Update (SMU) Price Momentum Index (MoMo) for hot rolled steel in the United States remained positive for the 24th consecutive week, following a 21 week negative streak. MoMo is a trailing indicator and shows the relationship between the current U.S. hot rolled coil price movements against the previous 12-week average price as a percentage. A positive MoMo index indicates hot rolled steel prices are moving in an upward direction compared to the previous 12 week period, while a negative index number indicates a downward direction of prices.
MoMo should not be confused with the SMU Price Momentum Indicator which is a forward looking indicator. The SMU Price Momentum Indicator was revised earlier this week to neutral indicating steady prices over the next 30 to 60 days.
MoMo was measured at 12.97 percent this week, meaning that the current HRC price is higher than the average price over the last 12 weeks.
The change in MoMo can be a useful indicator in depicting the severity of price movements and evaluating the directional trend for flat rolled steel prices. The week-over-week change in MoMo was -3.36 percent, following a change of -2.81 percent last week. This indicates that the hot rolled price movement is slowing down and at a slightly greater rate than what we measured last week.
To get a wider sense of the change in the MoMo Index and eliminate weekly fluctuations, we calculate a 3-week average change. The 3-week average change in the MoMo Index is -3.45 percent, following a change of -3.18 percent the week before. This also shows that the movement in hot rolled prices is decelerating and at an almost identical rate compared to the previous 3-week period.
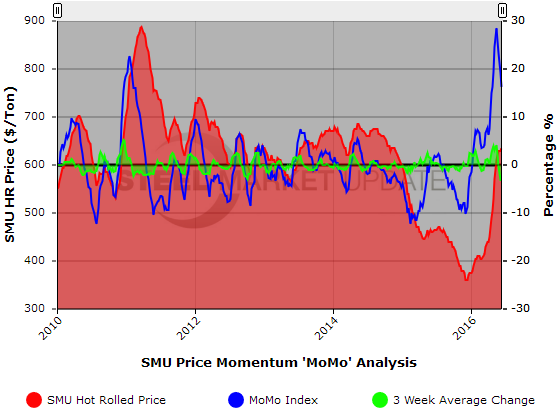
The graph below demonstrates the relationship between the SMU hot rolled coil price, the SMU Price MoMo Index, and the three week moving average change in the MoMo Index. As published in our Tuesday evening issue, the SMU HRC price range for this week is $620-$650 per ton with an average price of $635, unchanged from last week.
You may want to take a few moments to study this graph, especially those periods of time when there have been sharp spikes in pricing. Our index follows those spikes but we find it interesting that the steep drop after the peak on a number of occasions proceeds the actual price drop. A warning for steel buyers perhaps?


