

Market Data

May 31, 2016
China’s Economic Statistics Q1 2016
Written by Peter Wright
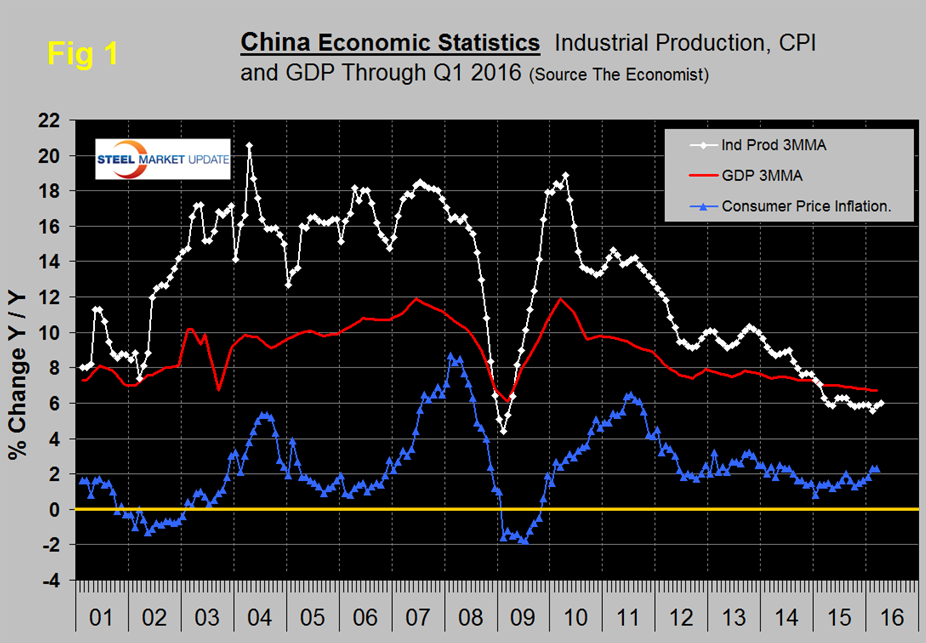
Figure 1 shows published data for the growth of GDP, industrial production and consumer prices through the first quarter of 2016. The GDP and industrial production portions of this graph are three month moving averages. The growth of GDP was 6.7 percent in the first quarter, down from 6.8 percent in the fourth quarter, and decelerating to its slowest pace since the global financial crisis. The growth rate of GDP has declined steadily since it peaked at 11.9 percent in Q1 2010.
David Lipton, First Deputy Managing Director, IMF had this to say on May 24, 2016: “As Larry Summers and others have reminded us, China must inevitably slow. It will no longer be super-charged. But it certainly can continue to make an important contribution as the biggest single contributor to global growth for some time. Don’t forget, in 2015, China’s growth was equivalent to adding an economy the size of Poland or Sweden to global GDP.”
The growth of industrial production in April was 6.0 percent and the 3MMA was also 6.0 percent as shown in Figure 1. The growth rate of IP has been declining erratically since the second quarter of 2010. Overcapacity in heavy industry sectors such as steel and coal continued to be excessive. The government’s ongoing program to re-balance the economy in favor of domestic consumption is continuing and this will slow the absorption of the excess steel capacity that has been put in place during the last decade.
Figure 2 was published by Goldman Sachs in April and shows China’s how the share of the global consumption of a range of raw materials including iron ore and steel changed between 2002 and 2012.

Consumer price inflation oscillated between 1.4 percent and 2.0 percent in 2015 but has increased this year, reaching 2.3 percent in March.
Figure 3 shows the growth of fixed asset investment year over year. The decline experienced in 2013 accelerated through all of 2014 and through August of 2015. At 10.0 percent in December the growth rate was the lowest since our data begins in 2001. Growth recovered slightly to 10.5 percent in April of this year.

We understand that this data includes real-estate purchases so is not a direct reflection of constructional steel demand. We are assuming that the steel on the ground portion of this data follows the overall trend and that the contraction in FAI is in accordance with the stated objective to rebalance the economy in favor of consumer consumption. Weaker investment in fixed assets is contributing to slower demand across a number of industries including steel and is pressuring corporate profits.
SMU Comment: We estimate that global steel overcapacity is now about 460 million tonnes per year and of that a high proportion is in China. In the 12 months of 2015, China produced 800.5 million tonnes, down by 2.4 percent from 819.9 million in 2014. Unfortunately, the anticipated decline ground to a halt in the latest production data for April published by the World Steel Association. China is now pushing more than the total of US steel production onto the world market.


