

Prices

April 14, 2016
Hot Rolled Futures: Back to Backwardation
Written by John Packard
The following article on the hot rolled coil (HRC), busheling scrap (BUS), and financial futures markets was written by Dave Feldstein. As Flack Steel’s director of risk management, Dave Feldstein is an active participant in the hot rolled coil (HRC) futures market and we believe he will provide insightful commentary and trading ideas to our readers. Besides writing Futures articles for Steel Market Update, Dave produces articles that our readers may find interesting under the heading “The Feldstein” on the Flack Steel website www.FlackSteel.com.
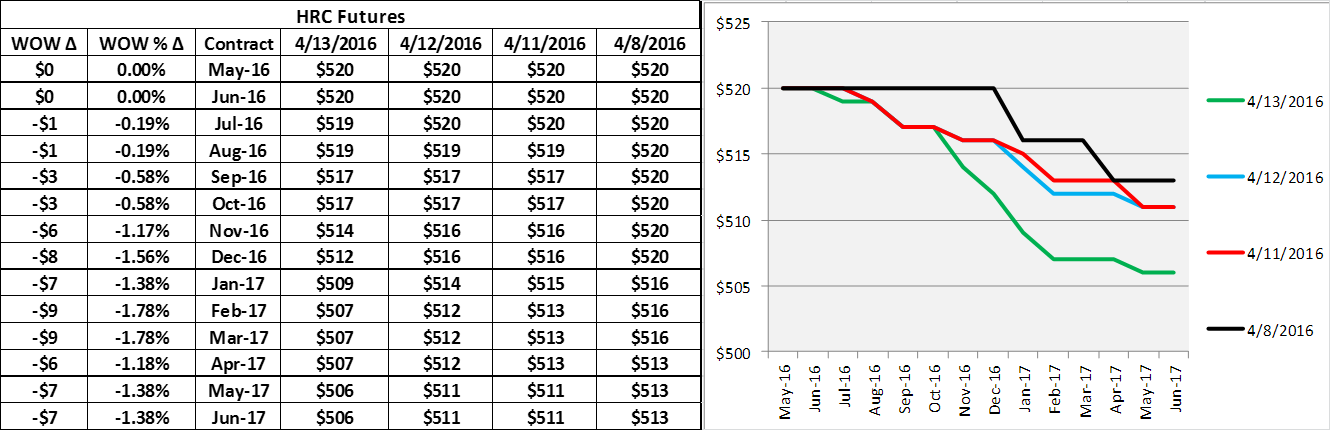
Last week’s surprising move from $490 to $530 in the May and June futures proved to be a short-term top as we have seen trades move marginally lower and farther out the curve with each passing day. As you can see above, the curve has become “backwardated” (the spot price/near term futures are above longer dated futures prices). However, there is still near term buy interest in the $520-$525 area for May – July, but not many interested sellers.
Last Thursday’s trades included 860 short tons (st) traded at $525 and 900 st at $520 in May 2016, 620 st at $525 in June 16 and 480 st/m traded $514 for calendar 2017. No trades on Friday. Monday saw 500 st/m trade $511 for May and June 2017. Tuesday saw $510 and $508 trade 1000st/m for Q3 2017. Yesterday we saw 500 st/m trade $505 for Calendar 2017. Today 500 st/m traded $507 for Q1 2017. These trades add up to 22,640 st traded for the week and rather impressive liquidity out into 2017. Current open interest across the curve is 446,000 tons.
There are a number of issues for why the curve is backwardated, one of them being the steep backwardation in the iron ore futures market (see below)
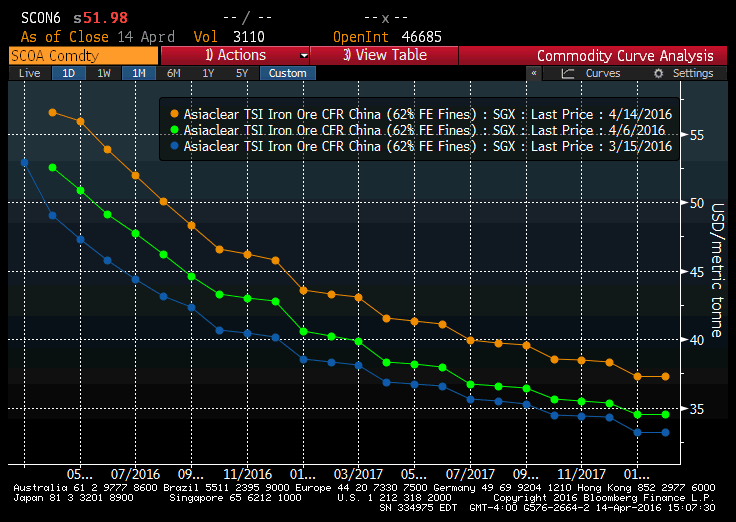
Following the sharp 20 percent one day rally last month, iron ore futures have come off their highs until resuming their rally over the past few days. Nevertheless, the oversupply of ore, expected to increase later this year, has kept the curve in backwardation. Perhaps the ore market provides us with an example for HRC futures of consolidation after a sharp rally. HRC futures have had a massive run after being badly oversold at the turn of the year.
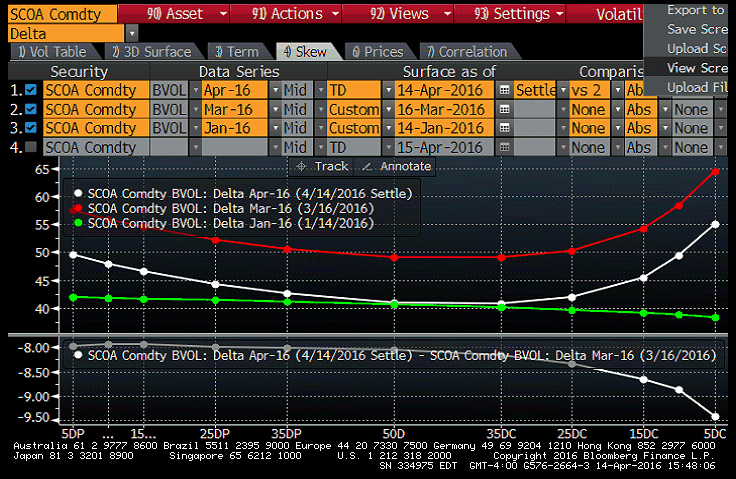
The chart above shows the price of iron ore options in terms of their volatility and type of option (i.e. at the money call vs. out of the money call). What is interesting about this chart is the increase in the price of out of the money calls (right side). The green line shows volatility in January and the downward slope shows the lack of interest in calls (i.e. bets that prices are heading higher). Following the Chinese National Congress Meeting (when ore spiked 20 percent), you can see volatility exploded higher (red line) and the smile shape was due to higher volatility and increased demand for upside calls. As of today (white line), volatility has settled down relative to March, but there is still strong demand for calls, which can be interpreted that market participants believe ore prices have more room to run (or want to hedge against it).
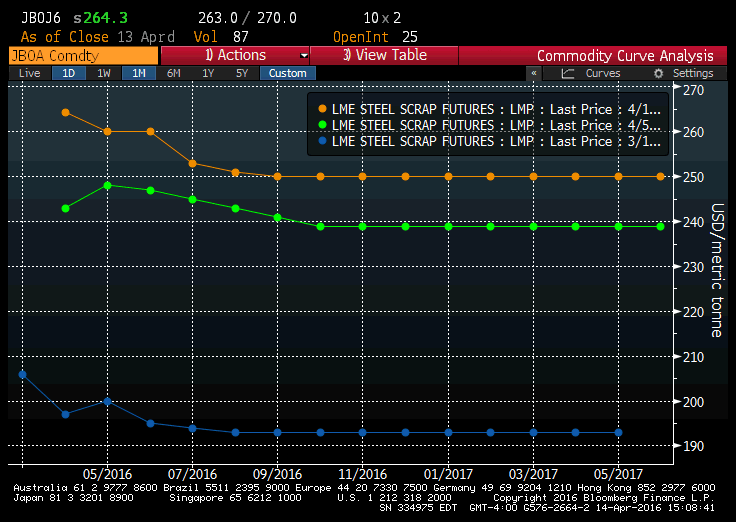
Below is the curve for the newly formed TSI Daily Turkish Scrap futures on the LME. Similar to HRC and ore, scrap has seen a big rally recently, but remains in backwardation.
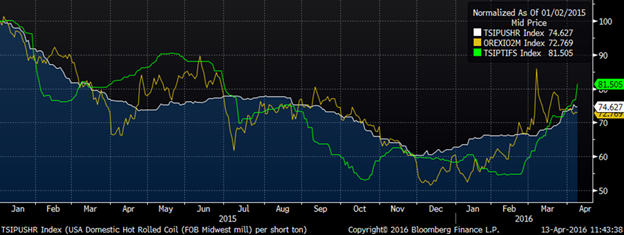
Below are prices of HRC, scrap and ore indexed at 100 on January 1st, 2015 for comparison.
TSI Daily Midwest HRC, TSI Daily Turkish Scrap, 2nd Month Iron Ore Futures
If you have any questions about this article or ferrous futures markets, feel free to reach out to me anytime at dfeldstein@flacksteel.com.


