Prices

March 17, 2016
Hot Rolled Futures Markets Grinding Higher
Written by Jack Marshall
The following HRC and BUS futures market trading article was written by Jack Marshall of Crunch Risk, LLC. Here is how Jack and Andre Marshall saw trading this week and what the forward curve looks like:
HR futures continue to grind higher. While HR demand seems to be holding steady we are starting to see some structural shifts in supply which have really helped give HR futures a bid tone lately. This week the anti-dumping duty announcements by the Commerce Department have re-enforced the expectations of import supply disruptions from record high import levels. We are seeing lengthening HR lead times, further HR price increase announcements for plate & sheet, modest inventory levels, and rising scrap exports from historically low levels due to quickly rising prices. The combination of all these dueling supply drivers along with announced integrated mill closings and falling capacity utilization rates appear to be slowly shifting sentiment in the HR space. The one caveat to this more bullish view could be the fickle price of iron ore, which gave back much of its recent price gains. Oh yes, and there is that extra 100 million tons of excess capacity Chinese steel!
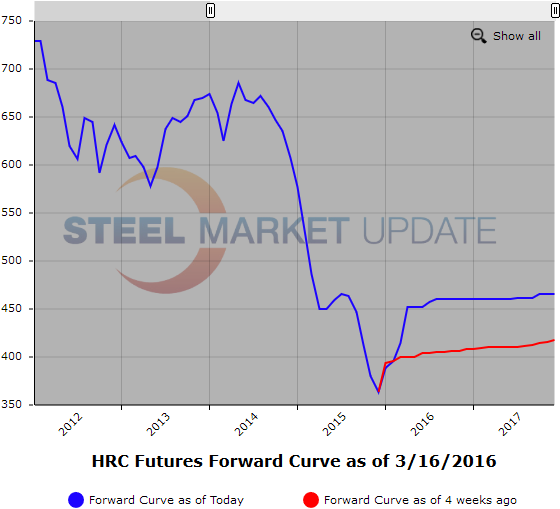
In HR futures this past week we have seen the CME spot month future (Mar’16) price move from $407 ST[$20.35cwt] to $415 ST[$20.75cwt] which, based on the rest of the futures curve, appears to be lagging market sentiment. You can see this in the shape of the HR futures curve which rises sharply between the spot month and Q2’16 ($452-$415 = $37] but is then flat for the next 4 Quarters at $460 ST.
In Q2’16 HR futures prices rose from $446 ST[$22.30cwt] last Thursday to $452 ST[$22.60cwt] value as of this Wednesday which also happens to be the last reported Q2’16 exchange trade price. During the week Q2’16 HR contract traded @ $451, $452, $453, and $454 ST.
In Q3’16 HR futures moved up from $446 ST[$22.30cwt] last Thursday to $460 ST[$23.00cwt] value as of this Wednesday. Q3’16 HR traded last at $457 ST[$22.85cwt] followed by trades at $460 ST[$23.00cwt] in Jul’16 and Aug’16 for small ST. However, today Q3’16 HR is bid $460 ST[$23.00cwt].
In Q4’16 HR price moved up from $450 ST[$22.50cwt] last Thursday to $460 ST[$23.00cwt] as of close Wednesday. Since last Thursday 22,180 HR contracts have traded. The majority of which were in Q2’16. Open interest stands at 25,100 contracts or 502,000 ST.
Spot month $415
Q2’16 $452
Q3’16 $460
Q4’16 $460
Q1’17 $460
BUS (Busheling Scrap)
The high billet price out of China has removed this Asian alternative scrap source for Turkish steel mills and has left them looking toward U.S. and European scrap markets for their source material thereby leading to a short squeeze in CFR Turkish scrap prices. This past week we have seen CFR Turkey prices move up from $209 GT to $226 GT. More loads leaving the Mid-Atlantic could create some additional tightness in East coast scrap markets and could also spill over into Midwest markets. In addition another wave of $30/$40 HR price increase announcements this week could lead to pressure for higher scrap prices. We are currently seeing buying interest in Q2’16 BUS at $210 GT and selling interest in 2H’16 BUS at $240 GT.
Below is a graphic of the HRC Futures Forward Curve. The interactive capabilities of the graph can only be used in Steel Market Update website here. If you have any issues logging in or navigating the website please contact us at info@steelmarketupdate.com or (800) 432 3475.


