Market Data

January 26, 2016
SMU Service Center Apparent Excess Results & Forecast
Written by Brett Linton
As part of our Premium level service, Steel Market Update (SMU) analyzes the service center shipment and inventory data and provides a short term forecast for carbon flat rolled steel shipments and inventories then we use our proprietary model to determine if distributor inventories are in Apparent Excess or a Deficit situation. Our forecast also includes how we think pricing will move over the next four months. This is done through a proprietary model and the results provided are called the Service Center Apparent Excess/Deficit Forecast.
First, we want to take a moment to discuss what we did right and wrong with our previous month forecast.
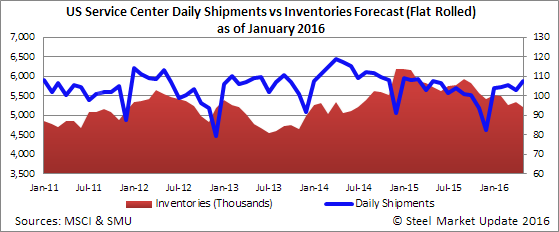
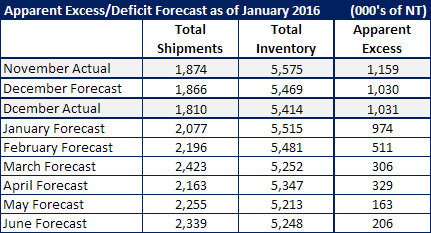
For the month of December, SMU forecast shipments would be 1,866,000 tons of carbon flat rolled steel. Our forecast was based on our model suggesting daily shipments would be 7 percent lower than December 2014 daily shipment levels. Actual shipments, according to the MSCI, were 1,810,000 tons. SMU missed being exact by 56,000 tons.
Flat rolled inventories were forecast to be 5,468,000 tons. We calculated this by taking November inventories, adding November daily receipts of 80,885 tons per day subtracting our forecast daily shipment rate (using 22 shipping days in December). Actual inventories came in 55,000 tons lower than our forecast with receipts averaging 74,950 tons per day which is the lowest level seen since December 2009.
Based on our Apparent Excess/Deficit model we have December as having 1,031,000 tons in excess of what our model considers “balanced” inventories for this time of year and business conditions. Our original forecast was for the excess to be 1,030,000 tons.
In our opinion this is about as close to a perfect score as we could ever hope to achieve.
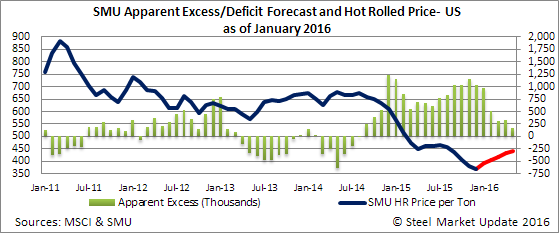
Our new forecast calls for shipments to be 2,077,000 tons of carbon flat rolled for the month of January. Flat rolled inventories receipts are projected to be 5 percent lower than the three year average and end the month of January at 5,414,000 tons at US service centers. If our forecast is accurate then service center inventories will end the month of January with an Apparent Excess of 974,000 tons. As you can see by the graphic below, we have inventories returning to a more “balanced” situation in March (+306,000) and remaining that way through the rest of our forecast cycle.
Everyone needs to remember that January tons were ordered on most products back in November at a time when skepticism was high and inventories were being reported as being too high. Service centers were not yet in a building mode. Once we got into December and lead times extended into February and March the service centers realized that they needed to place tons and began to do so. We are forecasting receipts to be 5 percent below the three year average in February & March 2016. We then believe we will turn back toward the norm being down 3 percent in April and then at the three year average in May and June 2016.
SMU is of the opinion that having distributors closer to a balanced inventory situation will create an environment where they need to place regular orders (we do not see wholesale speculation and large inventory builds) which will allow for the mills to collect price increases (albeit modest as the mills still must be concerned about foreign steel offers). We expect hot rolled prices to move to approximately $440-$450 per ton over the next couple of months (hot rolled is currently averaging $405 per ton).


