Market Data

November 3, 2015
The ISM Manufacturing Index Down Again in October
Written by Peter Wright
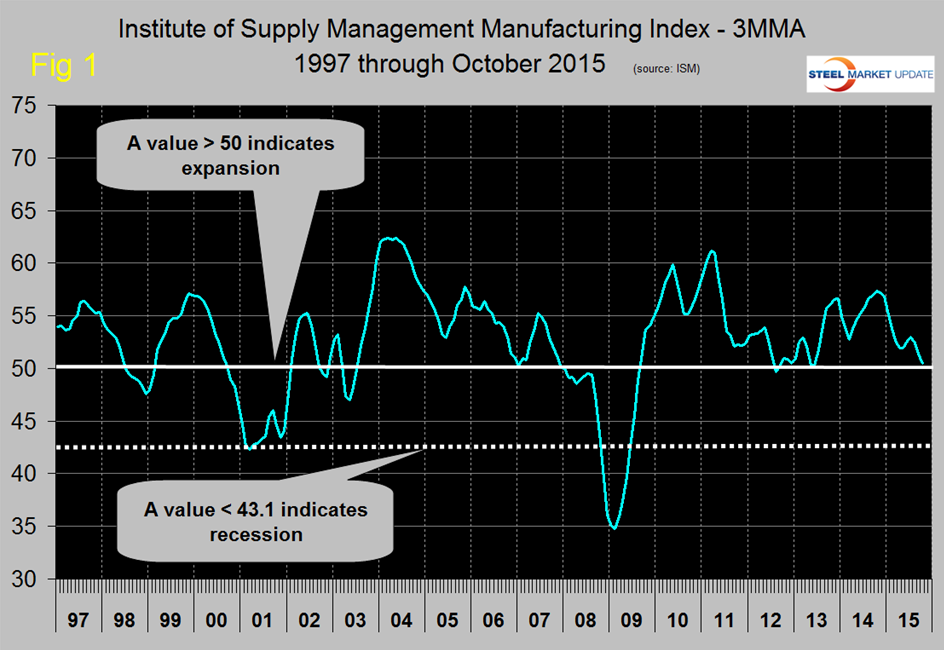
The Institute of Supply Management released their October report on November 2nd. An explanation of the ISM index is given at the end of this piece. After seven straight months of decline the three month moving average (3MMA) of the index had positive growth on a month over month basis in June and July but since then has had three more months of contraction ending up at 50.1 in October. Any number >50 indicates expansion. The three month moving average is now below the 307 month average since March 1990 which stands at 52.21. There has only been one month in over six years that the index has not exceeded the positive growth threshold of 50 (Figure 1).
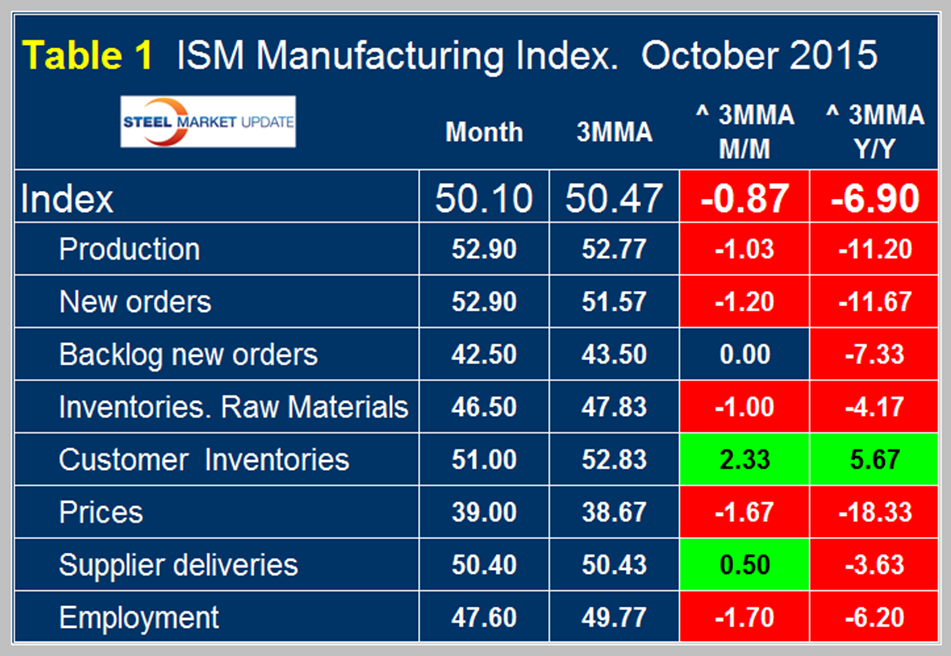
Table 1 shows the break down for October by sub index with the monthly result, the 3MMA, the growth of the 3MMA month over month and year over year for each. The table shows that the 3MMA YOY growth was negative 6.9 which was the eighth consecutive month of negative growth after eleven straight months of positive year over year growth.
Month over month, and year over year the only component to have a positive result on a 3MMA basis was customer inventories. Supplier deliveries improved month over month. Manufacturing is facing headwinds at present, two of the major ones being the value of the US dollar and weak global demand. Compared to October last year the 3MMA of every one of the sub-indexes except supplier deliveries deteriorated.
SMU Comment: The ISM index is in general agreement with the Federal Reserve Industrial Production Index which has had positive year over year growth for 64 months but on a 3MMA basis the rate of growth through September has slowed every month since January. The apparent supply of flat rolled steel products peaked in October last year, the ISM index also had a recent peak in October and the IP index peaked in January. This pattern is not true of long products which are more dependent on construction than manufacturing.
The official news release from the ISM is included below. Note the ISM discusses monthly values not the three month moving averages that we prefer in our SMU analyses.
New Orders and Production Growing, Supplier Deliveries Slowing, Employment and Inventories Contracting
(Tempe, Arizona) — Economic activity in the manufacturing sector expanded in October for the 34th consecutive month, and the overall economy grew for the 77th consecutive month, say the nation’s supply executives in the latest Manufacturing ISM Report On Business.
The report was issued today by Bradley J. Holcomb, CPSM, CPSD, chair of the Institute for Supply Management (ISM) Manufacturing Business Survey Committee. “The October PMI registered 50.1 percent, a decrease of 0.1 percentage point from the September reading of 50.2 percent. The New Orders Index registered 52.9 percent, an increase of 2.8 percentage points from the reading of 50.1 percent in September.
The Production Index registered 52.9 percent, 1.1 percentage points above the September reading of 51.8 percent. The Employment Index registered 47.6 percent, 2.9 percentage points below the September reading of 50.5 percent. Backlog of Orders registered 42.5 percent, an increase of 1 percentage point from the September reading of 41.5 percent.
The Prices Index registered 39 percent, an increase of 1 percentage point from the September reading of 38 percent, indicating lower raw materials prices for the 12th consecutive month. The New Export Orders Index registered 47.5 percent, up 1 percentage point from September, and the Imports Index registered 47 percent, down 3.5 percentage points from the September reading of 50.5 percent.
Comments from the panel reflect concern over the high price of the dollar and the continuing low price of oil, mixed with cautious optimism about steady to increasing demand in several industries.”
Of the 18 manufacturing industries, seven are reporting growth in October in the following order: Printing & Related Support Activities; Furniture & Related Products; Miscellaneous Manufacturing; Food, Beverage & Tobacco Products; Chemical Products; Paper Products; and Fabricated Metal Products.
The nine industries reporting contraction in October – listed in order – are: Apparel, Leather & Allied Products; Primary Metals; Petroleum & Coal Products; Plastics & Rubber Products; Electrical Equipment, Appliances & Components; Machinery; Transportation Equipment; Wood Products; and Computer & Electronic Products.
Explanation: The Manufacturing ISM Report On Business is published monthly by the Institute for Supply Management, the first supply institute in the world. Founded in 1915, ISM exists to lead and serve the supply management profession and is a highly influential and respected association in the global marketplace. ISM’s mission is to enhance the value and performance of procurement and supply chain management practitioners and their organizations worldwide. This report has been issued by the association since 1931, except for a four-year interruption during World War II.
The report is based on data compiled from purchasing and supply executives nationwide. Membership of the Manufacturing Business Survey Committee is diversified by NAICS, based on each industry’s contribution to gross domestic product (GDP). The PMI is a diffusion index. Diffusion indexes have the properties of leading indicators and are convenient summary measures showing the prevailing direction of change and the scope of change. A PMI reading above 50 percent indicates that the manufacturing economy is generally expanding; below 50 percent indicates that it is generally declining.
A PMI in excess of 42.2 percent, over a period of time, indicates that the overall economy, or gross domestic product (GDP), is generally expanding; below 42.2 percent, it is generally declining. The distance from 50 percent or 42.2 percent is indicative of the strength of the expansion or decline. With some of the indicators within this report, ISM has indicated the departure point between expansion and decline of comparable government series, as determined by regression analysis.


