Plate

October 20, 2015
Global Trade in Coiled Plate through Q2 2015
Written by Peter Wright
This report is a trial balloon and we ask your opinion as to whether such an analysis for the three major sheet products would be of interest. If so, we would go to the expense of purchasing data from the Iron and Steel Statistics Bureau, in the UK for the global trade of HR, CR and HDG and would produce a quarterly report such as this for each. To be honest at this time we have no idea what surprises such reports would produce.
A word of explanation; weather is a good analogy for global trade. Weather moves from high pressure areas to low pressure. Global trade moves from countries with a weak currency and low domestic demand (high pressure) to countries with a strong currency and high domestic demand (low pressure). There is a wide range within each condition for both weather and trade. It is impossible to make a weather forecast for a particular city or a trade forecast for a particular country without knowing the greater region atmospheric conditions or in the case of steel, recent trends in global trade patterns.
If we produce reports for sheet products the objective will be to understand how changes in global trade are affecting the availability of imports to the US. At the present time such an analysis does not exist and we rely on anecdotal evidence based on the opinion of traders. Not to say that such opinions are wrong but they are incomplete and not quantified.
So here goes:
The World Steel Association produces monthly production statistics for a wide range of rolled products including HR, CR and total metallic coated sheet products. In the case of plate which is defined as flat rolled ≥3mm thick, the WSA combines coil and discrete tonnages. Our estimate is that the global market for plate is 45 percent coil and in H1 2015 production totaled 53,488,000 tonnes. The first takeaway is that total global trade of coiled plate in H1 2015 was 16,066,000 tonnes therefore in the first half of this year, 30 percent of global production crossed international borders. Note, we have treated the EU as a single trading block for this purpose.
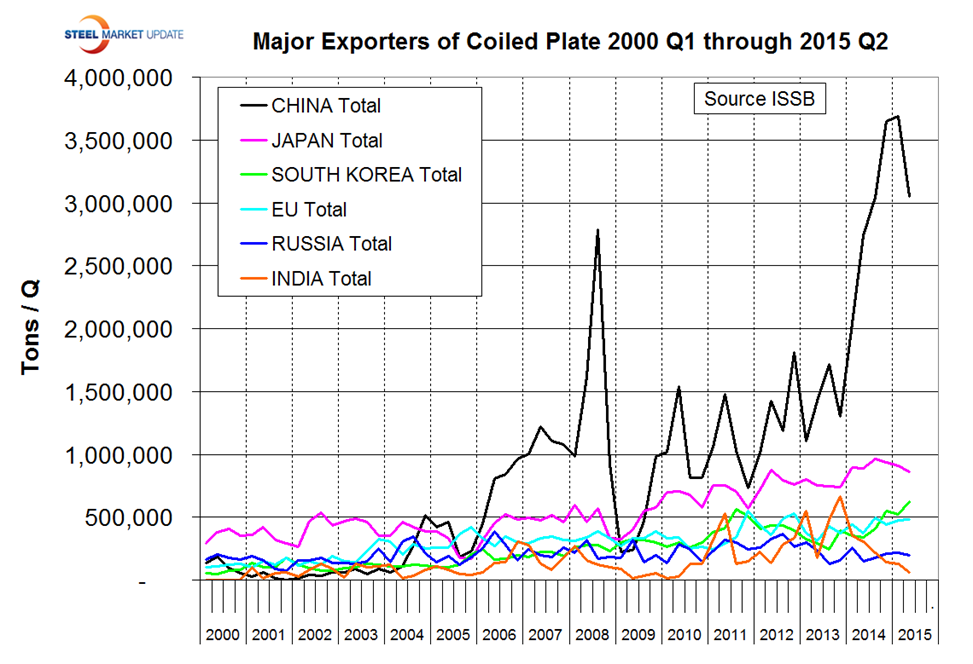
Figure 1 shows the tonnage exported by the six major players in the period Q1 2000 through Q2 2015.
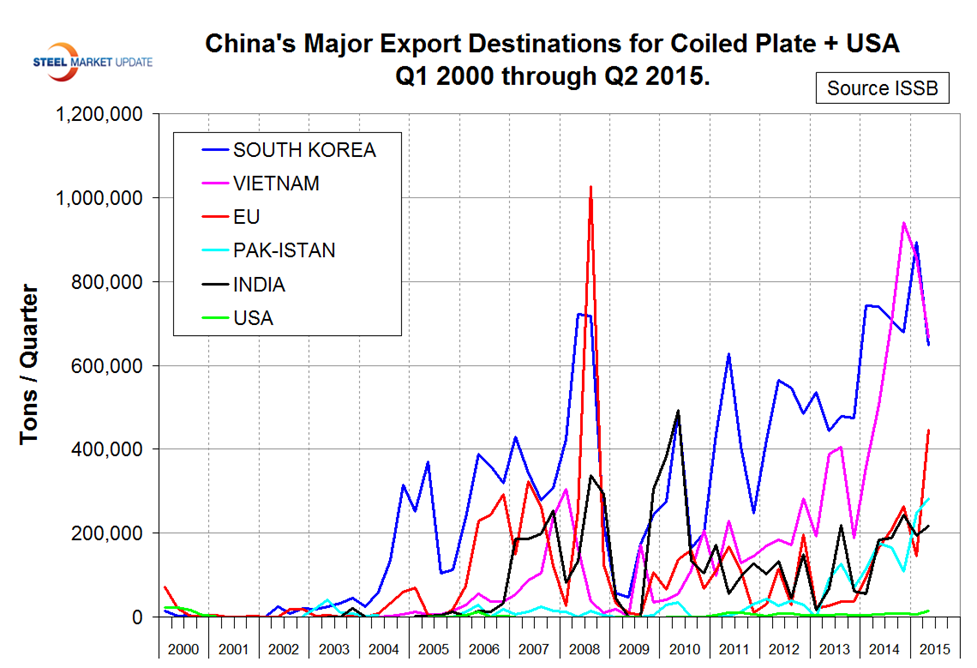
No surprise, China dwarfs the other five. Japan has more than doubled its coil plate exports since Q1 2009. There was a huge increase in China’s export volume in 2014 but in Q2 2015 the tonnage fell. Is that the start of a trend? Is displaced Chinese tonnage looking for a home somewhere else? The majority of the decline in Chinese tons was to South Korea and Vietnam as shown in Figure 2.
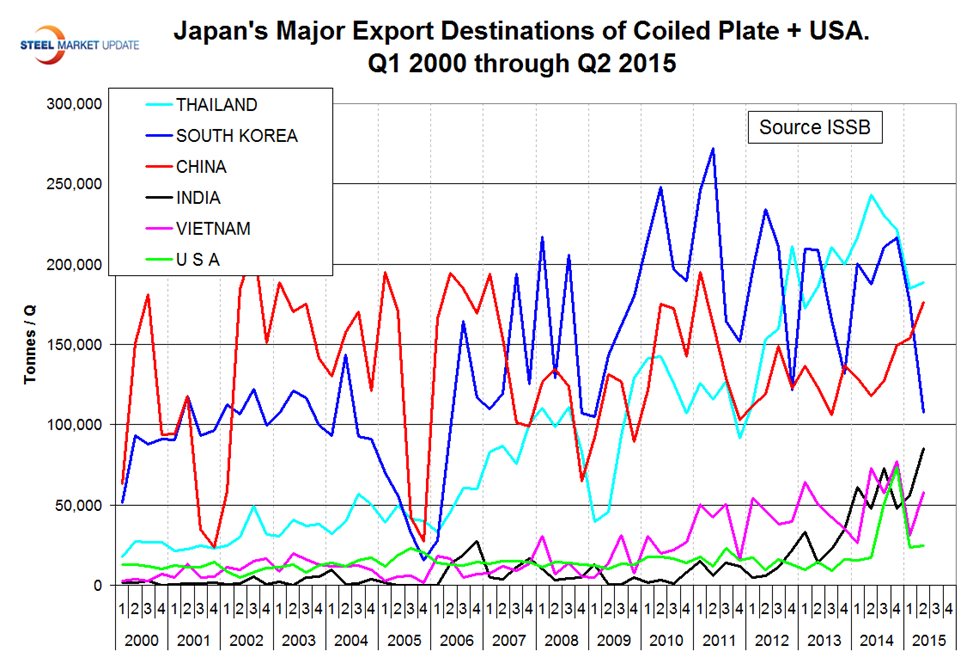
This chart shows the five major destinations for Chinese material plus the tonnage to the US. In the six calendar quarters since Q1 2014, the US was 27th in terms of tons shipped from China. This was a surprise to us and raises the point that this tonnage has plenty of room to grow. We were also surprised at the volume of coiled plate that China is shipping into the EU who are not pussycats when it comes to protecting their domestic industry. Figure 3 shows the five major destinations for Japanese material plus the US.
In this case the US was the 8th in terms of tons shipped from Japan. There was a spike in tonnage to the US in Q4 2014 and a recent surge to Thailand and India.
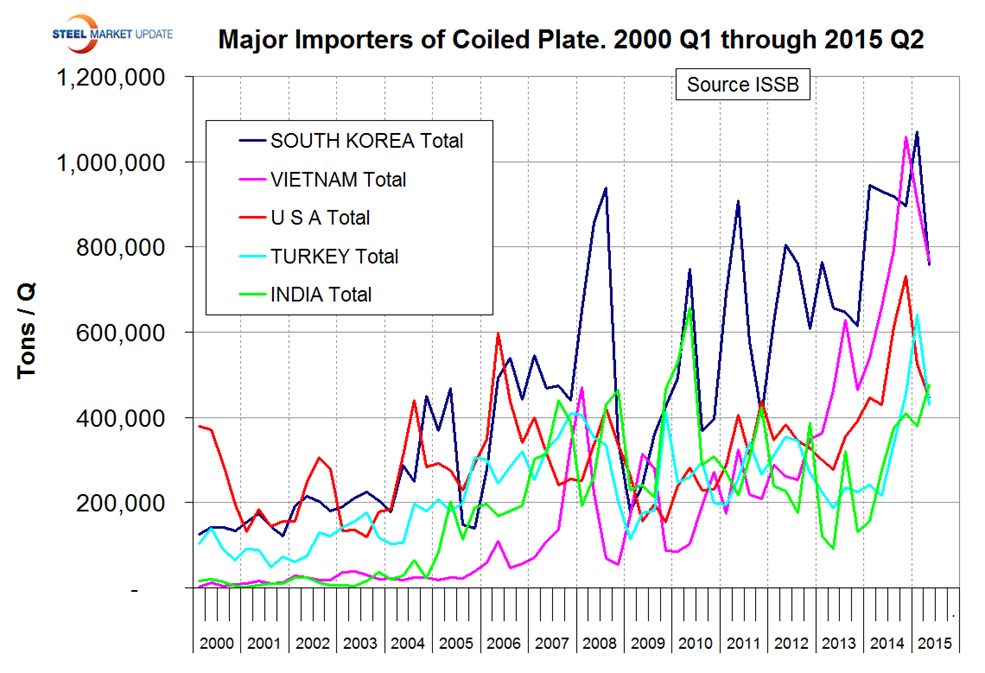
Figure 4 shows the five major importers of coiled plate of which in the six quarters through Q2 2015 the US was in 3rd place.
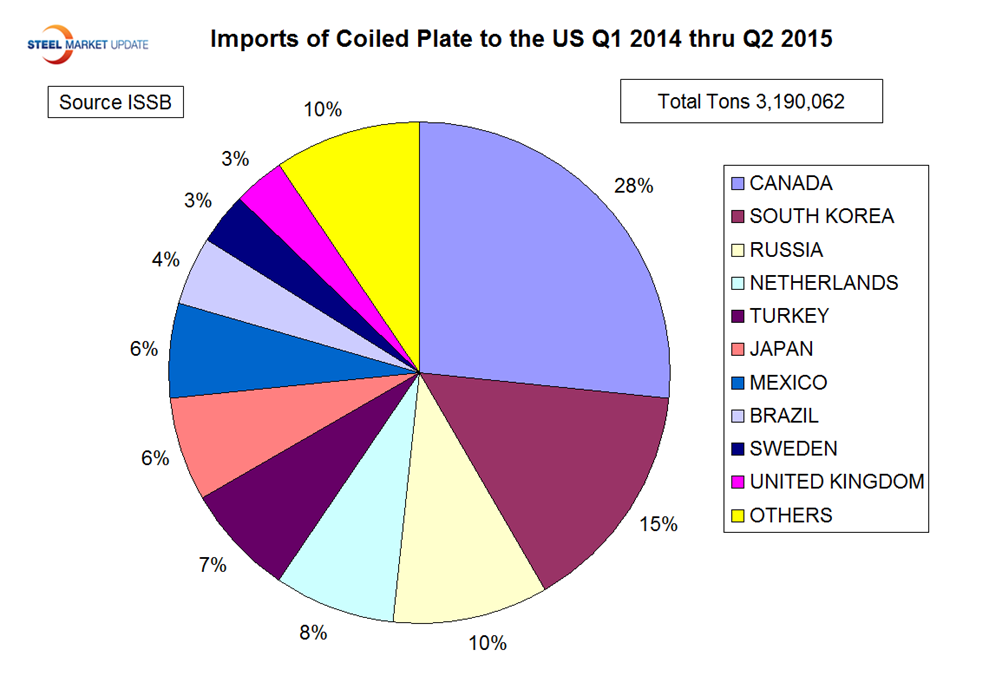
All five have increased substantially since 2013. Figure 5 shows the breakdown of US imports by source in the most recent six quarters.
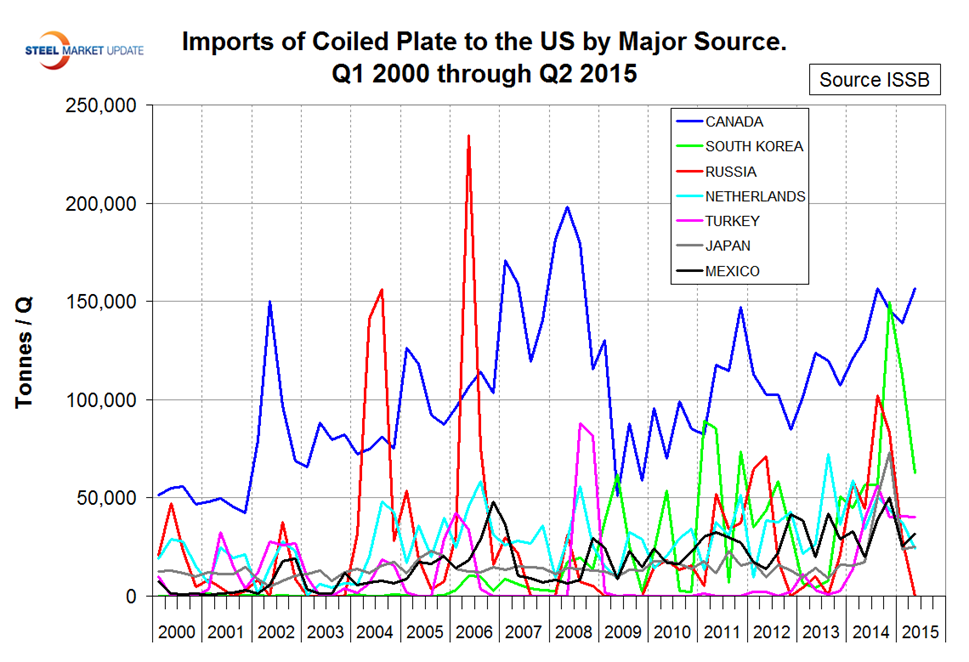
Canada was in first place with 28 percent followed by South Korea with 15 percent and Russia with 10 percent. Figure 6 shows the development of US import volume by source since Q1 2000.
Canadian volume increased steadily from 2000 until the recession, crashed and has since recovered steadily. South Korea has been in 2nd place this year though their tonnage in Q2 2015 was less than half what it was in Q4 2014.
We believe that this report shines a light on the global market for coiled plate and the US position in that market. If you think that such an analysis, which incidentally doesn’t exist anywhere else, would be useful to you for sheet products then please contact us at info@SteelMarketUpdate.com.


