Market Data
September 26, 2015
Durable Goods Shipments, Inventories and Orders
Written by Peter Wright
New orders for durable goods in August declined by 2.0 percent month on month to $236.322 billion. This result was in line with analyst’s expectations and was a result of a decline in transportation orders, mainly civil aircraft. Orders excluding transportation were unchanged. The three month moving average (3MMA) rose by 1.3 percent. The 3MMA has been trailing its trend for the last eight months (Figure 1).
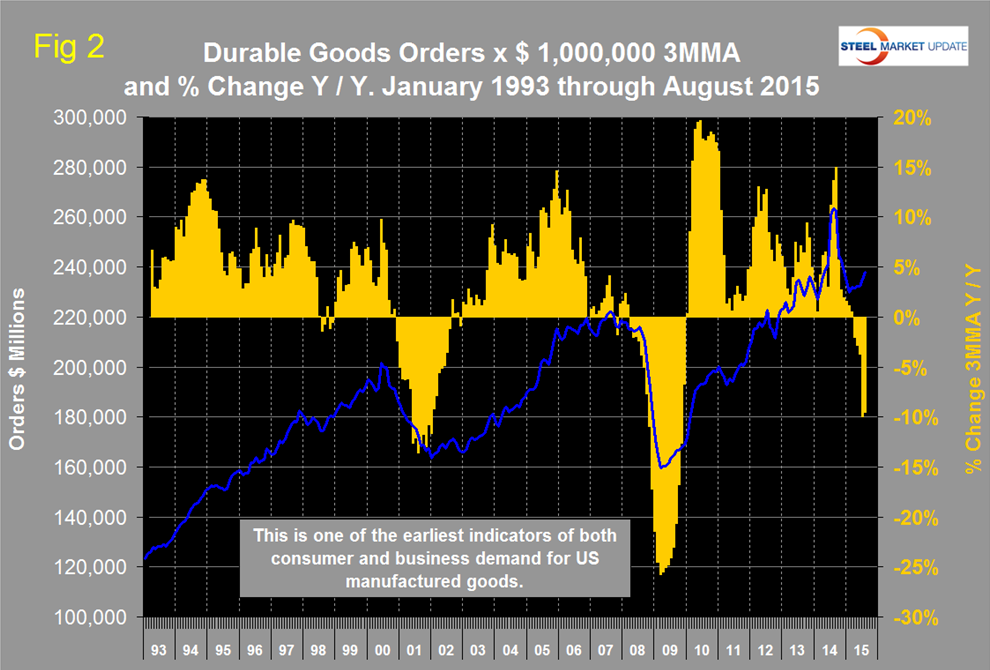
The huge spike in August last year was a manifestation of the surge in civil aircraft orders in July which resulted in the monthly number being a complete outlier in this data series. The 3MMA is shown in Figure 2 for the period January 1993 through August 2015.
The year over year growth rate of the 3MMA came in at negative 9.6 percent in August. Through July the y/y growth of the 3MMA deteriorated for ten straight months to negative 10.0 percent before improving slightly in August. This index is routinely whipsawed by both civil and military aircraft orders but we include it in our steel analyses because it is a reality check for other manufacturing data and is described by the Census Bureau as one of the earliest indicators for US manufactured goods.
The Federal Reserve Beige Book reported as follows on manufacturing on September 2nd; “District reports on manufacturing were generally positive during the reporting period. Ten Districts reported stable or positive growth and only two, New York and Kansas City, registered declines. Several areas of strength were noted: Auto sales have generally been above expectations and Cleveland, Richmond, and Chicago all reported strong growth in auto-related manufacturing. Aerospace, particularly commercial aviation, continued as a plus for manufacturing production in the Chicago, Dallas and San Francisco Districts. Demand from the construction industry was strong, with the Boston, Philadelphia, Cleveland, Chicago, Minneapolis, and Dallas Districts reporting increases in demand for construction-related goods from lumber to construction machinery. Even in Districts where manufacturing activity expanded, several factors were mentioned as damping demand: The Cleveland, Chicago, and Minneapolis Districts reported weakness in the agricultural sector and declines in demand for agricultural machinery. Falling energy prices have led to a reduction in demand for machinery (reported by Cleveland and Minneapolis) and metals (Chicago and St. Louis). The Boston, Philadelphia, Cleveland, Richmond, and Dallas Districts cited the strong dollar as a weakening influence. Manufacturing contacts in Cleveland, Chicago, and St. Louis reported that cheap steel imports were depressing demand and leading to low capacity utilization in that industry; these cheap imports were attributed to the strong dollar and slowing economic growth in Asia. Reports from three Districts explicitly mentioned the Chinese slowdown as a factor, noting reduced demand for wood products (San Francisco), chemicals (Boston), and high-tech goods (Dallas).
District reports cited no major revisions to firms’ capital spending plans, although contacts in the Kansas City District, for example, expected recent declines in activity to lead to a curtailment of capital expenditure. In general, District reports indicated the manufacturing outlook was positive; even contacts in Kansas City, one of the two Districts to report a decline in manufacturing activity, were modestly positive about the future.
The Census Bureau press release issued on Thursday read as follows:
New orders for manufactured durable goods in August decreased $4.8 billion or 2.0 percent to $236.3 billion, the U.S. Census Bureau announced today. This decrease, down following two consecutive monthly increases, followed a 1.9 percent July increase. Excluding transportation, new orders decreased less than $0.1 billion, or virtually unchanged. Excluding defense, new orders decreased $2.2 billion or 1.0 percent. Transportation equipment, also down following two consecutive monthly increases, led the decrease, $4.8 billion or 5.8 percent to $78.7 billion.
Shipments of manufactured durable goods in August, down following two consecutive monthly increases, decreased less than $0.1 billion, or virtually unchanged, to $243.2 billion. This followed a 1.0 percent July increase. Primary metals, down ten of the last eleven months, drove the decrease, $0.2 billion or 1.0 percent to $20.5 billion.
Unfilled orders for manufactured durable goods in August, down following two consecutive monthly increases, decreased $2.2 billion or 0.2 percent to $1,195.3 billion. This followed a 0.2 percent July increase. Transportation equipment, also down following two consecutive monthly increases, led the decrease, $2.1 billion or 0.3 percent to $800.3 billion.
Inventories of manufactured durable goods in August, up two of the last three months, increased $0.1 billion, or virtually unchanged, to $401.4 billion. This followed a 0.2 percent July decrease. Transportation equipment, up four of the last five months, drove the increase, $0.9 billion or 0.7 percent to $132.5 billion.


