Prices

September 24, 2015
Hot Rolled Futures: Broken Support
Written by Andre Marshall
The following article on the hot rolled coil (HRC), busheling scrap (BUS), iron ore and financial futures markets was written by Andre Marshall, CEO of Crunch Risk LLC and our Managing Price Risk I & II instructor. Here is how Andre saw trading over the past week:
Financial Markets:
Basis last reporting of improving markets off of the August 24th lows in both equities and commodities, we now have broken these support trend lines that had developed. This occurred on Sep 18th, literally the day after last week’s reporting. The S+P 500 is now down to 1918 zone after having reached an interim high of 2012 approx., or almost 5%. That said, we touched 1897 today and recovered back to 1918 by the close so this interim correction may be over. Otherwise we are headed to test the recent lows at 1827 zone. The charts are not really giving any firm clues here, but, with the Fed backing away, there’s good reason think stocks grind higher, albeit in a more volatile environment.
Copper too has broken recent support, quite handsomely in fact, last $2.31/lb zone on the Dec futures, having dropped from its recent high on Sep 17th of $2.50/lb., or about 7.5%. It looks like Copper may well will want to test its lows at $2.2150/lb. set on Aug. 24th. Different from equities in that there is no 401K buying machine to support the market, and fundamentals just aren’t there yet in commodities to curtail price declines until supply is addressed.
Crude as well has broken the support trend line started on Aug. 24th, however, there is still a bull flag formation intact. That said, we are literally on the bottom the edge of that flag in today’s trading and it’s precarious at best considering that other commodity markets are in real retracement mode. The fact that crude hasn’t corrected more than it has so far from the August 31st highs, with everything else off pretty hard, tells me it probably wants to go higher first.
Steel:
Same story here really as the price tried to hold the $440-450/ST spot level and couldn’t. In the works for weeks now, the CRU caught up with reality on the ground and we had a whopping $15/ST drop to $434/ST. If I had to guess the CRU usually moves like that when there are real spot deals actually transacting (it’s been a while now), and my bet would be on the tubers coming back in to buy a bit after having reduced their inventory for quite some time. We’ll see if anyones’ lead times stabilize and whether there is surprise support on scrap to verify that possibility. Fingers crossed! This has clearly been the missing element in the market, that tuber outlet for base HR volumes.
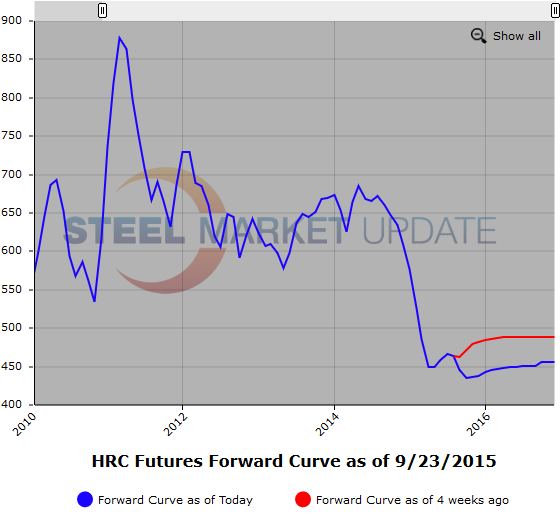
Meantime we had another decent week in steel futures, but unfortunately same trend, down, and after CRU’s drop, big down! We traded decent volumes this week of 2185 Lots or 43,700 ST. The big movers this week were Q1 down to a low of $443/ST from $459/ST or down $16/ST, and Cal ’16 which we traded $450/ST, which is down approx.. $20/ST from last traded, and $15/ST from last firm offer. It’s a case of metal holders looking for any contango to sell as the front contango now eroded. Back end levels Q1 16 onward really looking quite compelling for forward buyers. Of course, one could have said that 10 times in the last 4 months.
elow is a graphic of the HRC Futures Forward Curve. The interactive capabilities of the graph can only be used in Steel Market Update website here. If you have any issues logging in or navigating the website please contact us at info@steelmarketupdate.com or (800) 432 3475.
Iron Ore
Well, spot Iron Ore has held up. We are last $56/MT approximately on the index and the forwards remain fairly well backwardated. Drivers still seems to be lean inventories at port and mill locations, despite rises off the lows, and lower shipments of Ore from the likes of Australia and Brazil. Recent uptick in freight rates may suggest that that trend may change, we’ll see. Let’s call Oct. either side of $54/MT, Nov. either side of $51.50/MT, Q4 either side of $51.65/MT, Q1 either side of $47.25/MT, Q2 either side of $44.55/MT and Cal ’16 either side of $44.35/MT.
Scrap:
Well CFR Turkey is last $193/MT, and most traders there think that $190/MT will be the floor despite continuing Chinese billet dumping. Regardless it doesn’t look like many, if any, cargoes will be lifted off East Coast unless we move into parity. Some are calling for just that, i.e. down $30-40/GT, and others say that some yards aren’t even collecting anymore and unlikely to see much more downside. Still too early to get any real signals on what price does in October.
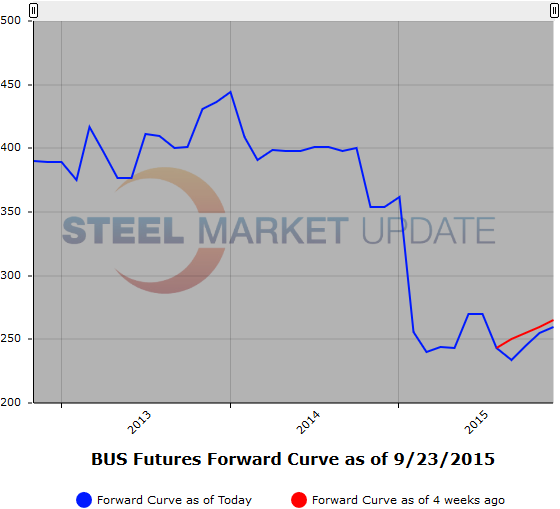
Another graphic is below, to use it’s interactive features you must visit this page on our website.


