Prices

September 10, 2015
Net Sheet Imports Thru July
Written by Peter Wright
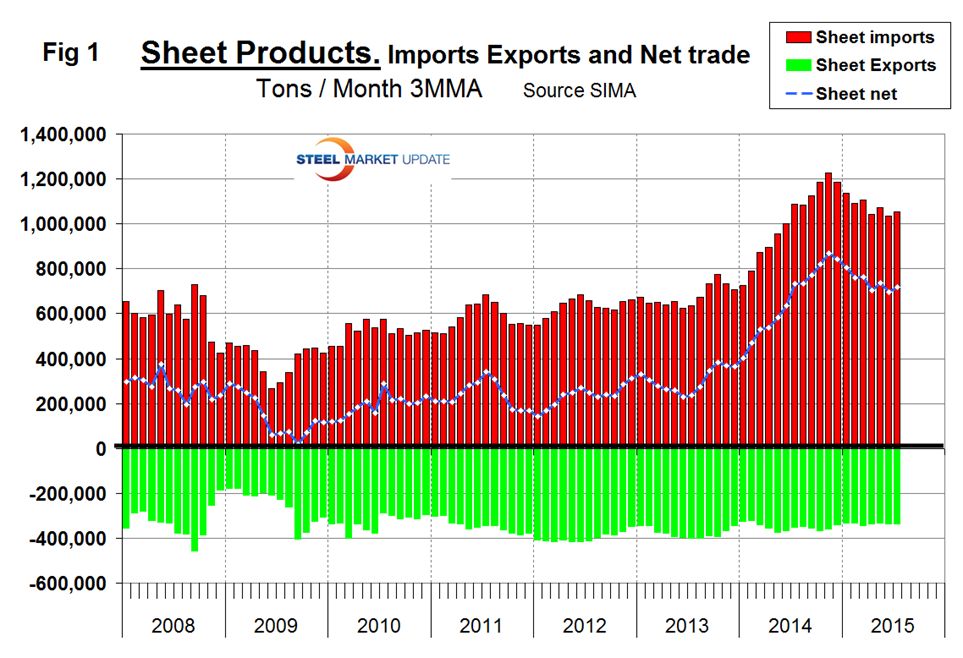
Net imports equals imports minus exports. We regard this as an important look at the overall trade picture and its effect on demand at the mill level. Figure 1 shows that net sheet product imports on a three month moving average, (3MMA) basis at 718,000 tons in July continue to be more than double that which existed before the recession. The deterioration in net has been almost entirely an import effect, exports have been fairly consistent though drifting down slightly since Q2 2012.
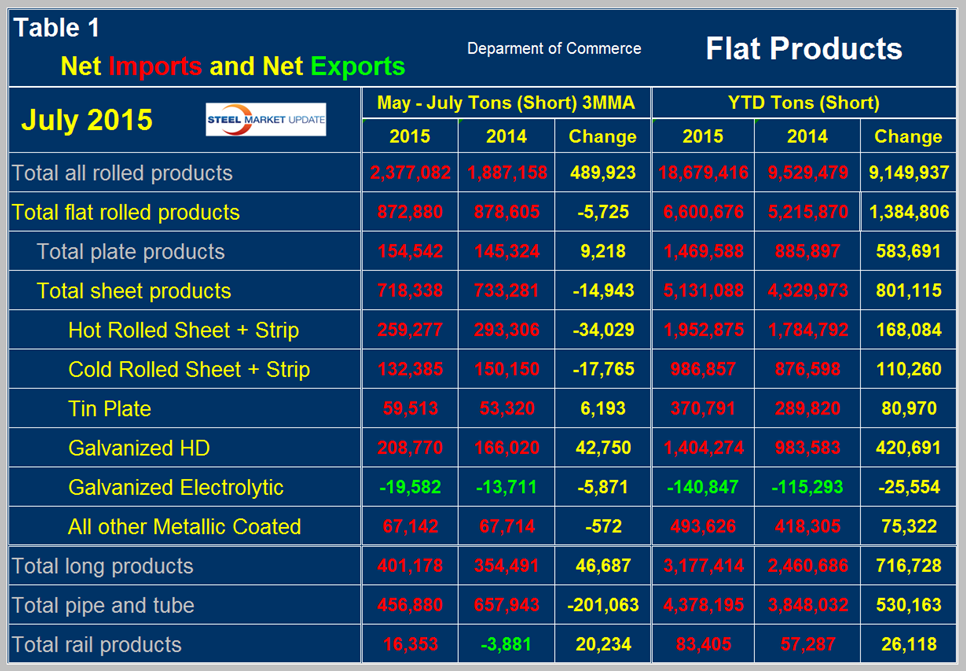
Table 1 shows net imports by product. Year to date through July, total net flat rolled imports were 6,600,676 tons, up by 1,384,806 tons year over year. Of this 5,131,088 tons were sheet products, up by 801,115 tons. On a three month moving average basis (3MMA), May through July net sheet imports decreased by 14,943 tons per month year over year. The 3MMA of net imports decreased y/y on all sheet steel products except tin plate and hot dipped galvanized. Electro-galvanized is the only sheet product that currently enjoys net exports and in the latest data that surplus improved year over year. In Table 1 negative net imports (which means a trade surplus) are shown in green.
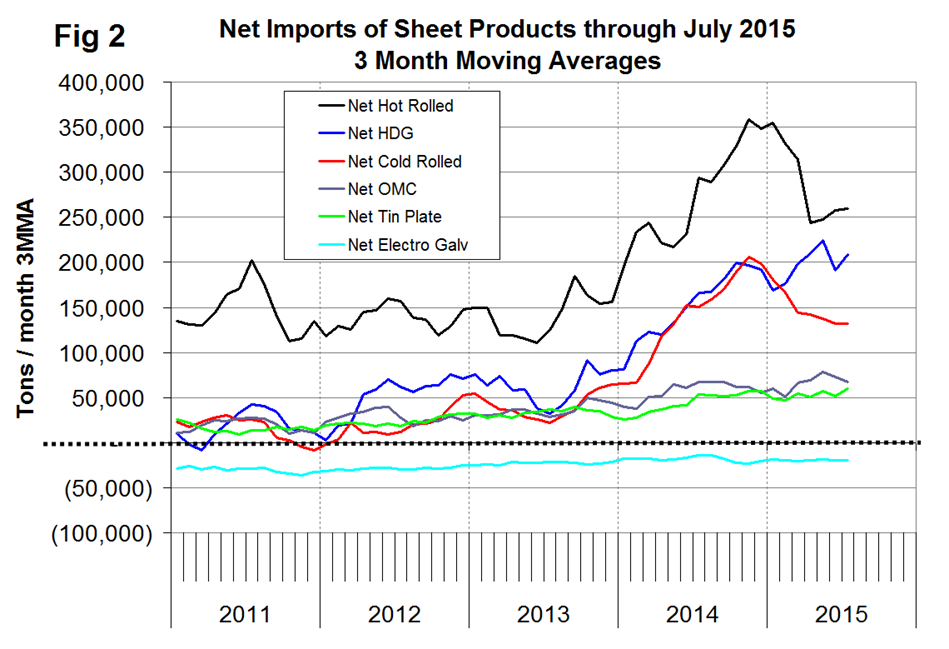
Figure 2 shows the trend of monthly net sheet product imports since January 2011 on a 3MMA basis. Net hot rolled imports declined in January through April but reversed course in May and June and there was a further small increase in July. HDG increased every month, February through May then declined in June then picked up again in July. Cold rolled net imports have been declining since November last year.
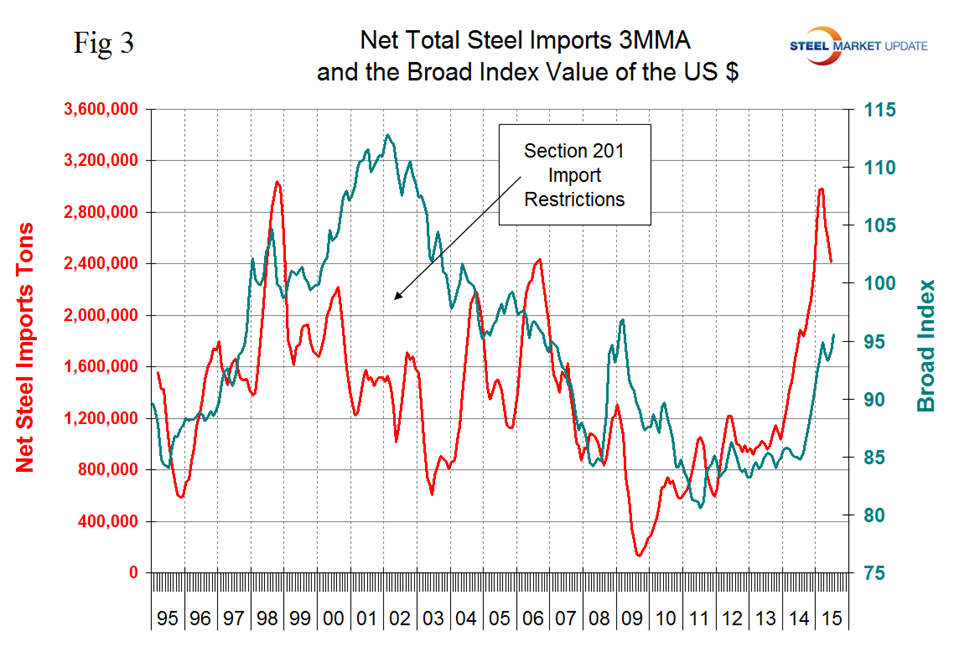
We believe there are two main drivers of the strength of net steel imports. The trade weighted value of the US $ is increasing which makes our exports less attractive to foreign buyers and makes the US domestic market more attractive to foreign sellers as imports are more attractive to domestic buyers.
Figure 3 shows the relationship between net imports and the value of the $ since January 2011.


