Analysis

August 21, 2015
US Vehicle Sales and NAFTA Vehicle Production in July 2015
Written by Peter Wright
Following the exceptional rate of vehicle sales in the US in May the June rate fell from 17.8 million annualized to 17.2 million then bounced back to 17.5 million in July. This was the second best month of the year. Light trucks continued to pull ahead of automobiles. In July LT sales which includes crossovers were 9.7 million units and cars were 7.8 million. Imports fell from 3.7 million units to 3.5 million for an import market share of exactly 20 percent. Import market share has been trending down this year and is well below the 30 percent level reached in early 2009.
Total light vehicle (LV) production in NAFTA in July was at an annual rate of 15.557 million units, down from 18.543 in June. On average since 2004, July’s production has been 29.2 percent lower than June as auto companies take their annual tooling shutdown. July this year was down by 16.1 percent (Figure 1).
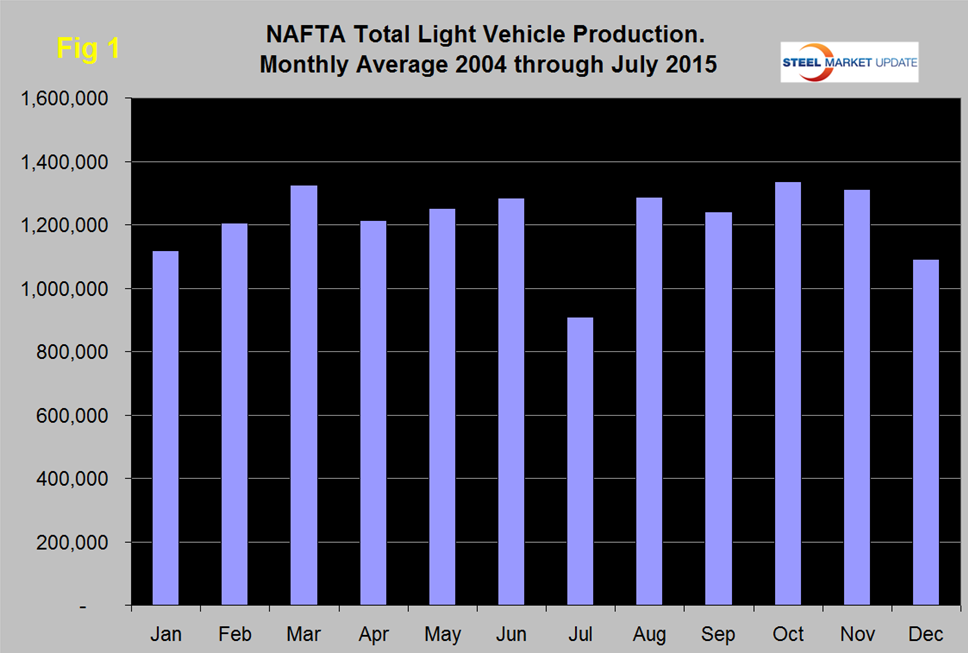
Note: these production numbers are not seasonally adjusted, the sales data reported above are seasonally adjusted. There have been reports in the press that some auto companies planned to curtail their summer maintenance shutdowns this year which would explain why July was better than normal.
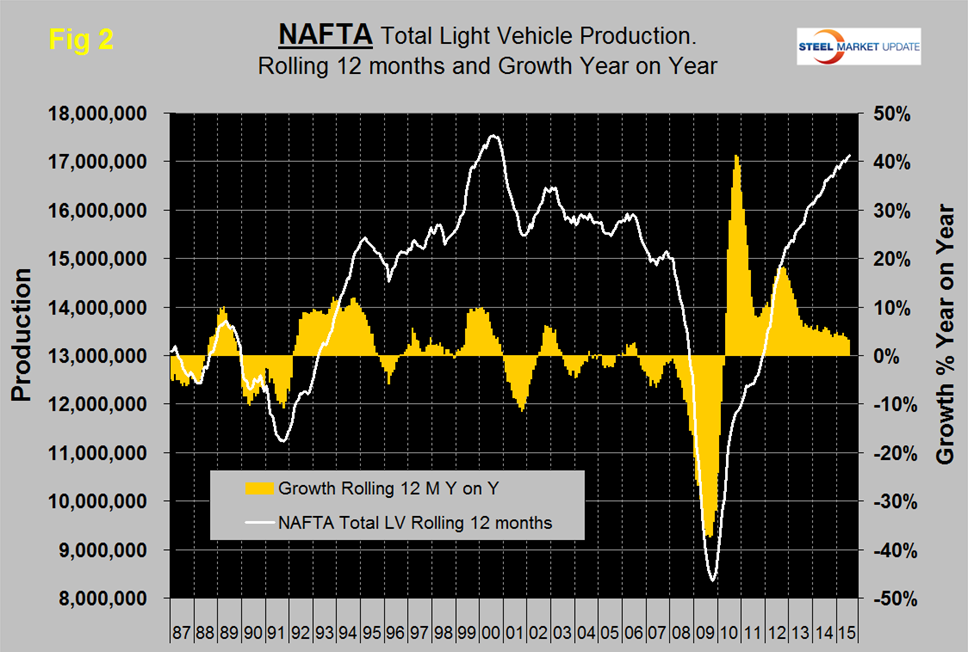
On a rolling 12 months basis y/y LV production in NAFTA increased by 3.1 percent through July. LV production in NAFTA is now well above the pre-recession peak of Q2 2006 and is heading for the all-time high of mid-2000 (Figure 2).
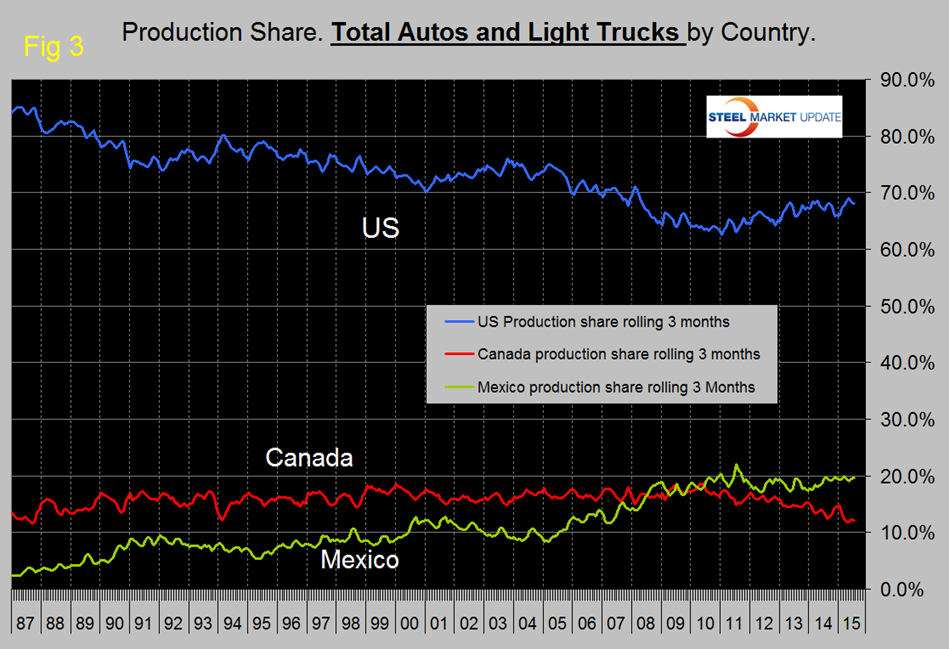
On a rolling 12 months basis y/y the US is up by 3.1 percent, Canada is down by 4.9 percent and Mexico is up by 9.6 percent (Table 1).
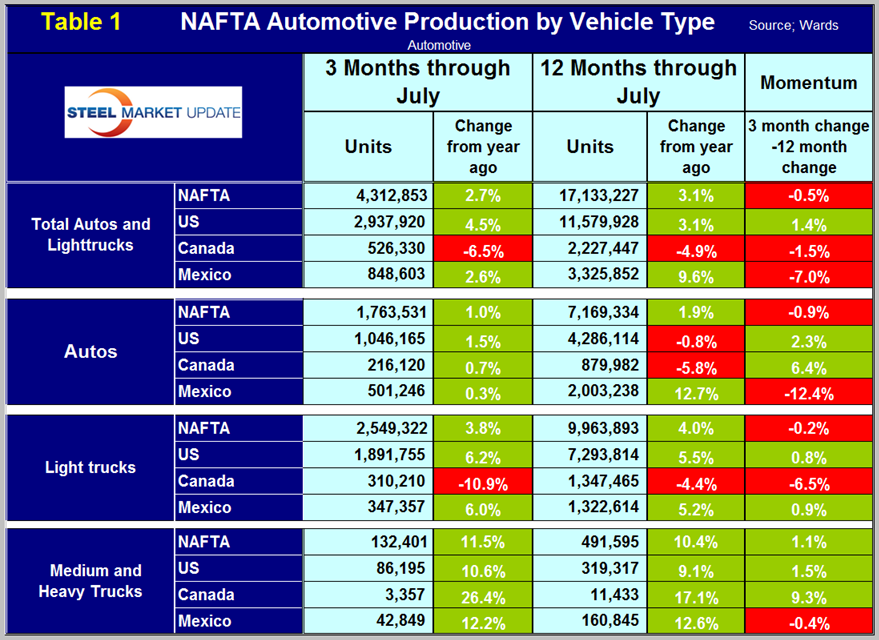
Growth rates in 3 months through July y/y indicate that the US has positive momentum but that of Canada and Mexico is negative. The US has gained production share in the most recent 3.5 years (Figure 3) and so far in 2015 that gain has accelerated at the expense of Canada.
Mexico’s share has been fairly flat. A close examination of Canadian and US share this year in Figure 3 shows that they are a mirror image of each other suggesting that the auto companies routinely move production from one side of the border to the other. In July on a rolling three month basis, the US production share of total light vehicles was 68.1 percent, down from 69 percent in May which was the highest since March 2008.
Figure 4, Figure 5 and Figure 6 show total LV production by country with y/y growth rates and on each the red line shows the change in production since Q2 2006.
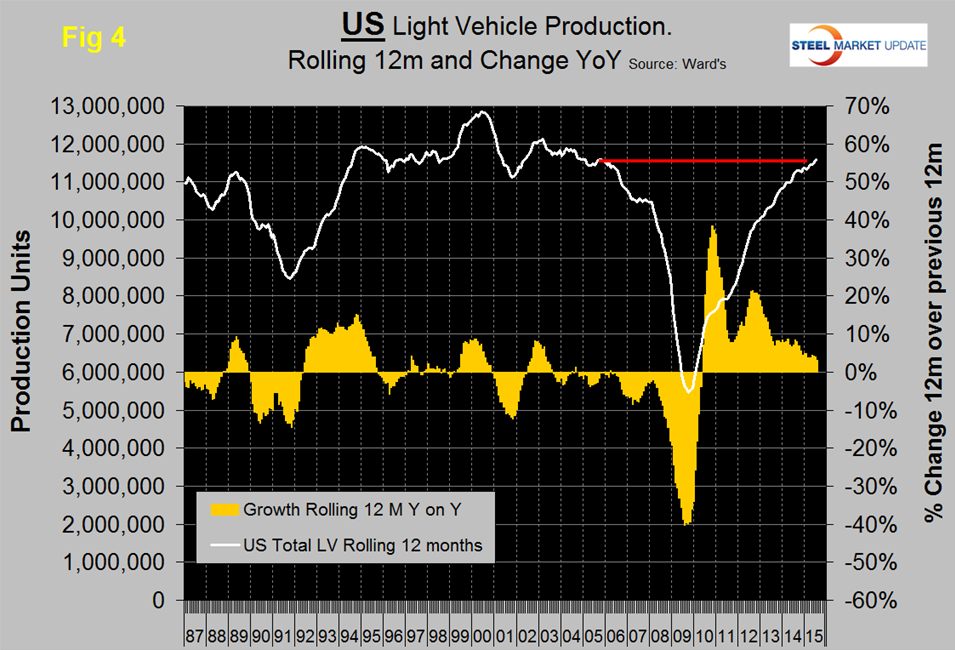
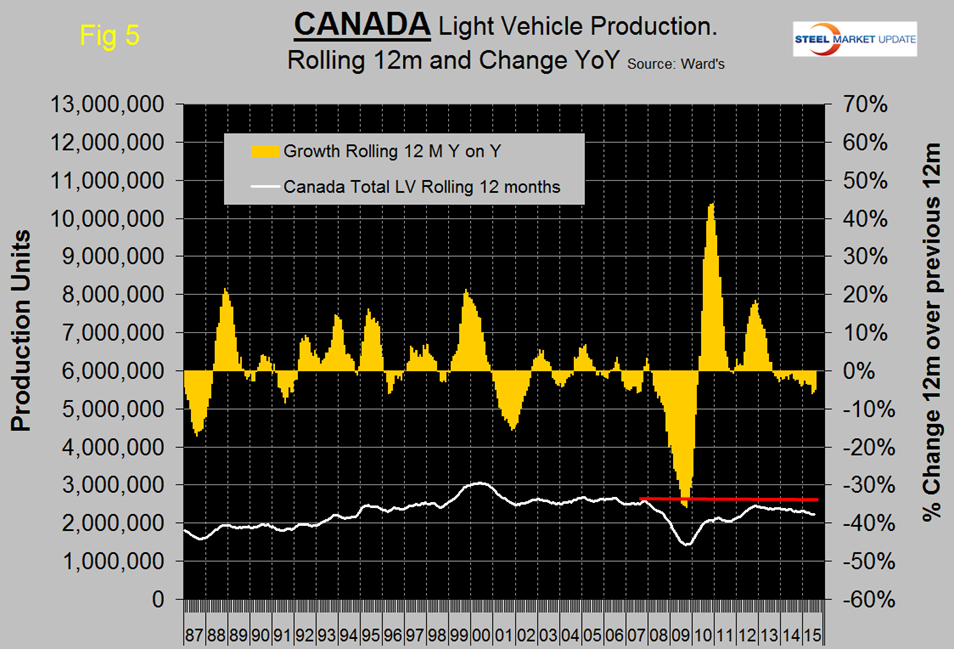
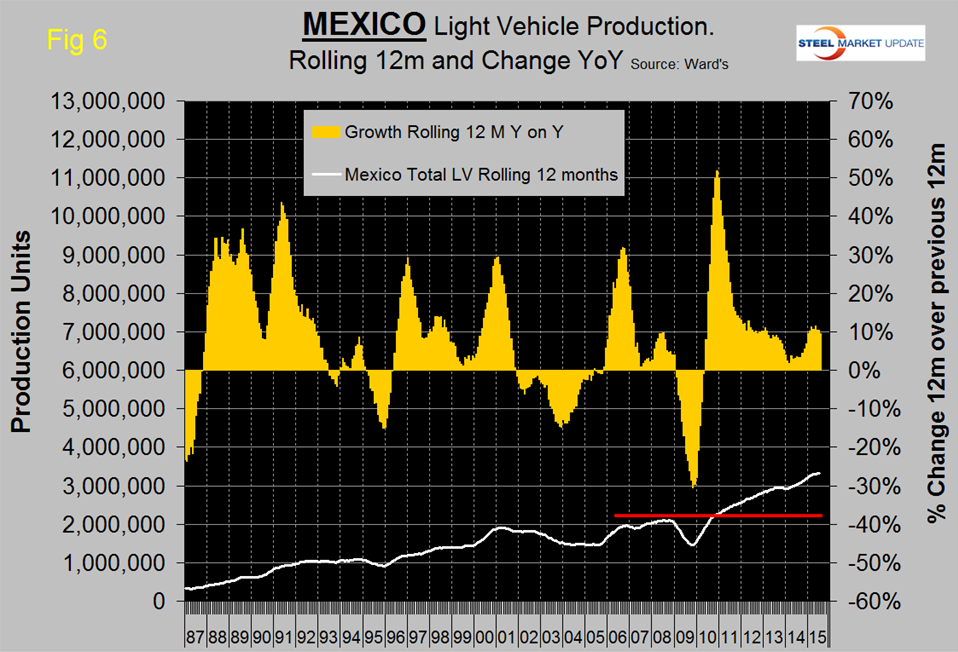
Note the scales are the same to give true comparability and that Mexican growth is surging at more than twice the rate in the US and Canada continues to contract. In the last two years US growth has slowed and contraction in Canada has accelerated. Mexico experienced a strong growth surge last year but has been stable in the 10 percent range this year.
The decline of both the Canadian dollar and the Mexican Peso must be causing auto assemblers to look at moving production to Mexico in particular. We believe there is spare capacity both sides of both borders for the automotive manufacturers to play this game. This isn’t happening so much in Canada in spite of the depreciation of the Loonie because (in our opinion) the labor relations situation in Canada is causing manufacturers in general to reduce their exposure. US steel is a case in point.
The mix of light vehicles is very different by country (Figure 7).
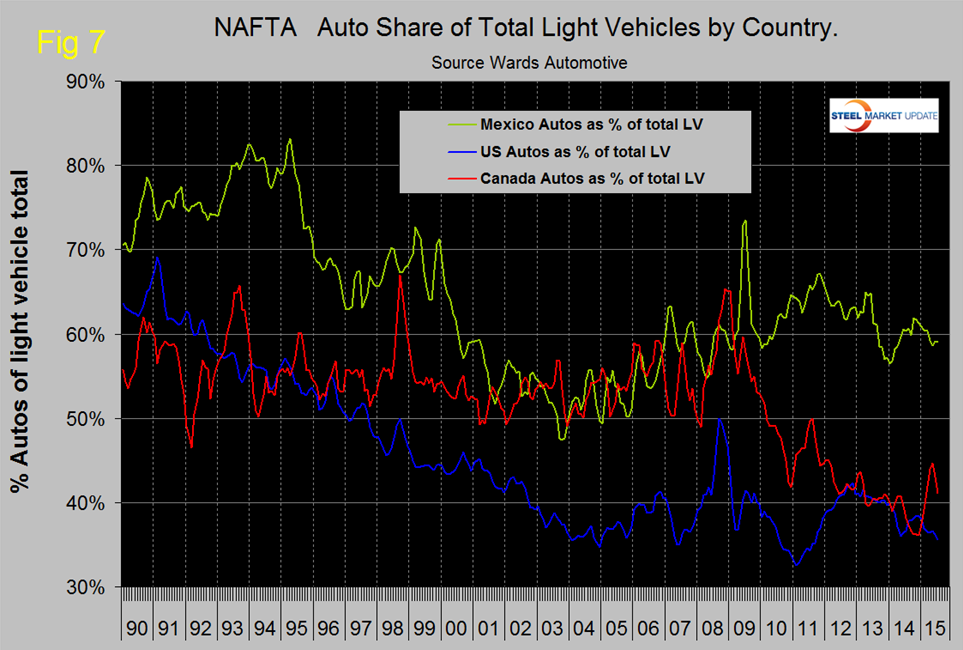
The percentage of autos in the Mexican mix in the last three months was 59.1 percent but only 35.6 in the US and 41.1 percent in Canada. This was the lowest percent of autos in the US mix since July 2011 as buyers preference tilts towards light trucks driven by declining gas prices.
Ward’s Automotive reported on Tuesday that total light vehicle inventories in the US decreased by 2 days of sales from 60 at the end of June to 58 at the end of July, three days less than the end of July last year. Month over month FCA (Fiat Chrysler Automotive) was up by 4 days to 82, Ford down by 2 days to 65 and GM down by 6 days to 64.
The SMU data file contains more detail than be shown here in this condensed report. Readers can obtain copies of additional time based performance results on request if they wish to dig deeper. Available are graphs of auto, light truck and medium and heavy truck production, growth rate and production share by country.