Market Data

August 19, 2015
Industrial Production and Manufacturing Capacity Utilization
Written by Peter Wright
Both these data points are reported in the Federal Reserve G17 data base. This month we have revised our data back through 1994 to account for massive revisions to the G17 data. Incidentally this is why many analysts question government data out of China who never revise their historical information.
![]()
The US sometimes revises data back 60 years or more. The IP index was consistently revised upward since 1994 and was reported as 107.477 for June, up by 0.56 percent from May. The index had an all-time high of 107.9108 in November last year then declined for five straight months through April. The three month moving average (3MMA) in June was 107.05, up by 0.14 from May. The y/y growth of the 3MMA has declined for the last five months through June when it reached 1.3 percent (Figure 1).
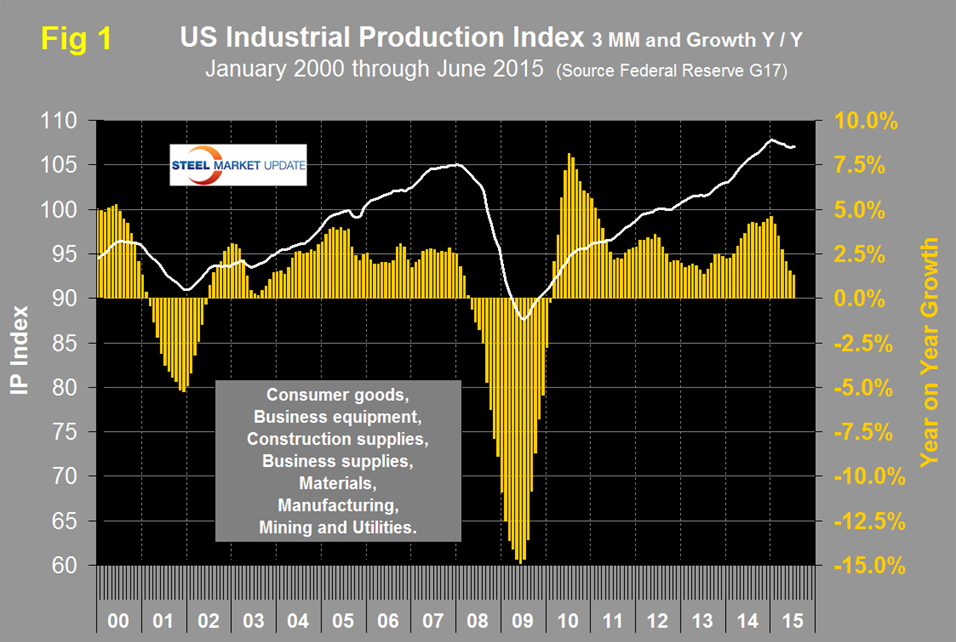
Data is seasonally adjusted and the index is based on the May 2012 level being defined as 100. According to the G17 data, automobile manufacture continued to be the primary driver of the IP index. In the motor vehicle sub-component alone, sales surged by 10.6 percent for the month. However, when vehicle manufacturing is excluded from the reading, core manufacturing rose only about 0.1 percent for the month. The weakest sector in manufacturing was the business equipment component, which edged only about 0.1 percent higher after dropping by 0.2 percent in May.
This data is similar to the ISM Manufacturing Index which has been expanding at a decreasing rate since June last year. Prior to the recession there was a reasonable correlation between industrial production and steel supply, (including imports) though steel was very much more volatile in this comparison just as it is against GDP (Figure 2).
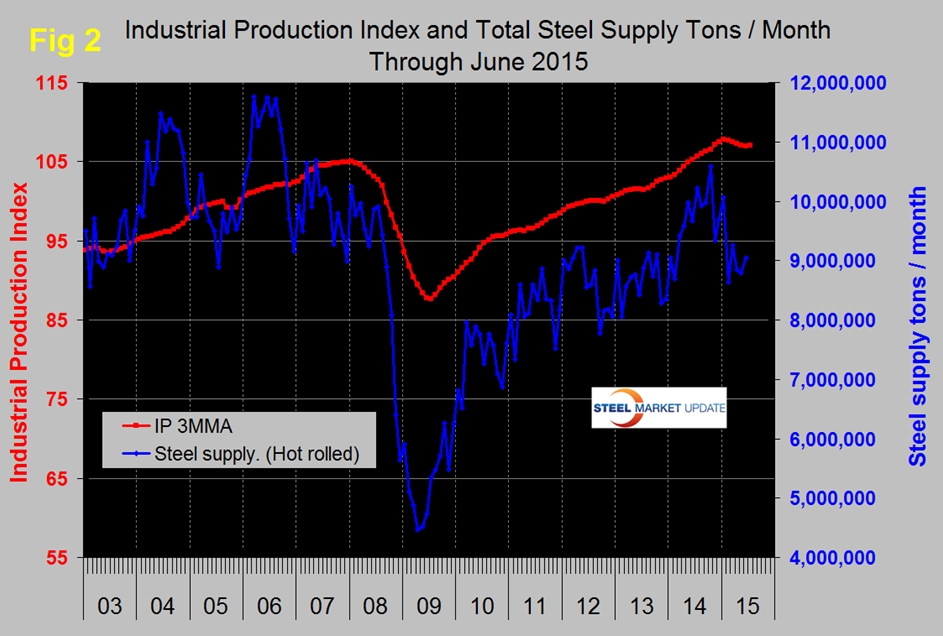
Steel supply took its seasonal dive in December then a much bigger dive in February with not much recovery in the last four months. Since January service centers have reduced inventory by 821,000 tons. This explains the steel line in Figure 2 assuming service centers are representative of the whole supply chain. Energy projects are now suffering from the current oil and gas price decline. Housing and non-residential construction are still a drag. Nonresidential won’t experience a full recovery until late 2017 at the earliest and at the present rate housing will be well into the next decade before we see the performance of 2005, which was over two million single and multifamily units.
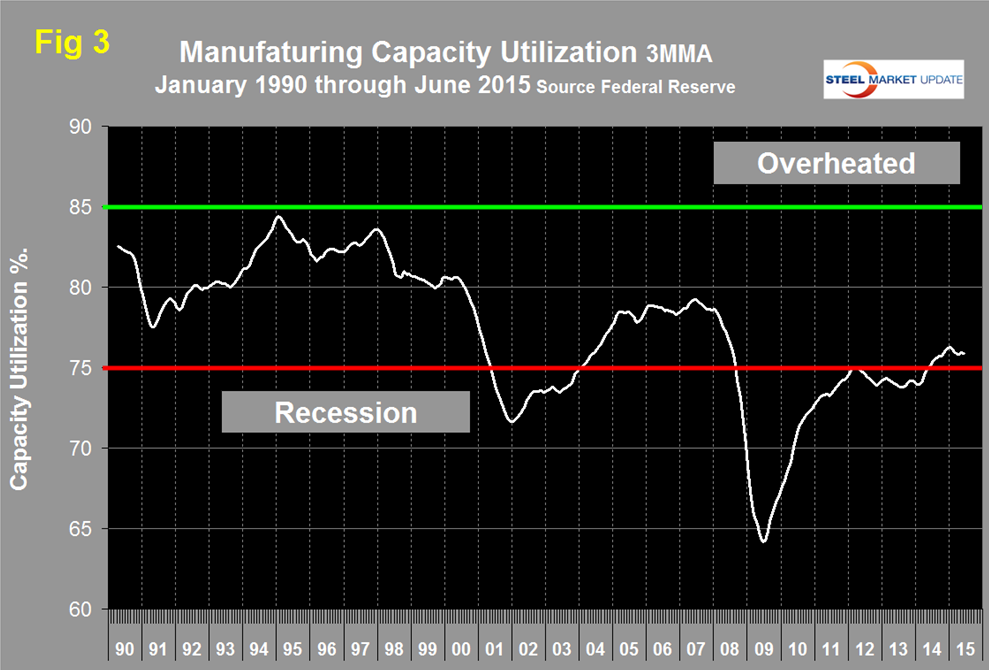
Manufacturing capacity utilization was also revised back through 1994 and in this case was systematically revised down. For example the previous May value was 76.97 percent, this was revised down to 75.66 in the new data. June came in at 76.21 with a 3MMA of 75.95 an increase on 0.07 from May but down by 0.32 since January (Figure 3).
SMU Comment: The manufacturing data discussed above is through June. The growth in manufacturing employment in July bounced back close to the January number therefore we are hopeful that the IP index and the ISM manufacturing index will enjoy a similar increase when the next data points are released.