Market Data

June 17, 2015
Industrial Production and Manufacturing Capacity Utilization
Written by Peter Wright
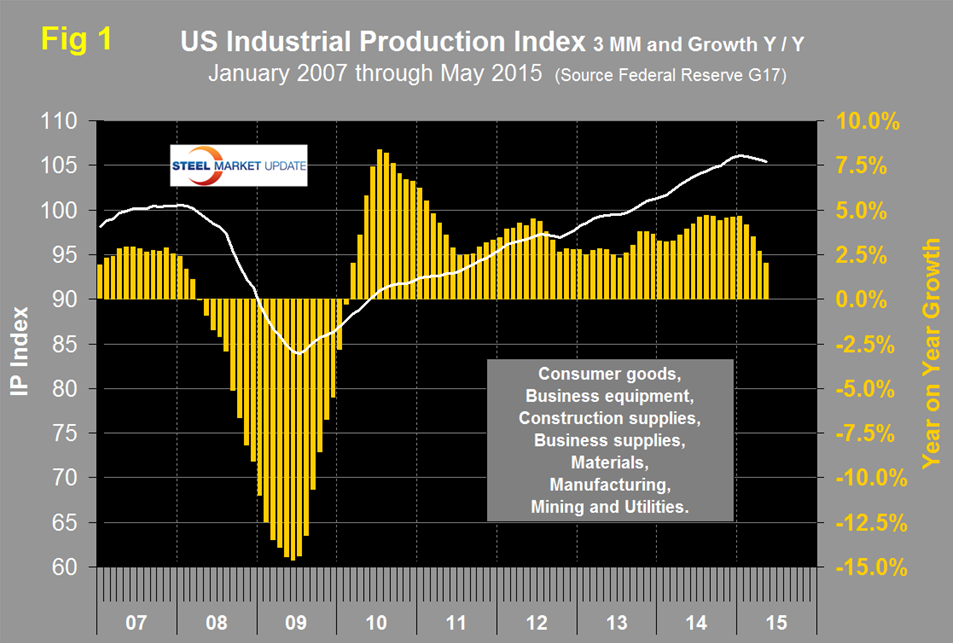
Both these data points are reported in the Federal Reserve G17 data base. The IP index was reported as 105.102 for May, down by 0.18 from April and down from the all-time high of 106.309 in November last year. The three month moving average, (3MMA) in May was 105.40, down by 0.23 from April. January was the highest value ever of the 3MMA at 106.11. The Y/Y growth rate of the 3MMA was 2.0 percent in May, the fourth consecutive month of decline.
Data is seasonally adjusted and the index is based on the July 2007 level being defined as 100. We have shortened the time axis of Figure 1 to better show the significance of the recent decline in the growth rate which was the slowest in five years.
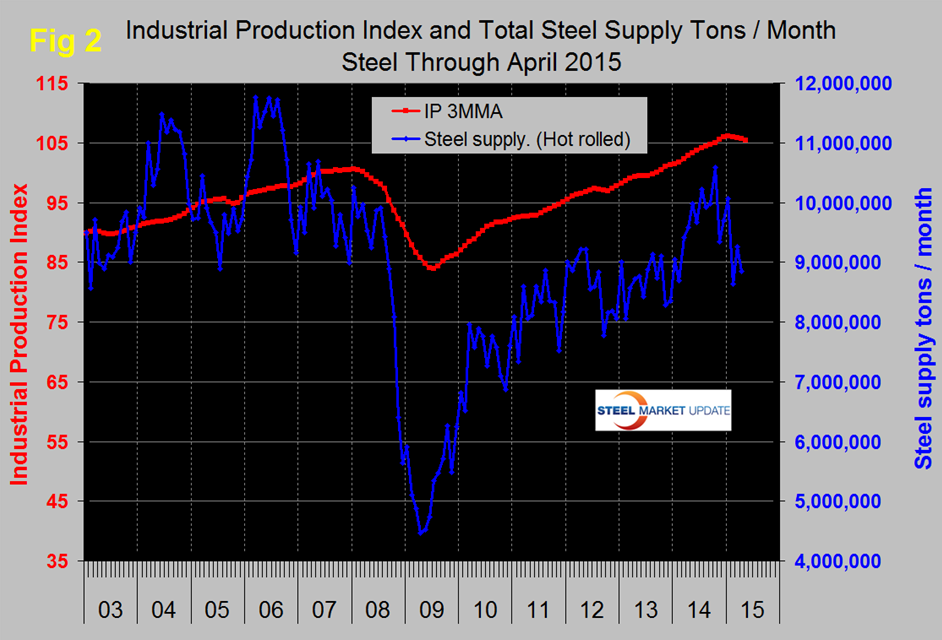
This data parallels the ISM manufacturing Index which has been expanding at a decreasing rate since June last year. Prior to the recession there was a reasonable correlation between industrial production and steel supply, (including imports) though steel was very much more volatile in this comparison just as it is against GDP, (Figure 2).
Steel supply took its seasonal dive in December then a much bigger dive in February with not much of a recovery in March and April. Manufacturing and energy have been the growth engines of steel demand since the recession. Energy projects are now suffering from the current oil and gas price decline. Housing and non-residential construction are still a drag. Nonresidential won’t experience a full recovery until late 2017 at the earliest and at the present rate housing will be well into the next decade before we see the performance of 2005, which was over two million single plus multifamily units.
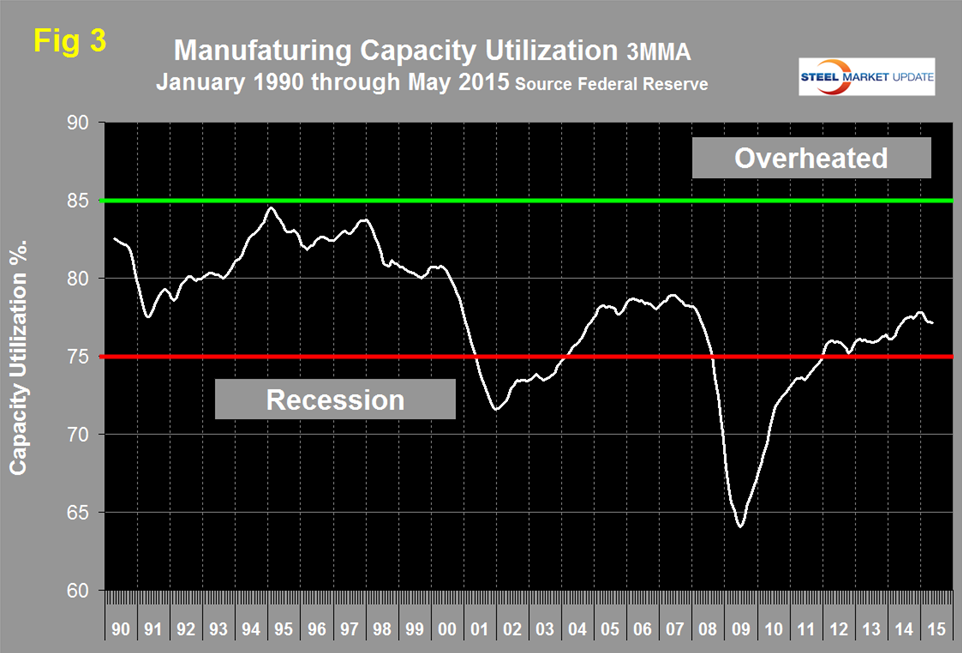
Manufacturing capacity utilization was 76.97 percent in May with a 3MMA of 77.14 which was a decline of 0.51 since last November, (Figure 3).
MAPI (the Manufacturers Alliance for Productivity and Innovation) made the following observations last week:
Several positive factors driving growth last year have since changed, lowering manufacturing growth potential for the year:
– The rapid declines in oil and natural gas prices were beneficial to energy users but caused a similarly rapid decline in investment in energy drilling, exploration, and the material supply chain.
– The sudden rise in the value of the dollar hurts our trade competitiveness. The U.S. economy is growing faster than most advanced economies and our central bank has ended quantitative easing and is talking about raising interest rates while other nations’ central banks are beginning quantitative easing. More U.S. spending goes to imports as our export growth slows, weakening domestic production growth.
– A large inventory buildup this winter drove the inventory to sales ratio to unwanted highs, contrasting with last year’s lean inventories. An inventory drawdown should subtract 1.1 percentage points from growth in the second quarter of 2015 versus adding 1.4 percentage points in the second quarter of 2014.
– Consumers are cautious and risk-averse. They used much of their windfall oil savings to pay down debt, muting the positive impact on the economy. The ramping up of housing starts is also below expectations.
The forecast for manufacturing production growth in 2015 is lower than previously expected. Three months ago, we expected growth of 3.7 percent in 2015. Now we forecast 2.5 percent growth for the year, following manufacturing production growth of 3.5 percent in 2014. Many of the adverse shocks that are slowing growth this year will be absorbed and will not hold down 2016 growth. With a return to a normal winter next year, manufacturing production should get a boost, posting 4.0 percent growth before decelerating to 3.1 percent growth in 2017.
SMU Comment: Manufacturing is slowing and two of the root causes, energy costs and the value of the dollar, are likely to be with us for a while. The inventory effect and the West coast port slowdowns are behind us and consumer spending should increase in the balance of the year. Vehicle sales skyrocketed in May to a seasonally adjusted annualized rate of 17.8 million units, the strongest pace in almost 10 years. We are encouraged by MAPI’s 4.0 percent growth forecast for 2016.


